The study involved four major activities in estimating the current size of the automotive V2X market. Exhaustive secondary research was done to collect information on the market, the peer market, and the child markets. The next step was to validate these findings, assumptions, and sizing with the industry experts across value chains through primary research. The top-down and bottom-up approaches were employed to estimate the complete market size. Thereafter, market breakdown and data triangulation processes were used to estimate the market size of segments and subsegments.
Secondary Research
In the secondary research process, various secondary sources such as company annual reports/presentations, press releases, industry association publications [for example, 5G Automotive Association, International Organization of Motor Vehicle Manufacturers (OICA), National Highway Traffic Safety Administration (NHTSA), International Energy Association (IEA)], articles, directories, technical handbooks, trade websites, technical articles, and databases (for example, Marklines, and Factiva) have been used to identify and collect information useful for an extensive commercial study of the global automotive V2X market.
Primary Research
Extensive primary research was conducted after acquiring an understanding of the automotive V2X market scenario through secondary research. Several primary interviews were conducted with market experts from both the demand (automotive OEMs) and supply (automotive V2X providers) sides across major regions, namely, North America, Europe, and Asia Pacific. Approximately 30% and 70% of primary interviews were conducted from the demand and supply sides, respectively. Primary data was collected through questionnaires, emails, and telephonic interviews.
In the canvassing of primaries, various departments within organizations, such as sales, operations, and marketing, were covered to provide a holistic viewpoint in the report. After interacting with industry experts, brief sessions were also conducted with highly experienced independent consultants to reinforce the findings from primaries. This, along with the in-house subject matter experts’ opinions, led to the findings described in the remainder of this report.

To know about the assumptions considered for the study, download the pdf brochure
Market Size Estimation
The bottom-up approach was used to estimate and validate the size of the automotive V2X market. This method was also used extensively to estimate the size of various subsegments in the market. The research methodology used to estimate the market size includes the following:
-
The key players in the industry and markets have been identified through extensive secondary research.
-
The industry’s supply chain and market size, in terms of volume, have been determined through primary and secondary research processes.
All percentage shares, splits, and breakdowns have been determined using secondary sources and verified through primary sources.

To know about the assumptions considered for the study, Request for Free Sample Report
Market Size Validation
The top-down approach was used to determine the size of the automotive V2X market for the offering, communication, propulsion, connectivity, technology, and vehicle type. The total market size in value (USD million) was derived using the top-down approach.
For instance, the automotive V2X market for the offering segment was derived using the top-down approach to estimate the hardware and software subsegments. Mapping was carried out at the regional level to understand the contribution by type of offering. The market size was derived at the regional level in terms of value. The total value of the market was multiplied by the cost penetration percentage of each segment at the regional level.

Data Triangulation
After arriving at the overall market size—using the market size estimation processes as explained above—the market was split into several segments and subsegments. To complete the overall market engineering process and arrive at the exact statistics of each market segment and subsegment, data triangulation, and market breakdown procedures were employed, wherever applicable. The data was triangulated by studying various factors and trends from both the demand and supply sides.
Market Definition
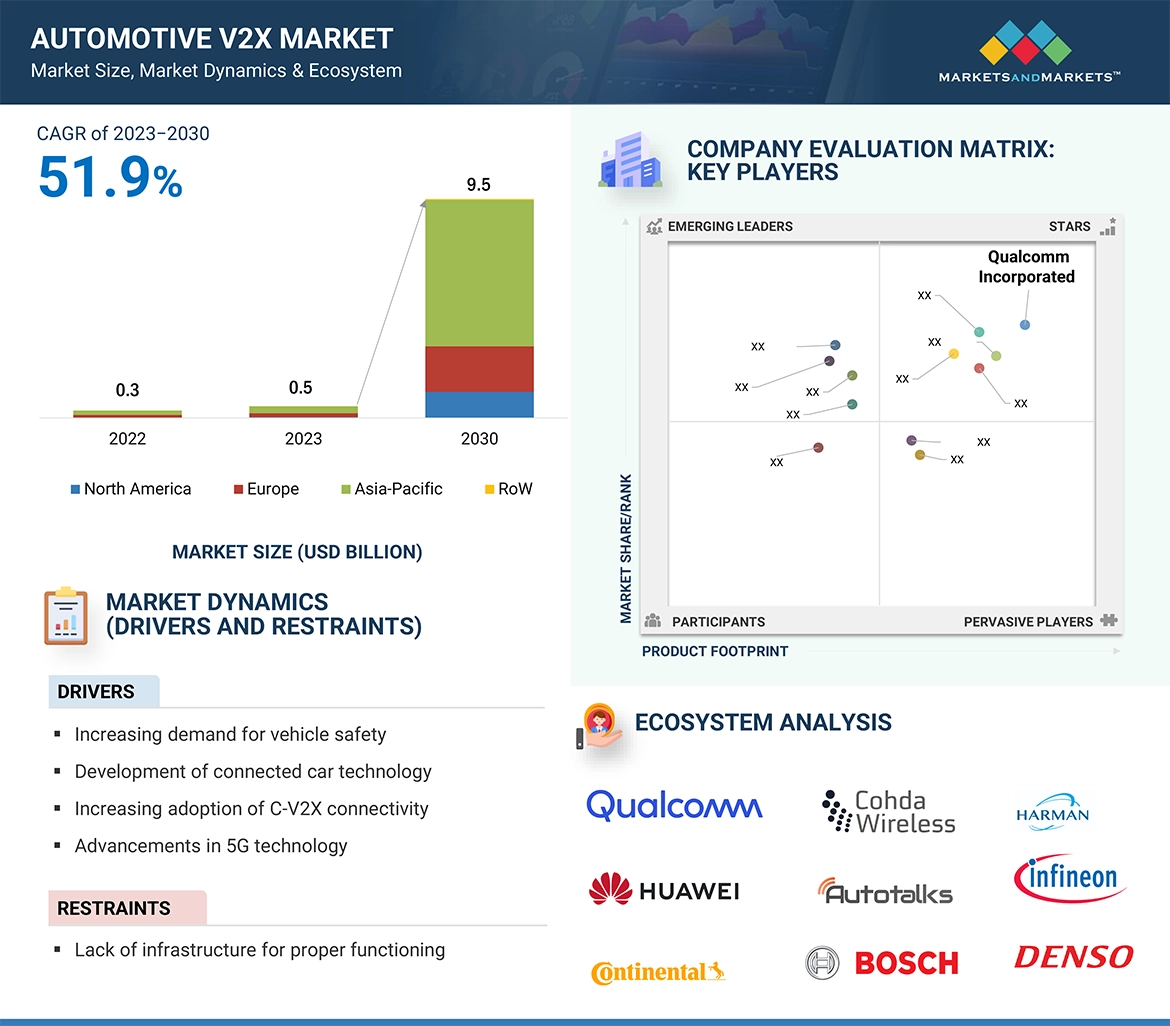
Automotive V2X, or Vehicle-to-Everything, refers to a communication technology that enables vehicles to communicate with each other and with various elements in their environment. The "X" in V2X encompasses a wide range of entities, including other vehicles (V2V), infrastructure (V2I), pedestrians (V2P), and grid (V2G). This interconnected communication system aims to enhance road safety, traffic efficiency, and overall transportation ecosystem by facilitating the exchange of real-time information and data between different entities. V2X technology utilizes wireless communication protocols, such as Dedicated Short-Range Communication (DSRC) or Cellular Vehicle-to-Everything (C-V2X), to enable vehicles and other elements in the transportation network to share information.
List of Key Stakeholders
-
Automotive Original Equipment Manufacturers (OEMs)
-
Distributors and Retailers
-
Electronic Design Automation (EDA) and Internet Protocol (IP) Core Vendors
-
Navigation Devices and GPS Manufacturers
-
ODM and OEM Technology Solution Providers
-
Operating System (OS) Vendors
-
Raw Material and Manufacturing Equipment Suppliers
-
Regulatory and Transportation Authorities
-
Software Providers
-
V2X Providers
-
Organizations, Forums, Alliances, and Associations
-
State & National Regulatory Authorities
Report Objectives
-
To segment and forecast the automotive vehicle-to-everything (V2X) market in terms of value (USD million) and volume (thousand units)
-
To analyze and forecast the market based on unit, offering, communication, propulsion, connectivity, vehicle type, technology, aftermarket offering and region.
-
To segment and forecast the market based on unit (on-board unit and
roadside unit)
-
To segment and forecast the market based on offering (hardware and software)
-
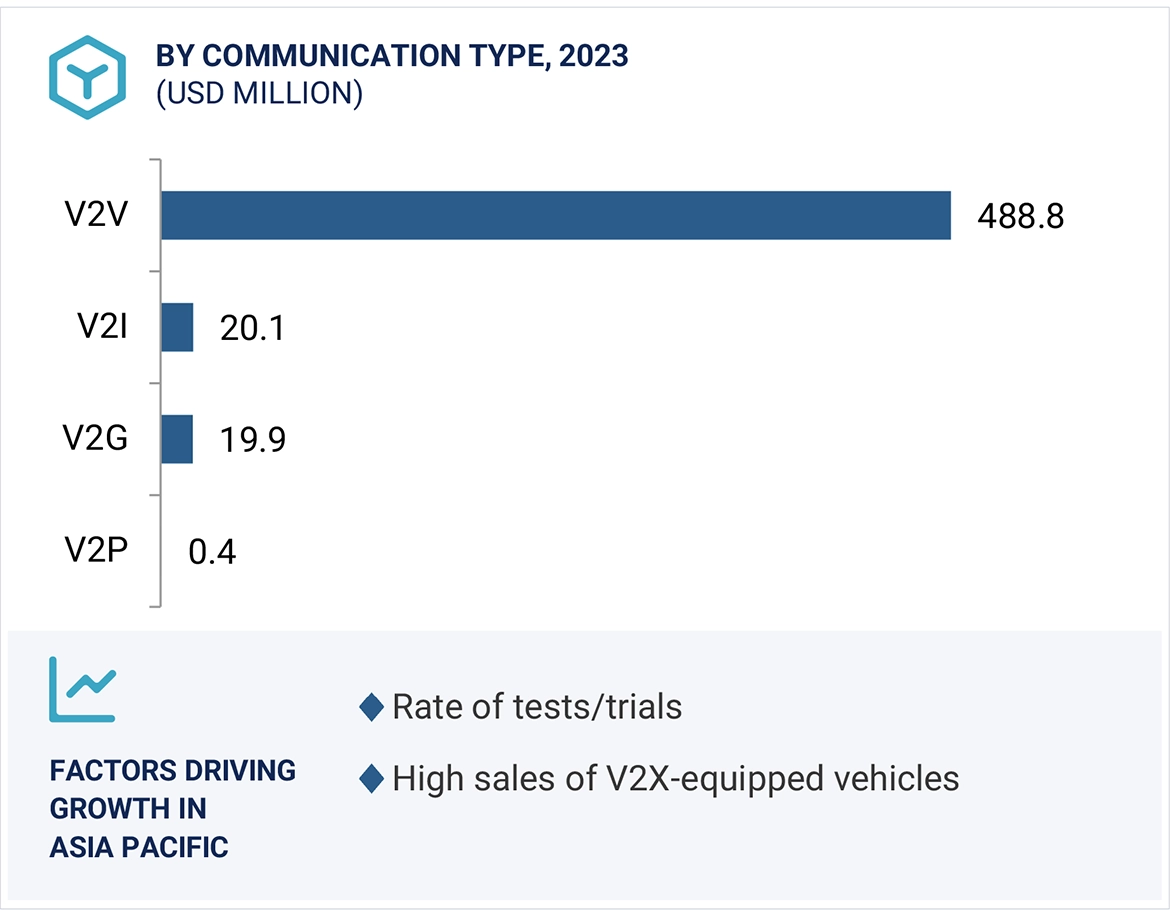
To segment and forecast the market size based on communication [Vehicle-to-Vehicle (V2V), Vehicle-to-Infrastructure (V2I), Vehicle-to-Pedestrian (V2P), Vehicle-to-Grid (V2G)]
-
To segment and forecast the market based on connectivity [(Dedicated Short-Range Communication (DSRC) and Cellular V2X)]
-
To segment and forecast the market based on vehicle type (passenger cars and commercial vehicles)
-
To segment and forecast the market based on propulsion (ICE and EV)
-
To segment and forecast the market based on technology (automated driver assistance, intelligent traffic system, emergency vehicle notification, passenger information system, fleet and asset management, parking management system, line of sight, non-line of sight, and backing)
-
To segment and forecast the market based on aftermarket offering (hardware, software, and service)
-
To forecast the market with respect to key regions, namely, North America, Europe, Asia Pacific, and the Rest of the World
-
To analyze the technological developments impacting the market
-
To analyze opportunities for stakeholders and the competitive landscape for market leaders
-
To provide detailed information regarding the major factors influencing the market growth (drivers, challenges, restraints, and opportunities)
-
To strategically analyze markets with respect to individual growth trends, prospects, and contributions to the total market
-
To study the following with respect to the market
-
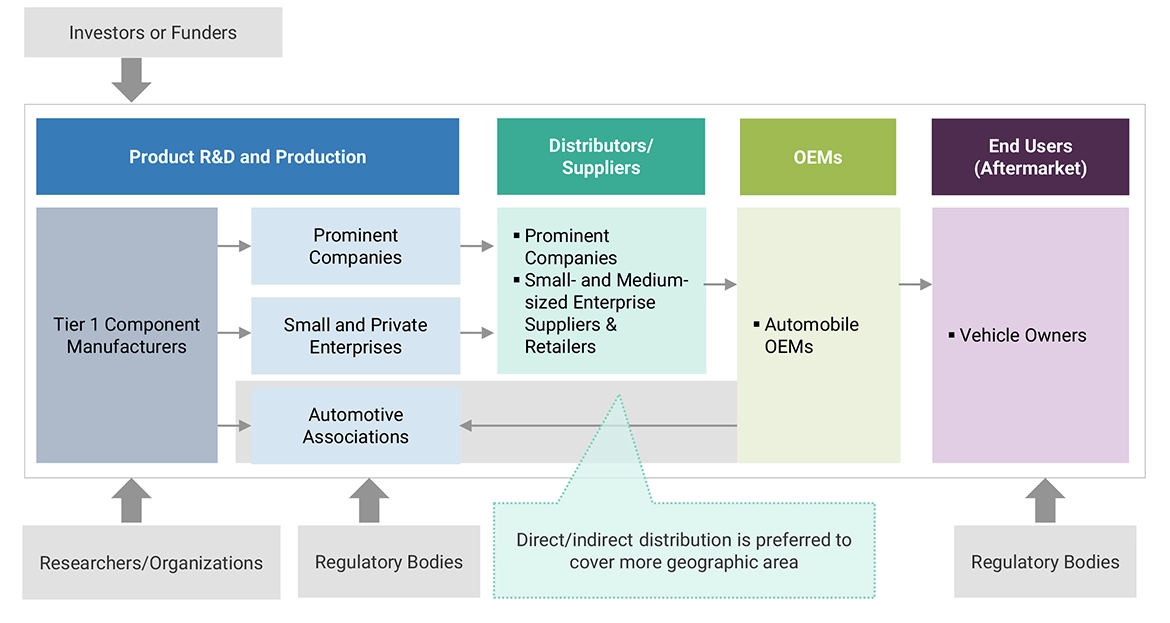
Supply Chain Analysis
-
Ecosystem Analysis
-
Technology Analysis
-
Case Study Analysis
-
Patent Analysis
-
Buying Criteria
-
Pricing Analysis
-
To strategically profile key players and comprehensively analyze their market shares and core competencies
-
To track and analyze competitive developments such as new product developments, deals and other activities carried out by key industry participants
Available Customizations
With the given market data, MarketsandMarkets offers customizations in line with the company’s specific needs.
-
Further breakdown of the automotive V2X Market by EV Type
-
Additional countries (apart from those already considered in the report) with significant market presence
-
Company Information
-
Profiles of additional market players (up to five)


Growth opportunities and latent adjacency in Automotive V2X Market