Valve Controller Market by Type (Traditional and Digital Valve Controller), Digital Valve Controller Communication Protocol, End-use Industry (Oil & Gas, Energy & Power, Water & Wastewater Treatment), and Geography - Global forecast to 2035


The global valve controller market is experiencing steady expansion, driven by increasing industrial automation, digital transformation of process industries, and rapid integration of smart control systems across oil & gas, water treatment, power generation, and chemical processing sectors. In 2025, the global valve controller market size is estimated at USD 7.2 billion, and it is projected to reach USD 14.8 billion by 2035, expanding at a CAGR of 7.5% during the forecast period 2025–2035.
Valve controller market Key Market Trends & Insights
Valve controller market Market Size & Forecast
- Base Year Market Size (2025): USD 7.2 Billion
- Forecast Market Size (2035): USD 14.8 Billion
- CAGR (2025–2035): 7.5%
Valve controller market Market Top 10 key takeaway
- The market is projected to nearly double between 2025 and 2035.
- Oil & gas remains the largest end-use industry segment.
- Asia Pacific is the fastest-growing regional market.
- Smart valve controllers are replacing conventional pneumatic systems.
- AI-enabled predictive maintenance is reducing downtime significantly.
- IoT integration is enhancing real-time process monitoring.
- Wireless valve controllers are gaining strong traction in remote operations.
- Energy efficiency regulations are driving replacement demand.
- Cloud-based industrial automation is reshaping system architecture.
- Industrial digital transformation is the core long-term growth driver.
- valve controller market Product Insights
Valve controller market Technology / Component Insights
- Rising adoption of IoT-enabled smart sensors
- AI-based predictive maintenance integration
- Expansion of cloud-based industrial control platforms
- Growth of edge computing in valve automation
- Development of digital twin valve simulation systems
Valve controller market Application Insights
- Oil & gas dominates due to complex process requirements
- Water treatment sector shows strong infrastructure-driven growth
- Power generation relies on automation for efficiency improvement
- Chemical industry demands high-precision flow control systems
- Pharmaceuticals adopting sterile and automated valve systems
- valve controller market Regional Insights
Regional Insights:
- North America leads with advanced industrial automation
- Europe driven by sustainability and regulatory compliance
- Asia Pacific fastest-growing due to industrial expansion
- Middle East shows strong oil & gas-driven demand
- Latin America emerging with infrastructure modernization
Valve controller market Specific Market Trends
- China leads APAC growth with manufacturing expansion
- Japan focuses on precision automation systems
- United States drives AI-based industrial control adoption
- Germany dominates Europe with Industry 4.0 leadership
- France and Canada invest in energy modernization systems
Valve controller market Key Company Insights
- Focus on AI-enabled smart valve controllers
- Expansion of IoT-based industrial automation solutions
- Strong investment in predictive maintenance technology
- Strategic acquisitions to enhance product portfolios
- Development of cloud-integrated control platforms
Valve controller market Market Segmentation
- Electric valve controllers dominate product segment
- AI and IoT lead technology transformation
- Oil & gas remains key application area
- Asia Pacific fastest-growing regional segment
- North America maintains overall market leadership
Valve controller market War Impact
The market will expand with AI-driven autonomous industrial systems and digital twin integration.. .
To speak to our analyst for a discussion on the above findings, click Speak to Analyst
 Exclusive indicates content/data unique to MarketsandMarkets and not available with any competitors.
TABLE OF CONTENTS
1 INTRODUCTION (Page No. - 17)
1.1 STUDY OBJECTIVES
1.2 MARKET DEFINITION
1.2.1 INCLUSIONS & EXCLUSIONS
1.3 STUDY SCOPE
1.3.1 MARKETS COVERED
1.3.2 GEOGRAPHIC SCOPE
1.3.3 YEARS CONSIDERED FOR THE STUDY
1.4 CURRENCY
1.5 LIMITATIONS
1.6 MARKET STAKEHOLDERS
2 RESEARCH METHODOLOGY (Page No. - 21)
2.1 RESEARCH DATA
2.1.1 SECONDARY AND PRIMARY RESEARCH
2.1.2 SECONDARY DATA
2.1.2.1 Key data from secondary sources
2.1.3 PRIMARY DATA
2.1.3.1 Breakdown of primaries
2.1.3.2 Key data from primary sources
2.2 MARKET SIZE ESTIMATION
2.2.1 BOTTOM-UP APPROACH
2.2.2 TOP-DOWN APPROACH
2.3 MARKET BREAKDOWN AND DATA TRIANGULATION
2.4 ASSUMPTIONS
3 EXECUTIVE SUMMARY (Page No. - 30)
3.1 COVID-19 & OIL PRICE CRISIS IMPACT ON VALVE CONTROLLER MARKET: REALISTIC SCENARIO
3.2 COVID-19 & OIL PRICE CRISIS IMPACT ON VALVE CONTROLLER MARKET: OPTIMISTIC SCENARIO
3.3 COVID-19 & OIL PRICE CRISIS IMPACT ON VALVE CONTROLLER MARKET: PESSIMISTIC SCENARIO
4 PREMIUM INSIGHTS (Page No. - 36)
4.1 ATTRACTIVE GROWTH OPPORTUNITIES IN VALVE CONTROLLER MARKET
4.2 MARKET, BY TYPE
4.3 DIGITAL VALVE CONTROLLER MARKET, BY COMMUNICATION PROTOCOL
4.4 MARKET IN APAC, BY COUNTRY AND END-USE INDUSTRY, 2025
4.5 MARKET, BY COUNTRY (2025)
5 MARKET OVERVIEW (Page No. - 39)
5.1 INTRODUCTION
5.2 MARKET DYNAMICS
5.2.1 DRIVERS
5.2.1.1 Rising importance of monitoring & controlling in the process industries for improved efficiency
5.2.1.2 Increasing demand for fuel and power
5.2.1.3 Growing need for connected networks to maintain and monitor various equipment in plants
5.2.1.4 Surging focus on establishing new nuclear power plants and upscaling of existing ones
5.2.2 RESTRAINTS
5.2.2.1 Lack of standardized norms and governing policies
5.2.3 OPPORTUNITIES
5.2.3.1 Need for valve replacement and adoption of smart valves
5.2.3.2 Introduction of IIoT and Industry 4.0
5.2.4 CHALLENGES
5.2.4.1 Rise in collaboration among industry players
5.3 VALUE CHAIN ANALYSIS
5.4 COVID-19 IMPACT ON KEY END-USE INDUSTRIES OF VALVE CONTROLLER
5.4.1 COVID-19 IMPACT ON OIL & GAS INDUSTRY
5.4.2 COVID-19 IMPACT ON ENERGY & POWER INDUSTRY
5.4.3 COVID-19 IMPACT ON WATER & WASTEWATER TREATMENT INDUSTRY
6 VALVE CONTROLLER MARKET, BY TYPE (Page No. - 49)
6.1 INTRODUCTION
6.2 TRADITIONAL VALVE CONTROLLER
6.2.1 TRADITIONAL VALVE CONTROLLERS BEING REPLACED BY DIGITAL VALVE CONTROLLERS
6.3 DIGITAL VALVE CONTROLLER
6.3.1 KEY FEATURES OF DIGITAL VALVE CONTROLLERS MAKE THEM SUITABLE FOR USE ACROSS INDUSTRIES
7 DIGITAL VALVE CONTROLLER MARKET, BY COMMUNICATION PROTOCOL (Page No. - 53)
7.1 INTRODUCTION
7.2 FOUNDATION FIELDBUS
7.2.1 FOUNDATION FIELDBUS TO BE THE FASTEST-GROWING SEGMENT
7.3 HIGHWAY ADDRESSABLE REMOTE TRANSDUCER (HART)
7.3.1 WIDELY USED COMMUNICATION PROTOCOL IN SEVERAL INDUSTRIES
7.4 PROFIBUS (PROCESS FIELD BUS)
7.4.1 PREFERRED IN PROCESS AUTOMATION APPLICATIONS AND FOR DECENTRALIZED EQUIPMENT
7.5 OTHERS
7.5.1 ETHERNET
7.5.2 CANOPEN
7.5.3 MODBUS
7.5.4 BLUETOOTH
8 VALVE CONTROLLER MARKET, BY END-USE INDUSTRY (Page No. - 59)
8.1 INTRODUCTION
8.2 OIL & GAS
8.2.1 OIL & GAS INDUSTRY TO WITNESS A MAJOR SETBACK IN 2020 DUE TO COVID-19 PANDEMIC AND OIL PRICE CRISIS
8.3 WATER & WASTEWATER TREATMENT
8.3.1 RISE IN DEMAND FOR CLEANER WATER AND MODIFICATION IN OLDER WATER INFRASTRUCTURE TO AUGMENT DEMAND FOR VALVE CONTROLLERS
8.4 ENERGY & POWER
8.4.1 INCREASING DEMAND FOR ENERGY IN DEVELOPING COUNTRIES TO BOOST THE MARKET BY 2025
8.5 PHARMACEUTICAL & HEALTHCARE
8.5.1 NORTH AMERICA TO DRIVE THE MARKET IN THIS SEGMENT
8.6 FOOD & BEVERAGE
8.6.1 IMPLEMENTATION OF VALVE CONTROLLERS ALONG WITH CONTROL VALVES INCREASE THE EFFICIENCY OF PROCESSES
8.7 CHEMICAL
8.7.1 VALVE CONTROLLERS MEET THE MOST STRINGENT PROTECTION REQUIREMENTS AND STANDARDS IN THIS INDUSTRY
8.8 BUILDING & CONSTRUCTION
8.8.1 BUILDING & CONSTRUCTION INDUSTRY TO WITNESS SIGNIFICANT DECLINE IN 2020 DUE TO COVID-19 IMPACT ON SMART INFRASTRUCTURE PROJECTS
8.9 PULP & PAPER
8.9.1 VALVE CONTROLLERS HELP IN PREDICTIVE MAINTENANCE OF EQUIPMENT USED IN PULP & PAPER MANUFACTURING
8.10 METALS & MINING
8.10.1 GROWING DEMAND FOR PREDICTIVE MAINTENANCE ENCOURAGING THE USE OF VALVE CONTROLLERS
8.11 OTHERS
9 GEOGRAPHIC ANALYSIS (Page No. - 85)
9.1 INTRODUCTION
9.2 NORTH AMERICA
9.2.1 US
9.2.1.1 Aging water & wastewater infrastructure in the US generating demand for valve controllers
9.2.2 CANADA
9.2.2.1 Rise in energy demand to propel the market growth in the next few years
9.2.3 MEXICO
9.2.3.1 An uptrend in the water & wastewater treatment industry to drive the market in Mexico
9.3 EUROPE
9.3.1 UK
9.3.1.1 Water industry to fuel the demand for control valves
9.3.2 GERMANY
9.3.2.1 Growth of process industries encouraging the valve controller market growth in the country
9.3.3 FRANCE
9.3.3.1 Energy & power sector to drive the valve controller market in the country
9.3.4 ITALY
9.3.4.1 Market to be driven by upcoming investments in water & wastewater treatment industry
9.3.5 REST OF EUROPE
9.4 ASIA PACIFIC (APAC)
9.4.1 CHINA
9.4.1.1 market in China to be driven by the demand from the energy & power sector
9.4.2 JAPAN
9.4.2.1 Reintegration of nuclear power plants to boost the market in the country
9.4.3 INDIA
9.4.3.1 India to be the fastest-growing country in the APAC valve controller market
9.4.4 REST OF APAC
9.5 REST OF THE WORLD (ROW)
9.5.1 MIDDLE EAST & AFRICA
9.5.1.1 COVID-19 pandemic to adversely affect the Middle East & African market
9.5.2 SOUTH AMERICA
9.5.2.1 Market projected to register slower growth due to the pandemic
10 COMPETITIVE LANDSCAPE (Page No. - 107)
10.1 COMPETITIVE STRATEGIES
10.2 COMPETITIVE ANALYSIS
10.2.1 RANKING ANALYSIS OF VALVE CONTROLLER MARKET, 2019
10.3 COMPETITIVE SCENARIO
10.3.1 PARTNERSHIPS, MERGERS, ACQUISITIONS, AND AGREEMENTS
10.3.2 PRODUCT DEVELOPMENTS/LAUNCHES
10.4 COMPETITIVE LEADERSHIP MAPPING
10.4.1 VISIONARY LEADERS
10.4.2 DYNAMIC DIFFERENTIATORS
10.4.3 INNOVATORS
10.4.4 EMERGING COMPANIES
11 COMPANY PROFILES (Page No. - 113)
(Business overview, Products offered, Recent Developments, SWOT Analysis, MNM view)*
11.1 INTRODUCTION
11.2 KEY PLAYERS
11.2.1 EMERSON
11.2.2 METSO
11.2.3 CIRCOR INTERNATIONAL INC.
11.2.4 ABB
11.2.5 SCHNEIDER ELECTRIC
11.2.6 FLOWSERVE CORPORATION
11.2.7 SMC CORPORATION
11.2.8 AZBIL
11.2.9 BAKER HUGHES
11.2.10 ROTORK
11.2.11 SIEMENS
11.2.12 IMI
11.2.13 CLA-VAL
11.2.14 DYMAX CORPORATION
11.2.15 TOKYO KEIKI
11.3 RIGHT TO WIN
11.4 OTHER IMPORTANT PLAYERS
11.4.1 CURTISS-WRIGHT CORPORATION
11.4.2 SAMSON CONTROLS
11.4.3 VRG CONTROLS
11.4.4 POWER-GENEX
11.4.5 DWYER INSTRUMENTS
11.4.6 AKRON BRASS COMPANY
11.4.7 KSB
11.4.8 KZ VALVE
11.4.9 GEFRAN S.P.A
11.4.10 ENOVATION CONTROLS
11.4.11 YEAGLE TECHNOLOGY INC
11.4.12 PR ELECTRONICS
11.4.13 VAL CONTROLS A/S
11.4.14 ELKHART BRASS MANUFACTURING COMPANY, INC.
11.4.15 AXIOMATIC TECHNOLOGIES CORPORATION
*Details on Business overview, Products offered, Recent Developments, SWOT Analysis, MNM view might not be captured in case of unlisted companies.
12 APPENDIX (Page No. - 157)
12.1 DISCUSSION GUIDE
12.2 KNOWLEDGE STORE: MARKETSANDMARKETS’ SUBSCRIPTION PORTAL
12.3 AVAILABLE CUSTOMIZATIONS
12.4 RELATED REPORTS
12.5 AUTHOR DETAILS
LIST OF TABLES (78 Tables)
TABLE 1 VALVE CONTROLLER MARKET, BY TYPE, 2017–2025 (USD MILLION)
TABLE 2 DIGITAL VALVE CONTROLLER MARKET, BY COMMUNICATION PROTOCOL, 2017–2025 (USD MILLION)
TABLE 3 MARKET SIZE, BY END-USE INDUSTRY, 2017–2025 (USD MILLION)
TABLE 4 MARKET SIZE IN OIL & GAS END-USE INDUSTRY, BY REGION, 2017–2025 (USD THOUSAND)
TABLE 5 MARKET SIZE IN OIL & GAS END-USE INDUSTRY IN NORTH AMERICA, BY COUNTRY, 2017–2025 (USD THOUSAND)
TABLE 6 MARKET SIZE IN OIL & GAS END-USE INDUSTRY IN EUROPE, BY COUNTRY, 2017–2025 (USD THOUSAND)
TABLE 7 MARKET SIZE IN OIL & GAS END-USE INDUSTRY IN APAC, BY COUNTRY, 2017–2025 (USD THOUSAND)
TABLE 8 MARKET SIZE IN OIL & GAS END-USE INDUSTRY IN ROW, BY REGION, 2017–2025 (USD THOUSAND)
TABLE 9 MARKET SIZE IN WATER & WASTEWATER TREATMENT END-USE INDUSTRY, BY REGION, 2017–2025 (USD THOUSAND)
TABLE 10 MARKET SIZE IN WATER & WASTEWATER TREATMENT END-USE INDUSTRY IN NORTH AMERICA, BY COUNTRY, 2017–2025 (USD THOUSAND)
TABLE 11 MARKET SIZE IN WATER & WASTEWATER TREATMENT END-USE INDUSTRY IN EUROPE, BY COUNTRY, 2017–2025 (USD THOUSAND)
TABLE 12 MARKET SIZE IN WATER & WASTEWATER TREATMENT END-USE INDUSTRY IN APAC, BY COUNTRY, 2017–2025 (USD THOUSAND)
TABLE 13 MARKET SIZE IN WATER & WASTEWATER TREATMENT END-USE INDUSTRY IN ROW, BY REGION, 2017–2025 (USD THOUSAND)
TABLE 14 MARKET SIZE IN ENERGY & POWER END-USE INDUSTRY, BY REGION, 2017–2025 (USD THOUSAND)
TABLE 15 MARKET SIZE IN ENERGY & POWER END-USE INDUSTRY IN NORTH AMERICA, BY COUNTRY, 2017–2025 (USD THOUSAND)
TABLE 16 MARKET SIZE IN ENERGY & POWER END-USE INDUSTRY IN EUROPE, BY COUNTRY, 2017–2025 (USD THOUSAND)
TABLE 17 MARKET SIZE IN ENERGY & POWER END-USE INDUSTRY IN APAC, BY COUNTRY, 2017–2025 (USD THOUSAND)
TABLE 18 MARKET SIZE IN ENERGY & POWER END-USE INDUSTRY IN ROW, BY REGION, 2017–2025 (USD THOUSAND)
TABLE 19 MARKET SIZE IN PHARMACEUTICAL & HEALTHCARE END-USE INDUSTRY, BY REGION, 2017–2025 (USD THOUSAND)
TABLE 20 MARKET SIZE IN PHARMACEUTICAL & HEALTHCARE END-USE INDUSTRY IN NORTH AMERICA, BY COUNTRY, 2017–2025 (USD THOUSAND)
TABLE 21 MARKET SIZE IN PHARMACEUTICAL & HEALTHCARE END-USE INDUSTRY IN EUROPE, BY COUNTRY, 2017–2025 (USD THOUSAND)
TABLE 22 MARKET SIZE IN PHARMACEUTICAL & HEALTHCARE END-USE INDUSTRY IN APAC, BY COUNTRY, 2017–2025 (USD THOUSAND)
TABLE 23 MARKET SIZE IN PHARMACEUTICAL & HEALTHCARE END-USE INDUSTRY IN ROW, BY REGION, 2017–2025 (USD THOUSAND)
TABLE 24 MARKET SIZE IN FOOD & BEVERAGE END-USE INDUSTRY, BY REGION, 2017–2025 (USD THOUSAND)
TABLE 25 MARKET SIZE IN FOOD & BEVERAGE END-USE INDUSTRY IN NORTH AMERICA, BY COUNTRY, 2017–2025 (USD THOUSAND)
TABLE 26 MARKET SIZE IN FOOD & BEVERAGE END-USE INDUSTRY IN EUROPE, BY COUNTRY, 2017–2025 (USD THOUSAND)
TABLE 27 MARKET SIZE IN FOOD & BEVERAGE END-USE INDUSTRY IN APAC, BY COUNTRY, 2017–2025 (USD THOUSAND)
TABLE 28 MARKET SIZE IN FOOD & BEVERAGE END-USE INDUSTRY IN ROW, BY REGION, 2017–2025 (USD THOUSAND)
TABLE 29 MARKET SIZE IN CHEMICAL END-USE INDUSTRY, BY REGION, 2017–2025 (USD THOUSAND)
TABLE 30 MARKET SIZE IN CHEMICAL END-USE INDUSTRY IN NORTH AMERICA, BY COUNTRY, 2017–2025 (USD THOUSAND)
TABLE 31 MARKET SIZE IN CHEMICAL END-USE INDUSTRY IN EUROPE, BY COUNTRY, 2017–2025 (USD THOUSAND)
TABLE 32 VALVE CONTROLLER MARKET SIZE IN CHEMICAL END-USE INDUSTRY IN APAC, BY COUNTRY, 2017–2025 (USD THOUSAND)
TABLE 33 MARKET SIZE IN CHEMICAL END-USE INDUSTRY IN ROW, BY REGION, 2017–2025 (USD THOUSAND)
TABLE 34 MARKET SIZE IN BUILDING & CONSTRUCTION END-USE INDUSTRY, BY REGION, 2017–2025 (USD THOUSAND)
TABLE 35 MARKET SIZE IN BUILDING & CONSTRUCTION END-USE INDUSTRY IN NORTH AMERICA, BY COUNTRY, 2017–2025 (USD THOUSAND)
TABLE 36 MARKET SIZE IN BUILDING & CONSTRUCTION END-USE INDUSTRY IN EUROPE, BY COUNTRY, 2017–2025 (USD THOUSAND)
TABLE 37 MARKET SIZE IN BUILDING & CONSTRUCTION END-USE INDUSTRY IN APAC, BY COUNTRY, 2017–2025 (USD THOUSAND)
TABLE 38 MARKET SIZE IN BUILDING & CONSTRUCTION END-USE INDUSTRY IN ROW, BY REGION, 2017–2025 (USD THOUSAND)
TABLE 39 MARKET SIZE IN PULP & PAPER END-USE INDUSTRY, BY REGION, 2017–2025 (USD THOUSAND)
TABLE 40 MARKET SIZE IN PULP & PAPER END-USE INDUSTRY IN NORTH AMERICA, BY COUNTRY, 2017–2025 (USD THOUSAND)
TABLE 41 MARKET SIZE IN PULP & PAPER END-USE INDUSTRY IN EUROPE, BY COUNTRY, 2017–2025 (USD THOUSAND)
TABLE 42 MARKET SIZE IN PULP & PAPER END-USE INDUSTRY IN APAC, BY COUNTRY, 2017–2025 (USD THOUSAND)
TABLE 43 MARKET SIZE IN PULP & PAPER END-USE INDUSTRY IN ROW, BY REGION, 2017–2025 (USD THOUSAND)
TABLE 44 MARKET SIZE IN METALS & MINING END-USE INDUSTRY, BY REGION, 2017–2025 (USD THOUSAND)
TABLE 45 MARKET SIZE IN METALS & MINING END-USE INDUSTRY IN NORTH AMERICA, BY COUNTRY, 2017–2025 (USD THOUSAND)
TABLE 46 MARKET SIZE IN METALS & MINING END-USE INDUSTRY IN EUROPE, BY COUNTRY, 2017–2025 (USD THOUSAND)
TABLE 47 MARKET SIZE IN METALS & MINING END-USE INDUSTRY IN APAC, BY COUNTRY, 2017–2025 (USD THOUSAND)
TABLE 48 MARKET SIZE IN METALS & MINING END-USE INDUSTRY IN ROW, BY REGION, 2017–2025 (USD THOUSAND)
TABLE 49 MARKET SIZE IN OTHER END-USE INDUSTRIES, BY REGION, 2017–2025 (USD THOUSAND)
TABLE 50 VALVE CONTROLLER MARKET SIZE IN OTHER END-USE INDUSTRIES IN NORTH AMERICA, BY COUNTRY, 2017–2025 (USD THOUSAND)
TABLE 51 MARKET SIZE IN OTHER END-USE INDUSTRIES IN EUROPE, BY COUNTRY, 2017–2025 (USD THOUSAND)
TABLE 52 MARKET SIZE IN OTHER END-USE INDUSTRIES IN APAC, BY COUNTRY, 2017–2025 (USD THOUSAND)
TABLE 53 VALVE CONTROLLER MARKET SIZE IN OTHER END-USE INDUSTRIES IN ROW, BY REGION, 2017–2025 (USD THOUSAND)
TABLE 54 MARKET SIZE, BY REGION, 2017–2025 (USD MILLION)
TABLE 55 MARKET SIZE IN NORTH AMERICA, BY COUNTRY, 2017–2025 (USD MILLION)
TABLE 56 MARKET SIZE IN NORTH AMERICA, BY END-USE INDUSTRY, 2017–2025 (USD THOUSAND)
TABLE 57 MARKET SIZE IN US, BY END-USE INDUSTRY, 2017–2025 (USD THOUSAND)
TABLE 58 MARKET SIZE IN CANADA, BY END-USE INDUSTRY, 2017–2025 (USD THOUSAND)
TABLE 59 MARKET SIZE IN MEXICO, BY END-USE INDUSTRY, 2017–2025 (USD THOUSAND)
TABLE 60 MARKET SIZE IN EUROPE, BY COUNTRY, 2017–2025 (USD MILLION)
TABLE 61 MARKET SIZE IN EUROPE, BY END-USE INDUSTRY, 2017–2025 (USD THOUSAND)
TABLE 62 MARKET SIZE IN UK, BY END-USE INDUSTRY, 2017–2025 (USD THOUSAND)
TABLE 63 MARKET SIZE IN GERMANY, BY END-USE INDUSTRY, 2017–2025 (USD THOUSAND)
TABLE 64 MARKET SIZE IN FRANCE, BY END-USE INDUSTRY, 2017–2025 (USD THOUSAND)
TABLE 65 MARKET SIZE IN ITALY, BY END-USE INDUSTRY, 2017–2025 (USD THOUSAND)
TABLE 66 MARKET SIZE IN REST OF EUROPE, BY END-USE INDUSTRY, 2017–2025 (USD THOUSAND)
TABLE 67 MARKET SIZE IN APAC, BY COUNTRY, 2017–2025 (USD MILLION)
TABLE 68 MARKET SIZE IN APAC, BY END-USE INDUSTRY, 2017–2025 (USD THOUSAND)
TABLE 69 MARKET SIZE IN CHINA, BY END-USE INDUSTRY, 2017–2025 (USD THOUSAND)
TABLE 70 MARKET SIZE IN JAPAN, BY END-USE INDUSTRY, 2017–2025 (USD THOUSAND)
TABLE 71 MARKET SIZE IN INDIA, BY END-USE INDUSTRY, 2017–2025 (USD THOUSAND)
TABLE 72 MARKET SIZE IN REST OF APAC, BY END-USE INDUSTRY, 2017–2025 (USD THOUSAND)
TABLE 73 MARKET SIZE IN ROW, BY REGION, 2017–2025 (USD MILLION)
TABLE 74 MARKET SIZE IN ROW, BY END-USE INDUSTRY, 2017–2025 (USD THOUSAND)
TABLE 75 MARKET SIZE IN MIDDLE EAST & AFRICA, BY END-USE INDUSTRY, 2017–2025 (USD THOUSAND)
TABLE 76 MARKET SIZE IN SOUTH AMERICA, BY END-USE INDUSTRY, 2017–2025 (USD THOUSAND)
TABLE 77 KEY PARTNERSHIPS, MERGERS, ACQUISITIONS, AND AGREEMENTS (2017 – 2019)
TABLE 78 KEY PRODUCT DEVELOPMENTS/LAUNCHES (2017 – 2019)
LIST OF (50 Figures)
FIGURE 1 VALVE CONTROLLER MARKET SEGMENTATION
FIGURE 2 MARKET: RESEARCH DESIGN
FIGURE 3 SUPPLY SIDE ANALYSIS: MARKET
FIGURE 4 MARKET SIZE ESTIMATION METHODOLOGY: BOTTOM-UP APPROACH
FIGURE 5 MARKET SIZE ESTIMATION METHODOLOGY: TOP-DOWN APPROACH
FIGURE 6 MARKET: DATA TRIANGULATION
FIGURE 7 MARKET: OPTIMISTIC, REALISTIC, AND PESSIMISTIC SCENARIO ANALYSIS (2017–2025)
FIGURE 8 MARKET SIZE (2017–2025)
FIGURE 9 DIGITAL VALVE CONTROLLER SEGMENT TO HOLD LARGER MARKET SHARE IN 2020
FIGURE 10 HART TO CAPTURE LARGEST SHARE OF DIGITAL VALVE CONTROLLER MARKET, BY COMMUNICATION PROTOCOL IN 2020
FIGURE 11 ENERGY & POWER TO THE BE FASTEST-GROWING END-USE INDUSTRY
FIGURE 12 APAC TO HOLD LARGEST SHARE OF MARKET IN 2020
FIGURE 13 RISING IMPORTANCE OF MONITORING & CONTROLLING IN PROCESS INDUSTRIES IS DRIVING THE MARKET
FIGURE 14 DIGITAL VALVE CONTROLLER TO BE THE LARGER SEGMENT IN 2020
FIGURE 15 HART COMMUNICATION PROTOCOL TO BE THE LARGEST SEGMENT OF THE MARKET
FIGURE 16 CHINA AND ENERGY & POWER SEGMENT TO ACCOUNT FOR THE LARGEST SHARES
FIGURE 17 US TO BE THE LARGEST MARKET
FIGURE 18 MARKET DYNAMICS
FIGURE 19 MARKET DRIVERS AND THEIR IMPACT
FIGURE 20 GLOBAL TREND OF PRIMARY ENERGY CONSUMPTION (IN MTOE)
FIGURE 21 MARKET RESTRAINTS AND THEIR IMPACT
FIGURE 22 MARKET OPPORTUNITIES AND THEIR IMPACT
FIGURE 23 VALVE CONTROLLER MARKET CHALLENGES AND THEIR IMPACT
FIGURE 24 VALUE CHAIN ANALYSIS: MAJOR VALUE ADDED DURING RAW MATERIAL AND COMPONENT SUPPLIERS AND ORIGINAL EQUIPMENT MANUFACTURING PHASE
FIGURE 25 MARKET, BY TYPE
FIGURE 26 DIGITAL VALVE CONTROLLER TO DOMINATE THE MARKET DURING 2020–2025
FIGURE 27 DIGITAL VALVE CONTROLLER MARKET, BY COMMUNICATION PROTOCOL
FIGURE 28 HART COMMUNICATION PROTOCOL TO LEAD THE DIGITAL MARKET DURING 2020–2025
FIGURE 29 MARKET, BY END-USE INDUSTRY
FIGURE 30 MARKET: GEOGRAPHIC SNAPSHOT
FIGURE 31 APAC TO LEAD THE MARKET DURING THE FORECAST PERIOD
FIGURE 32 SNAPSHOT OF MARKET IN NORTH AMERICA
FIGURE 33 SNAPSHOT OF MARKET IN EUROPE
FIGURE 34 SNAPSHOT OF MARKET IN APAC
FIGURE 35 COMPANIES IN MARKET ADOPTED ACQUISITIONS, MERGERS, AND AGREEMENTS AS KEY GROWTH STRATEGIES FROM 2017 TO 2019
FIGURE 36 MARKET RANKING OF TOP 5 PLAYERS IN VALVE CONTROLLER MARKET, 2019
FIGURE 37 MARKET (GLOBAL) COMPETITIVE LEADERSHIP MAPPING, 2019
FIGURE 38 EMERSON: COMPANY SNAPSHOT
FIGURE 39 METSO: COMPANY SNAPSHOT
FIGURE 40 CIRCOR INTERNATIONAL INC.: COMPANY SNAPSHOT
FIGURE 41 ABB: COMPANY SNAPSHOT
FIGURE 42 SCHNEIDER ELECTRIC: COMPANY SNAPSHOT
FIGURE 43 FLOWSERVE CORPORATION: COMPANY SNAPSHOT
FIGURE 44 SMC CORPORATION: COMPANY SNAPSHOT
FIGURE 45 AZBIL: COMPANY SNAPSHOT
FIGURE 46 BAKER HUGHES: COMPANY SNAPSHOT
FIGURE 47 ROTORK: COMPANY SNAPSHOT
FIGURE 48 SIEMENS: COMPANY SNAPSHOT
FIGURE 49 IMI: COMPANY SNAPSHOT
FIGURE 50 TOKYO KEIKI: COMPANY SNAPSHOT
The study involved four major activities for estimating the current size of the valve controller market. Exhaustive secondary research was carried out to collect information on the market, peer markets, and the parent market. The next step was to validate these findings, assumptions, and sizing with the industry experts across the value chain through primary research. Both top-down and bottom-up approaches were employed to estimate the complete market size. Thereafter, market breakdown and data triangulation procedures were used to estimate the size of segments and sub-segments of the market.
Secondary Research
Secondary sources referred to for this research study included corporate filings (such as annual reports, investor presentations, and financial statements); trade, business, and professional associations; white papers, valve-related journals, Valve Manufacturers Association of America (VMA0; Valve Magazine; directories; and databases. The secondary data was collected and analyzed to arrive at the overall market size estimations, which were further validated through the primary research.
Primary Research
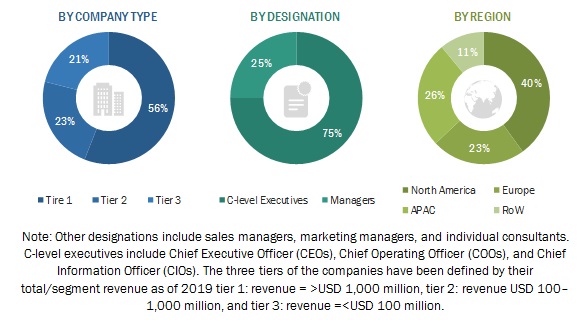
In the primary research process, various primary sources from both supply and demand sides were interviewed to obtain qualitative and quantitative information relevant to this report. Extensive primary research was conducted after understanding and analyzing the valve controller market through secondary research. Several primary interviews were conducted with the key opinion leaders from both demand and supply side across four regions: North America, Europe, Asia Pacific (APAC), and the Rest of the World (RoW). RoW comprises the Middle East and Africa and South America. Approximately 25% of the primary interviews were conducted with the demand side, while approximately 75% with the supply side. This primary data was collected mainly through telephonic interviews, which accounted for approximately 80% of the total primary interviews. Besides, questionnaires and emails were also used to collect the data.
To know about the assumptions considered for the study, download the pdf brochure
Market Size Estimation
Both top-down and bottom-up approaches were implemented to estimate and validate the total size of the valve controller market. These methods were also used extensively to estimate the size of the markets based on various segments. The research methodology used to estimate the market size included the following steps:
- The key players in the industry and markets were identified through extensive secondary research
- The industry’s supply chain and market size, in terms of value, were determined through primary and secondary research processes
- All percentage shares, splits, and breakdowns were determined using secondary sources and verified through primary sources
Data Triangulation
After arriving at the overall market size—using the market size estimation processes as explained above—the market was split into several segments and sub-segments. Data triangulation and market breakdown procedures were employed, wherever applicable, to complete the overall market engineering process and arrive at the exact statistics for each market segment and sub-segment. The data was triangulated by studying various factors and trends from demand and supply sides across different end users.
Study Objectives
- To describe and forecast the valve controller market, by type, by communication protocol (digital valve controller), end-use industry, and geography, in terms of value
- To describe and forecast the market for various segments with regard to four main regions—North America, Asia Pacific (APAC), Europe, and Rest of the World (RoW)
- To provide detailed information regarding drivers, restraints, opportunities, and challenges pertaining to the market
- To study a complete valve controller value chain and analyze the current and future market trends
- To strategically analyze the micromarkets1 with respect to individual growth trends, prospects, and contributions to the overall market
- To analyze opportunities in the market for stakeholders by identifying high-growth segments in the market
- To strategically profile key players, along with detailing the competitive landscape for market leaders
- To analyze strategic approaches in the market, such as product launches, acquisitions, mergers, collaborations, contracts, expansions, and partnerships
Available Customizations:
With the given market data, MarketsandMarkets offers customizations according to the specific requirements of companies. The following customization options are available for this report:
Company Information
- Detailed analysis and profiling of additional market players (up to five)


Growth opportunities and latent adjacency in Valve Controller Market