Vehicle Analytics Market by Application (Safety and Security Management, Traffic Management, Usage-Based Insurance), Component, and End-User (OEMs, Service Providers, Automotive Dealers, Fleet Owners, Regulatory Bodies, and Insurers) - Global Forecast to 2022


[132 Pages Report] The vehicle analytics market size is expected to grow from USD 930.0 Million in 2016 to USD 3,637.4 Million by 2022, at a Compound Annual Growth Rate (CAGR) of 26.5%. The base year considered for this report is 2016 and the forecast period is 2017�2022.
Objectives of the Study
The main objective of this report is to define, describe, and forecast the global vehicle analytics market on the basis of applications, components, deployment models, end-users, and regions. The report contains an analysis of the major factors influencing the growth of the market (drivers, restraints, opportunities, and challenges). It aims to strategically analyze the micromarkets with respect to individual growth trends, prospects, and their contribution to the market. The report attempts to forecast the market size for 5 major regions, namely, North America, Europe, Asia Pacific (APAC), Middle East and Africa (MEA), and Latin America. It contains key vendor profiles and comprehensively analyzes their core competencies. The report also tracks and analyzes competitive developments, including partnerships, collaborations, acquisitions, new product developments, and R&D activities in the vehicle analytics market.
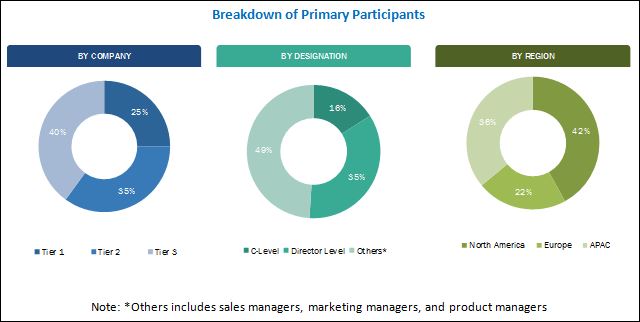
The research methodology used to estimate and forecast the vehicle analytics market starts with data collection through secondary research on key vendors. The sources referred for secondary research include journals and magazines, such as Vehicular Communications, Accident Analysis & Prevention, and M2M Magazine, and databases such as D&B Hoover�s, Bloomberg Businessweek, and Factiva. The vendor offerings were taken into consideration in order to determine the market segmentation. The bottom-up procedure was employed to arrive at the overall market size of the global vehicle analytics market from the revenue of the key players in the market. After arriving at the overall market size, the total market was split into several segments and subsegments, which were then verified through primary research by conducting extensive interviews with key personnel, such as Chief Marketing Officers (CMOs), and Chief Executive Officers (CEOs), Vice Presidents (VPs), directors, and executives. The data triangulation and market breakdown procedures were employed to complete the overall market engineering process and arrive at the exact statistics for all the segments and subsegments. The breakdown of primary profiles is depicted in the below figure:
To know about the assumptions considered for the study, download the pdf brochure
The vehicle analytics market comprises software and service providers, such as Acerta Analytics Solutions (Canada), Agnik LLC (US), Amodo (Croatia), Automotive Rentals (ARI) (US), Azuga (US), C-4 Analytics, LLC (US), CloudMade (UK), Digital Recognition Network (US), EngineCAL (India), Genetec Inc.(Canada), HARMAN International (US), IBM (US), Inquiron (Dubai), INRIX (US), Inseego Corp. (US), Intelligent Mechatronic Systems (Canada), Microsoft (US), Noregon (US), Pivotal Software, Inc. (US), Plotly (Canada), Procon Analytics (US), SAP (Germany), Teletrac Navman (US), WEX Inc. (US), and Xevo Inc.(US). These Vehicle Analytics Software Vendors are rated and listed by us on the basis of product quality, reliability, and their business strategy. Please visit 360Quadrants to see the vendor listing of Vehicle Analytics Software.
Key Target Audience
- Consulting companies
- Insurance companies
- Investors and venture capitalists
- Value-Added Resellers (VARs)
- Small, medium-sized, and large enterprises
- Third-party providers
- Consultants/consultancies/advisory firms
- Professional service providers
- Automakers
- Regularity bodies
�Study answers several questions for the stakeholders, primarily which market segments to focus in the next 2�5 years for prioritizing the efforts and investments.�
Scope of the Report
The research report categorizes the vehicle analytics market to forecast the revenues and analyze the trends in each of the following subsegments:
By Application:
- Predictive Maintenance
- Warranty Analytics
- Traffic Management
- Safety and Security Management
- Driver and User Behaviour Analysis
- Dealer Performance Analysis
- Infotainment
- Usage-Based Insurance
- Road Charging
By Component:
- Software
- Services
- Professional Services
- Deployment and Integration
- Support and Maintenance
- Consulting Service
- Managed Services
- Professional Services
By Deployment Model:
- On-Premises
- On-Demand
By End-User:
- Original Equipment Manufacturers (OEMs)
- Service Providers
- Automotive Dealers
- Fleet Owners
- Regulatory Bodies
- Insurers
By Region:
- North America
- Europe
- MEA
- APAC
- Latin America
Available Customizations
With the given market data, MarketsandMarkets offers customizations as per the company�s specific requirements. The following customization options are available for the report:
Product Analysis
Product matrix gives a detailed comparison of product portfolio for each company.
Geographic Analysis
- Further breakdown of the North American vehicle analytics market
- Further breakdown of the European market
- Further breakdown of the APAC market
- Further breakdown of the MEA market
- Further breakdown of the Latin American market
Company Information
Detailed profiling and analysis of additional market players
The global vehicle analytics market is expected to grow from USD 1,124.1 Million in 2017 to USD 3,637.4 Million by 2022, at a Compound Annual Growth Rate (CAGR) of 26.5%. The advancements in technologies, such as machine learning, Artificial Intelligence (AI), and predictive maintenance, to enhance fleet management and the increasing use of the real-time data collected from sensors and Global Positioning System (GPS) tracking devices are the key drivers for the market.
The report provides detailed insights into the global vehicle analytics market, which is segmented on the basis of applications, components, deployment models, end-users, and regions. Among the applications, the safety and security management application is expected to have the largest market share during the forecast period. The application can be leveraged intrinsically by vehicle manufacturers, as various regulations and government policies are getting framed to ensure proper safety and security applications are in place. For instance, the European Union (EU) region is making it mandatory to deploy eCall, an automatic emergency call system for motor vehicles from 31st March 2018. In case of any crash or fatal accident, the eCall application would automatically call the nearest emergency center. The sensors embedded in the car would provide the exact location of the car, which would dramatically reduce the emergency service response time. Moreover, as data privacy and security are the key concerns in the vehicle analytics market, the British government has issued specific guidelines that the board members of companies selling connected cars would be personally accountable if in case any data breach or hacking is reported. Therefore, there is a strong indication that the Original Equipment Manufacturers (OEMs) and fleet manufacturers would be focusing on partnering with companies that offer safety and security applications related to vehicle analytics.
The on-demand deployment model is expected to have a higher adoption rate as compared to the on-premises deployment model. The scalability and agility of cloud-based technologies are contributing to the increasing adoption of cloud-based vehicle analytics solutions. Moreover, the advent of cloud-based analytics and the rising demand for real-time analysis for predictive maintenance and driver performance analysis has significantly increased the adoption of on-demand deployment model vis-�-vis on premises adoption.
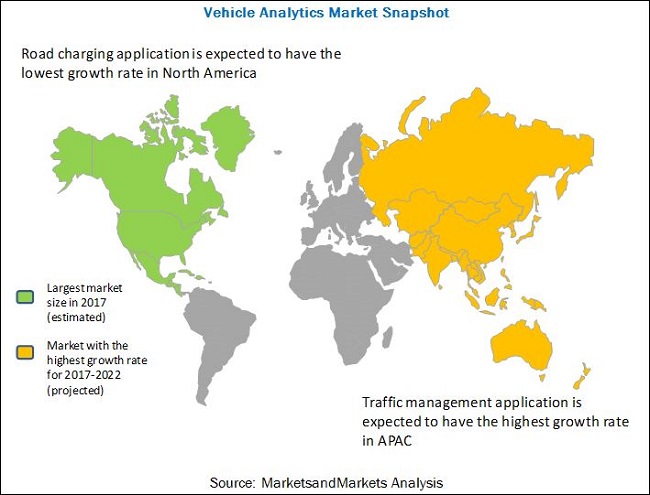
The report covers all the major aspects of the vehicle analytics market and provides an in-depth analysis across the regions of North America, Europe, Asia Pacific (APAC), Middle East and Africa (MEA), and Latin America. The market in North America is expected to have the largest market share. The APAC region is projected to provide significant opportunities in the market and is expected to grow at the highest CAGR during the forecast period.
Network coverage limitations and high initial setup costs are the major restraining factors for the growth of the vehicle analytics market. Data security issues and the challenges in integrating data with the existing software systems are the restraints in the adoption of vehicle analytics software and services.
Most of the vendors in the vehicle analytics market have adopted various growth strategies, such as acquisitions, agreements, collaborations and partnerships, new product launches, product upgradations, and expansions, to expand their client base and enhance the customer experience. For instance, in April 2017, IBM entered into a partnership with Panasonic and launched the Panasonic Cognitive Infotainment platform to offer OEMs and other fleet providers a complete infotainment solution which is powered by the IBM Watson and Cloud technologies.
To speak to our analyst for a discussion on the above findings, click Speak to Analyst
 Exclusive indicates content/data unique to MarketsandMarkets and not available with any competitors.
Table of Contents
1 Introduction (Page No. - 14)
1.1 Objectives of the Study
1.2 Market Definition
1.3 Market Scope
1.4 Years Considered for the Study
1.5 Currency
1.6 Stakeholders
2 Research Methodology (Page No. - 17)
2.1 Research Data
2.1.1 Secondary Data
2.1.2 Primary Data
2.1.2.1 Breakdown of Primaries
2.1.2.2 Key Industry Insights
2.2 Market Size Estimation
2.3 Microquadrant Research Methodology
2.3.1 Vendor Inclusion Criteria
2.4 Research Assumptions
2.5 Limitations
3 Executive Summary (Page No. - 24)
4 Premium Insights (Page No. - 28)
4.1 Attractive Market Opportunities in the Vehicle Analytics Market
4.2 Market By Region
4.3 Market By Application and Region
4.4 Life Cycle Analysis, By Region, 2017
5 Market Overview and Industry Trends (Page No. - 31)
5.1 Market Overview
5.1.1 Introduction
5.1.2 Market Dynamics
5.1.2.1 Drivers
5.1.2.1.1 Advancements in Technologies, Such as Machine Learning, AI, and Predictive Maintenance, to Enhance Fleet Management
5.1.2.1.2 Increasing Use of Real-Time Data Collected From Sensors and GPS Tracking Devices
5.1.2.2 Restraints
5.1.2.2.1 Network Coverage Limitations
5.1.2.2.2 High Costs Involved in Initial Setup
5.1.2.3 Opportunities
5.1.2.3.1 Automotive Players Leveraging Vehicle Analytics to Enhance Customer Experience
5.1.2.3.2 Unprecedented Advancements Toward Making Autonomous Vehicles A Reality
5.1.2.4 Challenges
5.1.2.4.1 Data Security Issues
5.1.2.4.2 Challenges in Integrating Data With Existing Software Systems
5.2 Industry Trends
5.2.1 Vehicle Analytics: Use Cases
5.2.1.1 Use Case #1: General Motors (GM)
5.2.1.2 Use Case #2: Maruti Suzuki
5.2.1.3 Use Case #3: Mercedes-Benz
5.2.1.4 Use Case #4: BMW
5.2.2 Vehicle Analytics: Rules and Regulations
5.2.2.1 National Highway and Transportation Safety Administration (NHTSA)
5.2.2.2 California DEPArtment of Motor Vehicles (DMV)
5.2.2.3 Chinese Government and Society of Automotive Engineers of China (SAEC)
6 Vehicle Analytics Market Analysis, By Application (Page No. - 38)
6.1 Introduction
6.2 Predictive Maintenance
6.3 Warranty Analytics
6.4 Traffic Management
6.5 Safety and Security Management
6.6 Driver and User Behavior Analysis
6.7 Dealer Performance Analysis
6.8 Infotainment
6.9 Usage-Based Insurance
6.10 Road Charging
7 Vehicle Analytics Market Analysis, By Component (Page No. - 50)
7.1 Introduction
7.1.1 Software
7.1.2 Services
7.1.2.1 Professional Services
7.1.2.1.1 Deployment and Integration
7.1.2.1.2 Support and Maintenance
7.1.2.1.3 Consulting Services
7.1.2.2 Managed Services
8 Vehicle Analytics Market Analysis, By Deployment Model (Page No. - 56)
8.1 Introduction
8.2 On-Premises
8.3 On-Demand
9 Vehicle Analytics Market Analysis, By End-User (Page No. - 60)
9.1 Introduction
9.2 Original Equipment Manufacturers (OEMs)
9.3 Service Providers
9.4 Automotive Dealers
9.5 Fleet Owners
9.6 Regulatory Bodies
9.7 Insurers
10 Geographic Analysis (Page No. - 67)
10.1 Introduction
10.2 North America
10.2.1 By Application
10.2.2 By Component
10.2.3 By Deployment Model
10.2.4 By End-User
10.2.5 By Country
10.2.5.1 United States
10.2.5.2 Canada
10.3 Europe
10.3.1 By Application
10.3.2 By Component
10.3.3 By Deployment Model
10.3.4 By End-User
10.3.5 By Country
10.3.5.1 United Kingdom
10.3.5.2 Germany
10.3.5.3 Rest of Europe
10.4 Asia Pacific
10.4.1 By Application
10.4.2 By Component
10.4.3 By Deployment Model
10.4.4 By End-User
10.4.5 By Country
10.4.5.1 China
10.4.5.2 Japan
10.4.5.3 Rest of Asia Pacific
10.5 Latin America
10.5.1 By Application
10.5.2 By Component
10.5.3 By Deployment Model
10.5.4 By End-User
10.5.5 By Country
10.5.5.1 Brazil
10.5.5.2 Mexico
10.5.5.3 Rest of Latin America
10.6 Middle East and Africa
10.6.1 By Application
10.6.2 By Component
10.6.3 By Deployment Model
10.6.4 By End-User
10.6.5 By Country
10.6.5.1 Middle East
10.6.5.2 Africa
11 Competitive Landscape (Page No. - 88)
11.1 Market Ranking for the Vehicle Analytics Market, 2017
12 Company Profiles (Page No. - 89)
(Overview, Strength of Product Portfolio, Business Strategy Excellence, Recent Developments)*
12.1 SAP
12.2 Genetec Inc.
12.3 Microsoft
12.4 IBM
12.5 Cloudmade
12.6 Intelligent Mechatronic Systems
12.7 Harman International
12.8 Teletrac Navman
12.9 Inseego Corp.
12.10 Agnik LLC
12.11 Inquiron
12.12 Automotive Rentals (ARI)
*Details on Overview, Strength of Product Portfolio, Business Strategy Excellence, Recent Developments Might Not Be Captured in Case of Unlisted Companies.
13 Appendix (Page No. - 125)
13.1 Discussion Guide
13.2 Knowledge Store: Marketsandmarkets� Subscription Portal
13.3 Available Customization
13.4 Related Reports
13.5 Author Details
List of Tables (64 Tables)
Table 1 United States Dollar Exchange Rate, 2014�2016
Table 2 Evaluation Criteria
Table 3 Vehicle Analytics Market Size, By Application, 2015�2022 (USD Million)
Table 4 Predictive Maintenance: Market Size, By Region, 2015�2022 (USD Million)
Table 5 Predictive Maintenance: Market Size, By Deployment Model, 2015�2022 (USD Million)
Table 6 Warranty Analytics: Market Size, By Region, 2015�2022 (USD Million)
Table 7 Warranty Analytics: Market Size, By Deployment Model, 2015�2022 (USD Million)
Table 8 Traffic Management: Market Size, By Region, 2015�2022 (USD Million)
Table 9 Traffic Management: Market Size, By Deployment Model, 2015�2022 (USD Million)
Table 10 Safety and Security Management: Market Size, By Region, 2015�2022 (USD Million)
Table 11 Safety and Security Management: Market Size, By Deployment Model, 2015�2022 (USD Million)
Table 12 Driver and User Behavior Analysis: Market Size, By Region, 2015�2022 (USD Million)
Table 13 Driver and User Behavior Analysis: Market Size, By Deployment Model, 2015�2022 (USD Million)
Table 14 Dealer Performance Analysis: Market Size, By Region, 2015�2022 (USD Million)
Table 15 Dealer Performance Analysis: Market Size, By Deployment Model, 2015�2022 (USD Million)
Table 16 Infotainment: Market Size, By Region, 2015�2022 (USD Million)
Table 17 Infotainment: Market Size, By Deployment Model, 2015�2022 (USD Million)
Table 18 Usage-Based Insurance: Market Size, By Region, 2015�2022 (USD Million)
Table 19 Usage-Based Insurance: Market Size, By Deployment Model, 2015�2022 (USD Million)
Table 20 Road Charging: Market Size, By Region, 2015�2022 (USD Million)
Table 21 Road Charging: Market Size, By Deployment Model, 2015�2022 (USD Million)
Table 22 Vehicle Analytics Market Size, By Component, 2015�2022 (USD Million)
Table 23 Software: Market Size, By Region, 2015�2022 (USD Million)
Table 24 Vehicle Analytics Market Size, By Service, 2015�2022 (USD Million)
Table 25 Services: Market Size, By Region, 2015�2022 (USD Million)
Table 26 Professional Services: Market Size, By Region, 2015�2022 (USD Million)
Table 27 Managed Services: Market Size, By Region, 2015�2022 (USD Million)
Table 28 Vehicle Analytics Market Size, By Deployment Model, 2015�2022 (USD Million)
Table 29 On-Premises: Market Size, By Region, 2015�2022 (USD Million)
Table 30 On-Demand: Market Size, By Region, 2015�2022 (USD Million)
Table 31 Vehicle Analytics Market Size, By End-User, 2015�2022 (USD Million)
Table 32 Original Equipment Manufacturers: Market Size, By Region, 2015�2022 (USD Million)
Table 33 Service Providers: Market Size, By Region, 2015�2022 (USD Million)
Table 34 Automotive Dealers: Market Size, By Region, 2015�2022 (USD Million)
Table 35 Fleet Owners: Market Size, By Region, 2015�2022 (USD Million)
Table 36 Regularity Bodies: Market Size, By Region, 2015�2022 (USD Million)
Table 37 Insurers: Market Size, By Region, 2015�2022 (USD Million)
Table 38 Vehicle Analytics Market Size, By Region, 2015�2022 (USD Million)
Table 39 North America: Market Size, By Application, 2015�2022 (USD Million)
Table 40 North America: Market Size, By Component, 2015�2022 (USD Million)
Table 41 North America: Market Size, By Service, 2015�2022 (USD Million)
Table 42 North America: Market Size, By Deployment Model, 2015�2022 (USD Million)
Table 43 North America: Market Size, By End-User, 2015�2022 (USD Million)
Table 44 Europe: Vehicle Analytics Market Size, By Application, 2015�2022 (USD Million)
Table 45 Europe: Market Size, By Component, 2015�2022 (USD Million)
Table 46 Europe: Market Size, By Service, 2015�2022 (USD Million)
Table 47 Europe: Market Size, By Deployment Model, 2015�2022 (USD Million)
Table 48 Europe: Market Size, By End-User, 2015�2022 (USD Million)
Table 49 Asia Pacific: Vehicle Analytics Market Size, By Application, 2015�2022 (USD Million)
Table 50 Asia Pacific: Market Size, By Component, 2015�2022 (USD Million)
Table 51 Asia Pacific: Market Size, By Service, 2015�2022 (USD Million)
Table 52 Asia Pacific: Market Size, By Deployment Model, 2015�2022 (USD Million)
Table 53 Asia Pacific: Market Size, By End-User, 2015�2022 (USD Million)
Table 54 Latin America: Vehicle Analytics Market Size, By Application, 2015�2022 (USD Million)
Table 55 Latin America: Market Size, By Component, 2015�2022 (USD Million)
Table 56 Latin America: Market Size, By Service, 2015�2022 (USD Million)
Table 57 Latin America: Market Size, By Deployment Model, 2015�2022 (USD Million)
Table 58 Latin America: Market Size, By End-User, 2015�2022 (USD Million)
Table 59 Middle East and Africa: Vehicle Analytics Market Size, By Application, 2015�2022 (USD Million)
Table 60 Middle East and Africa: Market Size, By Component, 2015�2022 (USD Million)
Table 61 Middle East and Africa: Market Size, By Service, 2015�2022 (USD Million)
Table 62 Mea: Vehicle Analytics Market Size, By Deployment Model, 2015�2022 (USD Million)
Table 63 Middle East and Africa: Market Size, By End-User, 2015�2022 (USD Million)
Table 64 Market Ranking for the Market, 2017
List of Figures (29 Figures)
Figure 1 Vehicle Analytics Market Segmentation
Figure 2 Vehicle Analytics Market: Research Design
Figure 3 Breakdown of Primary Interviews: By Company, Designation, and Region
Figure 4 Data Triangulation
Figure 5 Market Size Estimation Methodology: Bottom-Up Approach
Figure 6 Market Size Estimation Methodology: Top-Down Approach
Figure 7 Vehicle Analytics Market: Assumptions
Figure 8 Vehicle Analytics Market: Evolution
Figure 9 Vehicle Analytics Market is Expected to Witness Significant Growth During the Forecast Period
Figure 10 Market Snapshot By Component (2017 vs 2022)
Figure 11 Market Snapshot By Application (2017 vs 2022)
Figure 12 Market Snapshot By End-User
Figure 13 Market Snapshot By Deployment Model (2017-2022)
Figure 14 Automotive Players� Focus on Leveraging Vehicle Analytics to Enhance Customer Experience Would Provide Growth Opportunities for the Vehicle Analytics Market During the Forecast Period
Figure 15 North America is Estimated to Dominate the Global Vehicle Analytics Market in 2017
Figure 16 Safety and Security Management Application, and North America are Estimated to Have the Largest Market Shares in 2017
Figure 17 Asia Pacific is Expected to Enter the Exponential Growth Phase During the Forecast Period
Figure 18 Vehicle Analytics Market: Drivers, Restraints, Opportunities, and Challenges
Figure 19 Safety and Security Management Application is Expected to Hold the Largest Market Size During the Forecast Period
Figure 20 Software Segment is Expected to Have A Larger Market Size During the Forecast Period
Figure 21 On-Demand Deployment Model is Expected to Have A Larger Market Size During the Forecast Period
Figure 22 Automotive Dealers Segment is Expected to Hold the Largest Market Size During the Forecast Period
Figure 23 North America is Expected to Have the Largest Market Size in the Vehicle Analytics Market During the Forecast Period
Figure 24 North America: Market Snapshot
Figure 25 Asia Pacific: Market Snapshot
Figure 26 SAP: Company Snapshot
Figure 27 Microsoft: Company Snapshot
Figure 28 IBM: Company Snapshot
Figure 29 Inseego Corp.: Company Snapshot


Growth opportunities and latent adjacency in Vehicle Analytics Market
Understanding the road and transport ministry market
Understanding the vehicle analytics market by segmentation