Vein Illuminator Market by Technology (Transillumination, Infrared Technology and Ultrasound), by End-Users (Hospitals, Rehabilitation Centers, Blood Donation Camps and Academic Institutions) - Global forecast to 2022


The vein illuminator market was valued at USD 32.2 Million in 2015 and is expected to reach USD 227.2 Million by 2022 at a CAGR of 32.41% between 2016 and 2022. The base year for analysis in this report is considered as 2015 and the forecast period is between 2016 and 2022. The market is segmented on the basis of technology, application, end users, and geography. The demand in hospitals is expected to drive the market growth in all the regions, namely, North America, Europe, APAC, and RoW. The North American market is expected to hold the largest share and grow at the highest CAGR between 2016 and 2022. The near infrared illumination (NIR) technology is expected to drive the market owing to its ability to deeply penetrate the biological tissue up to 3 mm deep, which makes it possible to clearly visualize the twisted and curved vessels.
The vein illuminator industry is expected to grow at a CAGR of 32.41% between 2016 and 2022. The growth of the market is expected to be driven by the growing aging population, pediatric applications and growing demand for high patient satisfaction level.
Out of the major end-user industries, market for hospitals is expected to grow at a high CAGR between 2016 and 2022 owing to the demand for technologically advanced medical equipment that can contribute to the increased satisfaction level of patients along with reduced discomfort. Academic institutions are expected to grow at the second-highest CAGR during the forecast period. The increased research and practical application in these institutions drives the demand for vein illuminator devices in this market. However, the prevalence of traditional methods of vein detection as well as the high cost of these devices hinders the adoption of vein illuminators.
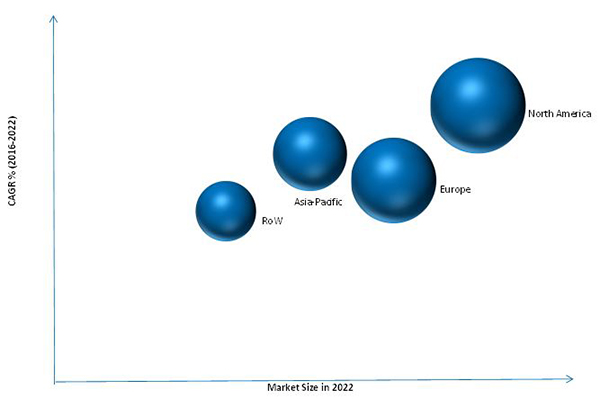
In terms of geography, North America is expected to witness high growth in this market between 2016 and 2022 owing to the demand for highly advanced medical devices in hospitals, the presence of major vein illuminator-manufacturing companies, and increased importance of patient’s satisfaction. Asia-Pacific is expected to follow North America in terms of CAGR. High growth of vein illuminators in the region is attributed to the higher adoption of the technology by countries such as Japan and Australia. The healthcare services in these countries are technologically advanced and on par with those in North America. However, the total number of hospitals in these countries is much lesser than that in the U.S. Therefore, the rate of adoption of vein illuminators is expected to be lower than that in North America.
Among the applications for vein illuminator market, IV access is expected to hold the largest share of the market. North America is expected to hold the largest share of the IV access market because of the growing aging population and pediatric applications for IV access and blood draw. The blood draw application is expected to hold the second largest market for vein illuminator.
Among the technologies for vein illuminator market, near infrared illumination (NIR) is expected to grow at the highest CAGR between 2016 and 2022. The demand for NIR is attributed to its capability of penetrating into the biological tissue up to 3mm deep. The reduced hemoglobin in the venous blood absorbs more of this infrared radiation than the surrounding tissue and projects the image of the underlying vein pattern with greater accuracy than the other technologies. Because of the accuracy of operation, ease of handling, and cost effectiveness, NIR is expected to be preferred over transillumination and other technologies, and is, therefore, expected to hold the largest market share and grow at the highest CAGR.
AccuVein Inc. (U.S.) is one of the global leaders in medical imaging solutions. The company’s vein viewing system is the world’s first handheld, non-contact vein illumination solution. The product is built on the company’s proprietary technology and the company holds several patent portfolios for imaging and medical diagnostic technologies. TransLite LLC (U.S.) is the other major company in the vein illuminator market that indulges in design, manufacturing, and sales of medical devices which help in reducing pain and trauma to patients during venous access and treatment of varicose veins. Other major players in the market include Sharn Anesthesia (U.S.) and Christie Medical Holding Corp (U.S.).
To speak to our analyst for a discussion on the above findings, click Speak to Analyst
 Exclusive indicates content/data unique to MarketsandMarkets and not available with any competitors.
Table of Contents
1 Introduction (Page No. - 13)
1.1 Objectives of Study
1.2 Market Definition
1.3 Study Scope
1.3.1 Markets Covered
1.3.2 Years Considered for the Study
1.4 Currency
1.5 Limitations
1.6 Stakeholders
2 Research Methodology (Page No. - 16)
2.1 Introduction
2.1.1 Secondary Data
2.1.1.1 Key Data From Secondary Sources
2.1.2 Primary Data
2.1.2.1 Key Data From Primary Sources
2.1.2.2 Key Industry Insights
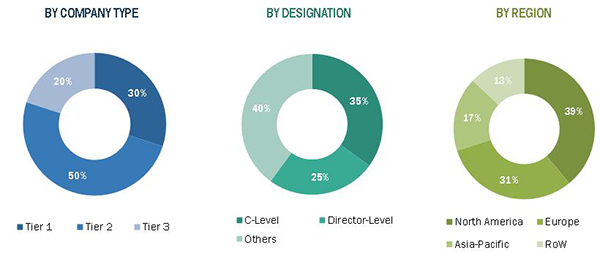
2.1.2.3 Breakdown of Primaries
2.2 Market Size Estimation
2.3 Market Breakdown and Data Triangulation
2.4 Assumptions
3 Executive Summary (Page No. - 25)
4 Premium Insights (Page No. - 31)
4.1 Growth Drivers for the Market
4.2 Vein Illuminator Market – Comparison of Four Geogrpahic Regions
4.3 North America: Market
4.4 Hospitals to Be the Largest End User in the Market Between 2016 and 2022
5 Market Overview (Page No. - 35)
5.1 Introduction
5.2 Market Segmentation
5.2.1 Vein Illuminator Market, By Technology
5.2.2 Market, By Application
5.2.3 Market, By End User
5.2.4 Market, By Geography
5.3 Market Dynamics
5.3.1 Drivers
5.3.1.1 Increased Success Rate of Blood Draw at First Attempt
5.3.1.2 Increased Patient Satisfaction
5.3.2 Restraints
5.3.2.1 Prevalence of Traditional Methods of Vein Detection Hinders the Adoption of Vein Illuminators
5.3.3 Opportunities
5.3.3.1 Increasing Biometric Banking Applications
5.3.4 Challenges
5.3.4.1 High Cost of Devices May Limit the Growth of Market
6 Industry Trends (Page No. - 44)
6.1 Introduction
6.2 Value Chain Analysis
6.3 Industry Trends
6.4 Porter’s Five Forces Model
6.4.1 Threat of New Entrants
6.4.2 Threat of Substitutes
6.4.3 Bargaining Power of Suppliers
6.4.4 Bargaining Power of Buyers
6.4.5 Intensity of Rivalry
7 Global Vein Illuminator Market, By Technology (Page No. - 53)
7.1 Introduction
7.2 Transillumination
7.3 Near Infrared Illumination
7.4 Ultrasound Technologies
8 Global Vein Illuminator Market, By Application (Page No. - 70)
8.1 Introduction
8.2 Intravenous Access
8.3 Blood Draw
8.4 Other Applications
9 Global Vein Illuminator Market, By End User (Page No. - 84)
9.1 Introduction
9.2 Hospitals
9.3 Rehabilitation Facilities
9.4 Blood Donation Camps
9.5 Academic Institutions
9.6 Other End Users
10 Global Vein Illuminator Market, By Geography (Page No. - 103)
10.1 Introduction
10.2 North America
10.3 Europe
10.4 Asia-Pacific
10.5 Rest of the World
11 Competitive Landscape (Page No. - 118)
11.1 Overview
11.2 Ranking Analysis, Vein Illuminator Market (2015)
11.3 Significant Developments in Market
12 Company Profiles (Page No. - 121)
(Company at A Glance, Recent Financials, Products & Services, Strategies & Insights, & Recent Developments)*
12.1 Introduction
12.2 Accuvein Inc.
12.3 Christie Medical Holdings, Inc.
12.4 Sharn Anesthesia
12.5 Infrared Imaging Systems, Inc.
12.6 Near Infrared Imaging Inc.
12.7 Translite LLC
12.8 Venoscope, LLC
12.9 Vuetek Scientific LLC.
12.10 ZD Medical Inc.
12.11 Cambridge Medical (Asia) Private Ltd.
*Details on Company at A Glance, Recent Financials, Products & Services, Strategies & Insights, & Recent Developments Might Not Be Captured in Case of Unlisted Companies.
13 Appendix (Page No. - 139)
13.1 Insights of Industry Experts
13.2 Discussion Guide
13.3 Knowledge Store: Marketsandmarkets’ Subscription Portal
13.4 Introducing RT: Real-Time Market Intelligence
13.5 Available Customizations
13.6 Related Report
List of Tables (70 Tables)
Table 1 Vein Illuminator Market Segmentation: By Technology
Table 2 Market Segmentation: By Application
Table 3 Market Segmentation: By End User
Table 4 Rising Medical Spending and Increasing Patient Satisfaction Contribute to the Growth of the Market
Table 5 Market, By Technology, 2014–2022 (USD Thousand)
Table 6 Market Size for Transillumination, By Application, 2014–2022 (USD Thousand)
Table 7 Market Size for Transillumination, By End User, 2014–2022 (USD Thousand)
Table 8 Market Size for Transillumination, By Region, 2014–2022 (USD Thousand)
Table 9 Market Size for Transillumination in North America, By Country, 2014–2022 (USD Thousand)
Table 10 Market Size for Transillumination in Europe, By Country, 2014–2022 (USD Thousand)
Table 11 Market Size for Transillumination in Asia-Pacific, By Country, 2014–2022 (USD Thousand)
Table 12 Market Size for Transillumination in Rest of the World, By Region, 2014–2022 (USD Thousand)
Table 13 Market Size for Near Infrared Illumination, By Application, 2014–2022 (USD Thousand)
Table 14 Market Size for Near Infrared Illumination, By End User, 2014–2022 (USD Thousand)
Table 15 Market Size for Near Infrared Illumination, By Region, 2014–2022 (USD Thousand)
Table 16 Market Size for Near Infrared Illumination in North America Market, By Country, 2014–2022 (USD Thousand)
Table 17 Vein Illuminator Market Size for Near Infrared Illumination in Europe, By Country, 2014–2022 (USD Thousand)
Table 18 Market Size for Near Infrared Illumination in Asia-Pacific Market, By Country, 2014–2022 (USD Thousand)
Table 19 Market Size for Near Infrared Illumination in Rest of the World, By Region, 2016–2022 (USD Thousand)
Table 20 Market Size for Ultrasound, By Application, 2014–2022 (USD Thousand)
Table 21 Market Size for Ultrasound, By End User, 2014–2022 (USD Thousand)
Table 22 Market Size for Ultrasound, By Region, 2014–2022 (USD Thousand)
Table 23 Market Size, By Application, 2014–2022 (USD Thousand)
Table 24 Market Size of Vein Illuminator Application, By End User, 2014–2022 (USD Thousand)
Table 25 Market Size, By Region, 2014–2022 (USD Thousand)
Table 26 Market Size of Intravenous Access Application of Vein Illuminator, By Technology, 2014–2022 (USD Thousand)
Table 27 Market Size of Intravenous Access Application of Vein Illuminator, By End User, 2014–2022 (USD Thousand)
Table 28 Market Size of Intravenous Access Application of Vein Illuminator, By Region, 2014–2022 (USD Thousand)
Table 29 Market Size of Blood Draw Application of Vein Illuminator, By End User 2014–2022 (USD Thousand)
Table 30 Market Size of Blood Draw Application of Vein Illuminator, By Technology, 2014–2022 (USD Thousand)
Table 31 Blood Draw Market Size, By Region, 2014–2022 (USD Thousand)
Table 32 Market Size of Other Applications of Vein Illuminators, By Technology, 2014–2022 (USD Thousand)
Table 33 Market Size of Other Applications of Vein Illuminators, By End User, 2014–2022 (USD Thousand)
Table 34 Makret Size of Other Applications of Vein Illuminators, By Region, 2014–2022 (USD Thousand)
Table 35 Vein Illuminator Market, By End User, 2014–2022 (USD Thousand)
Table 36 Market Size in Hospitals, By Technology, 2014–2022 (USD Thousand)
Table 37 Market Size in Hospitals, By Application, 2014–2022 (USD Thousand)
Table 38 Market Size for Hospitals, By Region, 2014–2022 (USD Thousand)
Table 39 Market Size for Rehabilitation Facilities, By Technology, 2014–2022 (USD Thousand)
Table 40 Vein Illuminator Market Size for Rehabilitation Facilities, By Application, 2014–2022 (USD Thousand)
Table 41 Market Size for Rehabilitation Facilities, By Region, 2014–2022 (USD Thousand)
Table 42 Vein Illuminator Market Size in Blood Donation Camps, By Technology, 2014–2022 (USD Thousand)
Table 43 Market Size for Blood Donation Camps, By Application, 2014–2022 (USD Thousand)
Table 44 Market Size for Blood Donation Camps, By Region, 2014–2022 (USD Thousand)
Table 45 Market Size for Academic Institutions, By Technology, 2014–2022 (USD Thousand)
Table 46 Vein Illuminator Market Size for Academic Institutions, By Application, 2014–2022 (USD Thousand)
Table 47 Market Size for Academic Institutions, By Region, 2014–2022 (USD Thousand)
Table 48 Market Size for Other End Users, By Technology, 2014–2022 (USD Thousand)
Table 49 Vein Illuminator Market Size for Other End Users, By Application, 2014–2022 (USD Thousand)
Table 50 Market Size for Other End Users, By Region, 2014–2022 (USD Thousand)
Table 51 Market, By Region, 2014–2022 (USD Thousand)
Table 52 Vein Illuminator Market Size in North America, By Technology, 2014–2022 (USD Thousand)
Table 53 Market Size in North America, By Application, 2014–2022 (USD Thousand)
Table 54 Market Size in North America, By End User, 2014–2022 (USD Thousand)
Table 55 Vein Illuminator Market Size in North America, By Country, 2014–2022 (USD Thousand)
Table 56 Market Size in Europe, By Technology, 2014–2022 (USD Thousand)
Table 57 Vein Illuminator Market Size in Europe, By Application, 2014–2022 (USD Thousand)
Table 58 Market Size in Europe, By End User, 2014–2022 (USD Thousand)
Table 59 Market Size in Europe, By Country, 2014–2022 (USD Thousand)
Table 60 Market Size in Asia-Pacific, By Technology, 2014–2022 (USD Thousand)
Table 61 Market Size in Asia-Pacific, By Application, 2014–2022 (USD Thousand)
Table 62 Market Size in Asia-Pacific, By End User, 2014–2022 (USD Thousand)
Table 63 Market Size for Asia-Pacific, By Country, 2014–2022 (USD Thousand)
Table 64 Market Size in Rest of the World, By Technology, 2014–2022 (USD Thousand)
Table 65 Market Size in Rest of the World, By Application, 2014–2022 (USD Thousand)
Table 66 Market Size in Rest of the World, By End User, 2014–2022 (USD Thousand)
Table 67 Market Size in Rest of the World, By Region, 2014–2022 (USD Thousand)
Table 68 Accuvein Inc. and Sharn Anesthesia to Lead the Market in 2015
Table 69 New Product Development
Table 70 Others
List of Figures (60 Figures)
Figure 1 Markets Segments
Figure 2 Vein Illuminator Market: Research Design
Figure 3 Market Size Estimation Methodology: Bottom-Up Approach
Figure 4 Market Size Estimation Methodology: Top-Down Approach
Figure 5 Data Triangulation
Figure 6 Near Infrared Illumination is Expected to Lead the Global Market During the Forecast Period, (USD Thousand)
Figure 7 IV Access Expected to Lead the Global Market During the Forecast Period, (USD Thousand)
Figure 8 Hospitals Expected to Lead the Global Market During the Forecast Period (USD Thousand)
Figure 9 North America Expected to Lead the Global Market During the Forecast Period
Figure 10 Attractive Market Growth Opportunities Between 2016 and 2022
Figure 11 North America to Grow at A High Rate Between 2016 and 2022
Figure 12 U.S. to Hold the Largest Share of the North American Vein Illuminator Market By 2022
Figure 13 North America to Hold the Largest Market Share for All End Users in 2016
Figure 14 Market Segmentation
Figure 15 Market Segmentation: By Geography
Figure 16 Increased Success Rate of Blood Draw in First Attempt and Patient Satisfaction are the Driving Forces for Vein Illuminator Device Market
Figure 17 Value Chain Analysis (2016): Major Value is Added During the Component Manufacturing and Assembly & Packaging Phase
Figure 18 Porter’s Five Forces Analysis
Figure 19 Porter’s Five Forces Analysis (2015): Impact Analysis for Vein Illuminator Market
Figure 20 Medium Threat of New Entrants
Figure 21 Medium Threat of Substitutes
Figure 22 Lower Bargaining Power of Suppliers
Figure 23 Higher Bargaining Power of Buyers
Figure 24 Higher Industry Rivalry
Figure 25 Vein Illuminator Market: By Technology
Figure 26 Near Field Illumination to Witness Highest Growth in the Vein Illuminator Market Between 2016 and 2022 ( USD Thousand)
Figure 27 IV Access to Witness Highest Growth in Transillumination Market Between 2016 and 2022 (USD Thousand)
Figure 28 North America to Witness Highest Growth in Transillumination for Market Between 2016 and 2022 (USD Thousand)
Figure 29 IV Access to Witness Highest Growth in Near Infrared Illumination Market Between 2016 and 2022 (USD Thousand)
Figure 30 North America to Witness Highest Growth in Near Infrared Illumination for Vein Illuminator Market Between 2016 and 2022 (USD Thousand)
Figure 31 IV Access to Witness Highest Growth in Ultraound Technology Market Between 2016 and 2022 (USD Thousand)
Figure 32 Europe to Witness Highest Growth in Ultrasound Technology for Market Between 2016 and 2022 (USD Thousand)
Figure 33 IV Access to Hold the Largest Market Share Between 2016 and 2022
Figure 34 Hospitals to Hold the Largest Market Share Between 2016 and 2022
Figure 35 North America to Hold the Largest Share of the Market Between 2016 and 2022
Figure 36 Near Infrared Illumination to Witness the Highest Growth in IV Access Market for Vein Illuminator Between 2016 and 2022 (USD Thousand)
Figure 37 Hospital to Grow at the Highest CAGR in Blood Draw Application Between 2016 and 2022 (USD Thousand)
Figure 38 Near Infrared Illumination to Witness Highest Growth in Other Applications of Vein Illuminator Between 2016 and 2022 (USD Thousand)
Figure 39 Vein Illuminator Market: By End User
Figure 40 Hospitals to Witness Highest Growth in Vein Illuminator Market Between 2016 and 2022 (USD Thousand)
Figure 41 Near Infrared Illumination to Witness Highest Growth in Hospitals in Vein Illuminator Market Between 2016 and 2022 (USD Thousand)
Figure 42 Near Infrared Illumination to Witness Highest Growth in Rehabilitation Facilities for Vein Illuminator Market Between 2016 and 2012 (USD Thousand)
Figure 43 Transillumination to Witness Highest Growth in Blood Donation Camps in Vein Illuminator Market Between 2016 and 2022 (USD Thousand)
Figure 44 Near Infrared Illumination to Witness Highest Growth in Academic Institutions in Vein Illuminator Market Between 2016 and 2022 (USD Thousand)
Figure 45 Near Infrared Illumination to Witness Highest Growth Among Other End Users in Vein Illuminator Market Between 2016 and 2022 (USD Thousand)
Figure 46 Benefits of Vein Illuminator
Figure 47 Geographic Snapshot: North America to Register the Highest Growth Rate During the Forecast Period
Figure 48 North America to Witness Highest Growth Between 2016 and 2022
Figure 49 North America: Vein Illuminator Market Snapshot
Figure 50 Hospitals to Witness Highest Growth in North American Vein Illuminator Market Between 2016 and 2022 (USD Thousand)
Figure 51 Academic Institutions to Witness Highest Growth in European Vein Illuminator Market Between 2016 and 2022 (USD Thousand)
Figure 52 Hospitals to Witness Highest Growth in Asia-Pacific Vein Illuminator Market Between 2016 and 2022 (USD Thousand)
Figure 53 Hospitals to Witness Highest Growth in Rest of the World Vein Illuminator Market Between 2016 and 2022 (USD Thousand)
Figure 54 SWOT Analysis : Accuven Inc.
Figure 55 SWOT Analysis : Christie Medical Holdings, Inc.
Figure 56 SWOT Analysis : Sharn Anesthesia Inc.
Figure 57 SWOT Analysis : Infrared Imaging Systems, Inc.
Figure 58 SWOT Analysis : Near Infrared Imaging, Inc.
Figure 59 Marketsandmarkets Knowledge Store Snapshot
Figure 60 Marketsandmarkets Knowledge Store: Semiconductor & Electronics Industry Snapshot
The research methodology used to estimate and forecast the vein illuminator market begins with gathering data related to the revenue of existing companies through secondary research. The vendor offerings have also been taken into consideration to determine the market segmentation. The bottom-up procedure has been employed to arrive at the overall size of the global vein illuminator market from the estimated revenue of existing key players. After arriving at the overall market size, the total market has been split into several segments and subsegments and then verified through primary research by conducting extensive interviews with people holding key positions such as CEOs, VPs, directors, and executives. The data triangulation and market breakdown procedures have been employed to complete the overall market engineering process and arrive at the exact statistics for all segments and subsegments. The breakdown of the profiles of primaries is depicted in the figure below
To know about the assumptions considered for the study, download the pdf brochure
The vein illuminator market ecosystem includes major vein illuminator manufacturing companies and start-up companies working on the technology, distributors, and end-user industries that implement these devices.
Key Target Audience
- Start-up companies
- Venture capitalists
- Investment houses
- Consulting firms
- End-user industry players
- Infrared and ultrasound technology providers
- Sensors, transmitter, receiver, camera, and projector suppliers and manufacturers
Scope of the Report:
The research report segments the vein illuminator market into the following submarkets:
By Technology:
- Near Infrared Illumination (NIR)
- Transillumination
- Ultrasound
By Application:
- IV Access
- Blood Draw
- Other Applications
By End-User Industry:
- Hospitals
- Rehabilitation Centers
- Blood Donation Camps
- Academic Institutions
- Others
By Geography:
- North America
- Europe
- Asia-Pacific
- RoW
Available customizations:
- Vein illuminator market: By technology; by application; by end-user industries
- Vein illuminator market: By technology, by application, by region
- Vein illuminator market: By technology; by end–user industries


Growth opportunities and latent adjacency in Vein Illuminator Market