Veterinary API Market by API Type (Antimicrobials (Fluoroquinolones, Tetracyclines), Vaccines, Hormones, Antimicrobials, Anti-inflammatory, Hormones), Synthesis Type, Route of Administration, and Animal Type - Global Forecast to 2028
The global veterinary API market, valued at US$8.0 billion in 2022, stood at US$8.5 billion in 2023 and is projected to advance at a resilient CAGR of 6.9% from 2023 to 2028, culminating in a forecasted valuation of US$11.9 billion by the end of the period. The new research study consists of an industry trend analysis of the market. The new research study consists of industry trends, pricing analysis, patent analysis, conference and webinar materials, key stakeholders, and buying behaviour in the market. The veterinary active pharmaceutical ingredient (API) market is growing due to various factors, including the increased occurrence of transboundary and zoonotic diseases, a rise in the global animal population and pet ownership, and the implementation of improved disease control and prevention measures. As a result, there is a growing demand for veterinary medicines and animal health products, which is expected to drive the development of the veterinary API industry. Moreover, this growth is likely to attract international investors to the region.
Global Veterinary API Market Trends
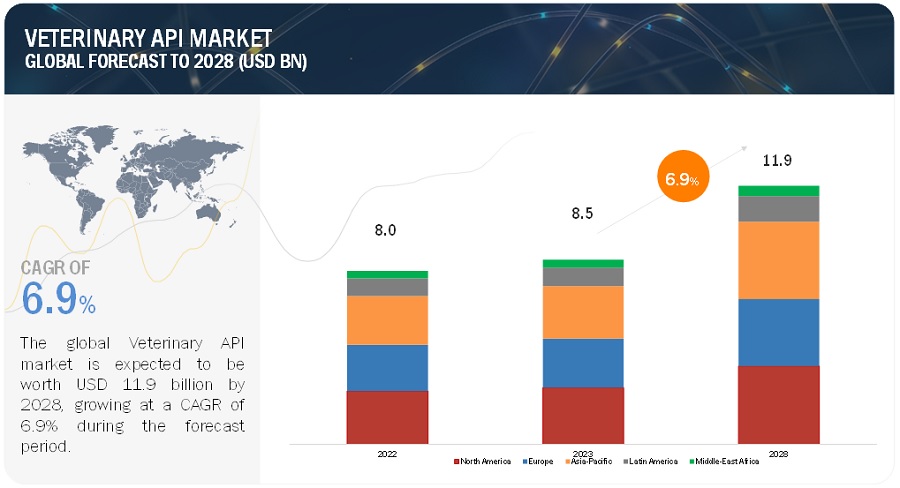
To know about the assumptions considered for the study, Request for Free Sample Report
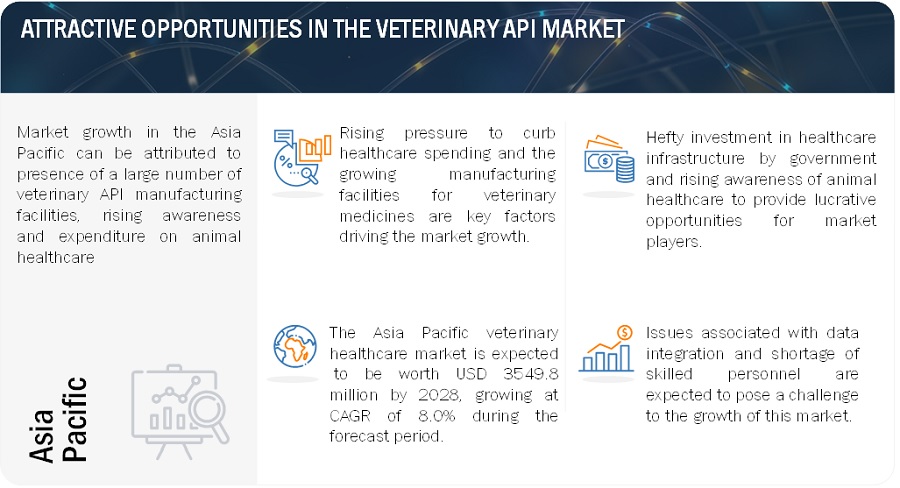
Veterinary API Market Dynamics
Driver: Rising incidence of transboundary & zoonotic diseases
Transboundary and zoonotic diseases have become a growing concern worldwide due to their potential to cause significant harm to both animals and humans. These diseases, such as avian influenza, rabies, and African swine fever, can rapidly spread across borders and pose a threat to public health, animal welfare, and global trade. As a result, there has been an increase in the utilization of veterinary active pharmaceutical ingredients (APIs) to combat and prevent the spread of these diseases. Veterinary APIs provide essential tools for treating infected animals and preventing the spread of diseases. They are used to develop effective therapeutics that target specific pathogens, reduce the severity of symptoms, and aid in the recovery of affected animals. By controlling disease outbreaks in animals, veterinary APIs contribute to reducing the risk of transmission to humans. The increased usage of veterinary APIs aligns with global efforts to address transboundary and zoonotic diseases. International organizations, governments, and veterinary professionals collaborate to develop and implement disease control programs. The availability of effective and quality veterinary APIs plays a significant role in supporting these programs, facilitating international cooperation, and minimizing the impact of these diseases on public health and global trade.
Restraint: High costs of veterinary diagnostic and treatment
The high cost of veterinary diagnostics and treatment is a significant challenge faced by pet owners, livestock farmers, and veterinary professionals. This brief explores the factors contributing to the high cost of veterinary diagnostics and treatment and discusses its implications on animal healthcare. Veterinary diagnostics and treatments often require specialized equipment, laboratory facilities, and advanced technology. These resources come at a high cost, both in terms of initial investment and maintenance. The need for sophisticated equipment and technology adds to the overall expenses of providing veterinary care, leading to higher prices for diagnostics and treatments. The demand for veterinary diagnostics and treatments is relatively smaller compared to the human healthcare market. The limited market size reduces economies of scale, resulting in higher costs per unit of production. The smaller market demand for veterinary products makes it challenging for manufacturers to achieve cost efficiencies, leading to higher prices for diagnostics and treatments.
Opportunity: Rising awareness about animal health and welfare
There has been a significant increase in public awareness about animal health and welfare. People are increasingly recognizing the importance of providing proper care and attention to animals, including pets, livestock, and wildlife. This brief explores the factors contributing to the rising awareness about animal health and welfare and discusses its implications for the veterinary industry and society. Various animal welfare organizations, both local and international, have played a crucial role in raising awareness about animal health and welfare. These organizations actively advocate for the rights and well-being of animals, promote responsible pet ownership, and highlight the importance of humane treatment of animals. Their efforts through campaigns, education programs, and public outreach initiatives have contributed to increased awareness among the general public. The rising awareness about animal health and welfare has led to increased demand for veterinary services. Pet owners and livestock farmers are seeking regular health check-ups, preventive care, and specialized treatments for their animals. This surge in demand presents opportunities for the veterinary industry to provide quality healthcare services and expand their offerings to meet the evolving needs of animal owners.
Challenge: Challenges in Large Molecule API Synthesis
Large molecule APIs, such as proteins and peptides, present unique challenges in their synthesis for veterinary applications. These challenges arise from the complex nature of large molecules and the specific requirements for their production. The synthesis of large molecule APIs can be cost-intensive and time-consuming. The complexity of the synthesis process, the need for specialized equipment and reagents, and the potential for low yields or purification challenges can contribute to higher costs. Furthermore, the time required for synthesis, purification, and quality control testing may be prolonged compared to small molecule APIs, impacting production timelines and overall costs. Large molecule APIs are often produced using expression systems, such as bacteria, yeast, or mammalian cells. However, achieving high expression levels and yields of biologically active large molecules can be challenging. Optimization of expression systems, including genetic engineering, optimization of culture conditions, and purification techniques, is necessary to obtain enough of the desired large molecule APIs.
Veterinary API Market Ecosystem
The ecosystem of the Veterinary API Industry is made up of the components that are present there and specifies these components with a list of the organizations involved. Manufacturers of different Veterinary APIs include the businesses engaged in research, product development, optimization, and introduction of such goods. Distributors include third party sites affiliated with the organization for selling these products.

Parasiticides segment of Veterinary API Industry is expected to witness the fastest growth in the forecast period.
The Veterinary API Market is divided into four types such as API Type, Synthesis Type, Route of Administration, and Animal Type. The market category in API Type for Parasiticides is anticipated to grow at the fastest rate between 2023 and 2028. The rising R&D investment on veterinary API manufacturing are additional factors that are expected to boost market expansion throughout the projected period.
Companion animal segment of the Veterinary API Industry is expected to witness the fastest growth in the forecast period.
The Veterinary API Market, based on Animal Type is divided into two types such as companion animals and livestock animals. In 2022, The fastest growing market for veterinary API is held by companion animals in Animal Type segment. Increasing pet ownership and rising awareness regarding animal health are all factors that contribute to the big proportion of this market.
North America accounted for the largest share of the Veterinary API Industry in 2022
The Veterinary API Market is divided into five regions based on geography: North America, Europe, Asia Pacific, Latin America, and the Middle East & Africa. In 2022, North America held the largest market share for Veterinary APIs worldwide. It is anticipated that a major driver impacting the North America market growth would be increasing R&D investments in veterinary API manufacturing and government support for API manufacturing facilities.
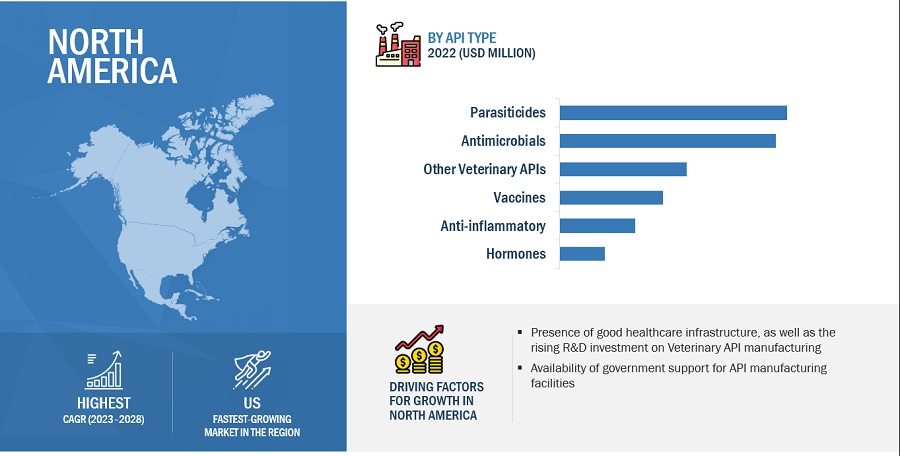
To know about the assumptions considered for the study, download the pdf brochure
Key players in the Veterinary API Market are Phibro Animal Health Corporation (US), Fabbrica Italiana Sintetici S.p.A. (Italy), Sequent Scientific Ltd. (India), Excel Industries Ltd. (India), NGL Fine-Chem Ltd. (India), Insulnsud Pharma (Spain), Menadiona Sl (Spain), Rochem International Inc. (US), and Shaanxi Hanjiang Pharmaceutical Group Co. Ltd. (China)
Scope of the Veterinary API Industry
|
Report Metric |
Details |
|
Market Revenue in 2023 |
$5.2 billion |
|
Projected Revenue by 2028 |
$7.1 billion |
|
Revenue Rate |
Poised to Grow at a CAGR of 6.5% |
|
Market Driver |
Rising incidence of transboundary & zoonotic diseases |
|
Market Opportunity |
Rising awareness about animal health and welfare |
The research report categorizes Veterinary API market to forecast revenue and analyze trends in each of the following submarkets:
By API Type
- Parasiticides
- Vaccines
- Antimicrobials
- Anti-inflammatory
- Hormones
- Other Veterinary APIs
By Synthesis Type
- Chemical based API
- Biological API
- Highly potent API
By Route of Administration
- Oral
- Injectable
- Topical
- Others
By Animal Type
- Companion animals
- Livestock animals
By Country
-
North America
- US
- Canada
-
Europe
- Germany
- UK
- France
- Spain
- Italy
- Rest of Europe
-
Asia Pacific
- China
- Australia
- Japan
- India
- Rest of APAC
-
Latin America
- Brazil
- Rest of LATAM
-
Middle East and Africa
- Turkey
- Rest of MEA
Recent Developments of Veterinary API Industry
- In 2021, Sequent Scientific Ltd. (India) received WHO–GENEVA approval for API Praziquantel (Anthelmintic) under the prequalification program.
- In 2020, Sequent Scientific Ltd. Opened a state-of-the-art animal health R&D center in Mumbai, India.
Frequently Asked Questions (FAQ):
What is the projected market revenue value of the global veterinary API market?
The global veterinary API market boasts a total revenue value of $11.9 billion by 2028.
What is the estimated growth rate (CAGR) of the global veterinary API market?
The global veterinary API market has an estimated compound annual growth rate (CAGR) of 6.9% and a revenue size in the region of $8.5 billion in 2023.
To speak to our analyst for a discussion on the above findings, click Speak to Analyst


- 5.1 INTRODUCTION
-
5.2 MARKET DYNAMICSDRIVERS- Rising incidence of transboundary and zoonotic diseases- Increasing animal population and pet ownership- Increasing disease control and prevention measures- Growing demand for animal proteinRESTRAINTS- Regulations restricting use of parasiticides on food-producing animals- Growing concerns about antibiotic resistanceOPPORTUNITIES- Untapped emerging economiesCHALLENGES- Challenges in large-molecule API synthesis- High costs of veterinary diagnostics and treatment
-
5.3 INDUSTRY TRENDSGROWING FRAGMENTATION IN VETERINARY API INDUSTRY
-
5.4 PRICING ANALYSISAVERAGE SELLING PRICE, BY TYPEAVERAGE SELLING PRICE TRENDS
- 5.5 SUPPLY CHAIN ANALYSIS
-
5.6 ECOSYSTEM ANALYSIS
-
5.7 PATENT ANALYSISTOP APPLICANTS (COMPANIES/INSTITUTES)
- 5.8 VALUE CHAIN ANALYSIS
-
5.9 CASE STUDIESIDENTIFYING BUSINESS OPPORTUNITIES IN BROAD-SPECTRUM PARASITICIDES, US
- 5.10 REGULATORY BODIES, GOVERNMENT AGENCIES, AND OTHER ORGANIZATIONS
-
5.11 PORTER’S FIVE FORCES ANALYSISINTENSITY OF COMPETITIVE RIVALRYBARGAINING POWER OF SUPPLIERSBARGAINING POWER OF BUYERSTHREAT OF NEW ENTRANTSTHREAT OF SUBSTITUTES
- 5.12 ADJACENT MARKET ANALYSIS
- 5.13 KEY CONFERENCES & EVENTS IN 2023–2024
-
5.14 KEY STAKEHOLDERS AND BUYING CRITERIAKEY STAKEHOLDERS IN BUYING PROCESSBUYING CRITERIA
- 5.15 TRADE ANALYSIS
- 5.16 IMPACT OF RECESSION ON VETERINARY API MARKET
- 6.1 INTRODUCTION
-
6.2 PARASITICIDESALBENDAZOLE & FENBENDAZOLE- Growing prevalence of infections in animals to boost adoptionIVERMECTIN- Effectiveness in treating parasitic infections to drive marketPRAZIQUANTEL- Growing resistance to other treatment options to drive demandLEVAMISOLE- Cost-effectiveness to drive usage in parasitic infection treatmentOTHER PARASITICIDES
-
6.3 VACCINESCANINE PARVOVIRUS & CANINE DISTEMPER VIRUS VACCINES- Availability of effective vaccines against highly contagious diseases to drive marketNEWCASTLE DISEASE VIRUS VACCINES- Need to ensure poultry health to boost vaccine usageINFECTIOUS BURSAL DISEASE VIRUS VACCINES- Veterinarian recommendations to drive vaccine demandFELINE LEUKEMIA VIRUS VACCINES- Rising feline population to drive marketOTHER VACCINES
-
6.4 ANTIMICROBIALSBETA-LACTAMS- Rising incidence of zoonotic diseases in livestock to drive demand for beta-lactamsTETRACYCLINES- Decreasing prices to support demand growthAMINOGLYCOSIDES- Growing food-producing animal population to boost demandFLUOROQUINOLONES- Compatibility with different routes of administration to ensure sustained market growthOTHER ANTIMICROBIALS
-
6.5 ANTI-INFLAMMATORIESMELOXICAM & PIROXICAM- Relatively low side-effect profiles to drive market growthCARPROFEN- Wide treatment applications to drive marketDERACOXIB & FIROCOXIB- Effectiveness in pain relief and inflammation to boost demandOTHER ANTI-INFLAMMATORIES
-
6.6 HORMONESPROGESTERONE & TESTOSTERONE- Progesterone & testosterone to hold largest share of hormones market over forecast periodESTRADIOL- Wide applications in regulating animal reproductive functions to drive marketLUTEINIZING HORMONE- Wide usage in assisted reproduction to ensure continued demandOTHER HORMONES
- 6.7 OTHER VETERINARY APIS
- 7.1 INTRODUCTION
-
7.2 CHEMICAL-BASED APICHEMICAL-BASED API TO HOLD LARGEST SHARE OVER FORECAST PERIOD
-
7.3 BIOLOGICAL APIGROWING INDUSTRY RECOGNITION TO DRIVE FOCUS ON BIOLOGICAL API PRODUCTION
-
7.4 HIGHLY POTENT APIRISING NEED FOR ADVANCED TREATMENT AND IMPROVED OUTCOMES TO DRIVE MARKET
- 8.1 INTRODUCTION
-
8.2 ORALCONVENIENCE AND EASE OF ADMINISTRATION TO SUSTAIN DEMAND
-
8.3 INJECTABLERAPID ONSET OF ACTION AND PRECISE DOSAGE AND DELIVERY TO BOOST DEMAND FOR INJECTABLES
-
8.4 TOPICALOPTIMIZED, TARGETED DELIVERY CAPABILITIES TO DRIVE GROWTH
- 8.5 OTHER ROUTES
- 9.1 INTRODUCTION
-
9.2 COMPANION ANIMALSCOMPANION ANIMALS SEGMENT TO DOMINATE MARKET, BY ANIMAL TYPE
-
9.3 LIVESTOCK ANIMALSFOCUS ON OPTIMIZING PRODUCTION AND PREVENTING OUTBREAKS TO DRIVE MARKET
- 10.1 INTRODUCTION
-
10.2 NORTH AMERICANORTH AMERICA: RECESSION IMPACTUS- Growing demand for veterinary APIs to drive marketCANADA- Increasing number of pets in Canada to boost the market
-
10.3 EUROPEEUROPE: RECESSION IMPACTGERMANY- Germany to hold largest market share in EuropeFRANCE- Strong animal welfare regulations to drive marketUK- Focus on preventive care to drive marketITALY- Increasing prevalence of animal diseases to drive marketSPAIN- Growing focus on animal health in Spain to support growthREST OF EUROPE
-
10.4 ASIA PACIFICASIA PACIFIC: RECESSION IMPACTCHINA- China to retain market leadership in APAC over forecast periodJAPAN- Growing pet ownership and companion animal care to drive marketINDIA- Expanding livestock industry and prevalence of veterinary diseases to support growthSOUTH KOREA- Increasing awareness of animal health to drive marketAUSTRALIA- Well-developed veterinary services in Australia to drive marketREST OF ASIA PACIFIC
-
10.5 LATIN AMERICARISING LIVESTOCK AND COMPANION ANIMAL POPULATION TO BOOST DEMANDLATIN AMERICA: RECESSION IMPACT
-
10.6 MIDDLE EAST & AFRICARISING INCIDENCE OF PARASITIC INFECTIONS TO DRIVE DEMAND FOR TREATMENTSMIDDLE EAST & AFRICA: RECESSION IMPACT

- 11.1 OVERVIEW
- 11.2 KEY PLAYER STRATEGIES
- 11.3 REVENUE SHARE ANALYSIS OF KEY PLAYERS
- 11.4 MARKET SHARE ANALYSIS
-
11.5 COMPANY EVALUATION MATRIX, 2022STARSPERVASIVE PLAYERSEMERGING LEADERSPARTICIPANTS
- 11.6 COMPETITIVE BENCHMARKING
-
11.7 COMPETITIVE SCENARIOPRODUCT LAUNCHES & APPROVALSDEALSOTHER DEVELOPMENTS
-
12.1 KEY PLAYERSBOEHRINGER INGELHEIM GMBH- Business overview- Products offered- Recent developments- MnM viewZOETIS, INC.- Business overview- Products offered- Recent developments- MnM viewELANCO ANIMAL HEALTH INCORPORATED- Business overview- Products offered- Recent developments- MnM viewMERCK & CO., INC.- Business overview- Products offered- Recent developments- MnM viewVIRBAC- Business overview- Products offered- MnM viewVETOQUINOL S.A.- Business overview- Products offeredSEQUENT SCIENTIFIC LIMITED- Business overview- Products offered- Recent developmentsPHIBRO ANIMAL HEALTH CORPORATION- Business overview- Products offered- Recent developmentsFABBRICA ITALIANA SINTETICI S.P.A.- Business overview- Products offeredEXCEL INDUSTRIES LTD.- Business overview- Products offeredNGL FINE-CHEM LTD.- Business overview- Products offeredQILU PHARMACEUTICAL- Business overview- Products offeredOLON S.P.A.- Business overview- Products offered- Recent developmentsSHANDONG LUKANG PHARMACEUTICAL CO., LTD.- Business overview- Products offeredZHEJIANG HUADI PHARMACEUTICAL GROUP CO., LTD.- Business overview- Products offeredINSUD PHARMA- Business overview- Products offeredMENADIONA SL- Business overview- Products offeredROCHEM INTERNATIONAL, INC.- Business overview- Products offeredAFTON PHARMA- Business overview- Products offeredSHAANXI HANJIANG PHARMACEUTICAL GROUP CO. LTD.- Business overview- Products offered
-
12.2 OTHER PLAYERSDALIAN LAUNCHER FINE CHEMICAL CO., LTD.AMGIS LIFESCIENCE LTD.D.H. ORGANICSSIFLON DRUGSSBD HEALTHCARE PVT. LTD.CENTURY PHARMACEUTICALS LTD.SIDHIV PHARMAFERMIONCHEMINO PHARMA PRIVATE LIMITEDSUANFARMA
- 13.1 DISCUSSION GUIDE
- 13.2 KNOWLEDGESTORE: MARKETSANDMARKETS’ SUBSCRIPTION PORTAL
- 13.3 RELATED REPORTS
- 13.4 AUTHOR DETAILS
- TABLE 1 RESEARCH ASSUMPTIONS
- TABLE 2 AVERAGE SELLING PRICE, BY TYPE (USD)
- TABLE 3 NORTH AMERICA: REGULATORY BODIES, GOVERNMENT AGENCIES, AND OTHER ORGANIZATIONS
- TABLE 4 EUROPE: REGULATORY BODIES, GOVERNMENT AGENCIES, AND OTHER ORGANIZATIONS
- TABLE 5 ASIA PACIFIC AND ROW: REGULATORY BODIES, GOVERNMENT AGENCIES, AND OTHER ORGANIZATIONS
- TABLE 6 PORTER’S FIVE FORCES ANALYSIS: VETERINARY API MARKET
- TABLE 7 VETERINARY API MARKET: DETAILED LIST OF CONFERENCES AND EVENTS
- TABLE 8 INFLUENCE OF STAKEHOLDERS ON BUYING PROCESS FOR TOP THREE API TYPES
- TABLE 9 KEY BUYING CRITERIA FOR TOP THREE API TYPES
- TABLE 10 TOP 10 IMPORTERS OF ANTIBIOTICS (HS CODE–2941)
- TABLE 11 TOP 10 EXPORTERS OF ANTIBIOTICS (HS CODE–2941)
- TABLE 12 TOP 10 IMPORTERS OF HORMONES, PROSTAGLANDINS, THROMBOXANES, AND LEUKOTRIENES (HS CODE–2937)
- TABLE 13 TOP 10 EXPORTERS OF HORMONES, PROSTAGLANDINS, THROMBOXANES, AND LEUKOTRIENES (HS CODE–2937)
- TABLE 14 VETERINARY API MARKET, BY TYPE, 2021–2028 (USD MILLION)
- TABLE 15 PARASITICIDES MARKET, BY TYPE, 2021–2028 (USD MILLION)
- TABLE 16 PARASITICIDES MARKET, BY COUNTRY, 2021–2028 (USD MILLION)
- TABLE 17 ALBENDAZOLE & FENBENDAZOLE MARKET, BY COUNTRY, 2021–2028 (USD MILLION)
- TABLE 18 IVERMECTIN MARKET, BY COUNTRY, 2021–2028 (USD MILLION)
- TABLE 19 PRAZIQUANTEL MARKET, BY COUNTRY, 2021–2028 (USD MILLION)
- TABLE 20 LEVAMISOLE MARKET, BY COUNTRY, 2021–2028 (USD MILLION)
- TABLE 21 OTHER PARASITICIDES MARKET, BY COUNTRY, 2021–2028 (USD MILLION)
- TABLE 22 VACCINES MARKET, BY TYPE, 2021–2028 (USD MILLION)
- TABLE 23 VACCINES MARKET, BY COUNTRY, 2021–2028 (USD MILLION)
- TABLE 24 CPV & CDV VACCINES MARKET, BY COUNTRY, 2021–2028 (USD MILLION)
- TABLE 25 NDV VACCINES MARKET, BY COUNTRY, 2021–2028 (USD MILLION)
- TABLE 26 IBDV VACCINES MARKET, BY COUNTRY, 2021–2028 (USD MILLION)
- TABLE 27 FELV VACCINES MARKET, BY COUNTRY, 2021–2028 (USD MILLION)
- TABLE 28 OTHER VACCINES MARKET, BY COUNTRY, 2021–2028 (USD MILLION)
- TABLE 29 ANTIMICROBIALS MARKET, BY TYPE, 2021–2028 (USD MILLION)
- TABLE 30 ANTIMICROBIALS MARKET, BY COUNTRY, 2021–2028 (USD MILLION)
- TABLE 31 BETA-LACTAMS MARKET, BY COUNTRY, 2021–2028 (USD MILLION)
- TABLE 32 TETRACYCLINES MARKET, BY COUNTRY, 2021–2028 (USD MILLION)
- TABLE 33 AMINOGLYCOSIDES MARKET, BY COUNTRY, 2021–2028 (USD MILLION)
- TABLE 34 FLUOROQUINOLONES MARKET, BY COUNTRY, 2021–2028 (USD MILLION)
- TABLE 35 OTHER ANTIMICROBIALS MARKET, BY COUNTRY, 2021–2028 (USD MILLION)
- TABLE 36 ANTI-INFLAMMATORIES MARKET, BY TYPE, 2021–2028 (USD MILLION)
- TABLE 37 ANTI-INFLAMMATORIES MARKET, BY COUNTRY, 2021–2028 (USD MILLION)
- TABLE 38 MELOXICAM & PIROXICAM MARKET, BY COUNTRY, 2021–2028 (USD MILLION)
- TABLE 39 CARPROFEN MARKET, BY COUNTRY, 2021–2028 (USD MILLION)
- TABLE 40 DERACOXIB & FIROCOXIB MARKET, BY COUNTRY, 2021–2028 (USD MILLION)
- TABLE 41 OTHER ANTI-INFLAMMATORIES MARKET, BY COUNTRY, 2021–2028 (USD MILLION)
- TABLE 42 HORMONES MARKET, BY TYPE, 2021–2028 (USD MILLION)
- TABLE 43 HORMONES MARKET, BY COUNTRY, 2021–2028 (USD MILLION)
- TABLE 44 PROGESTERONE & TESTOSTERONE MARKET, BY COUNTRY, 2021–2028 (USD MILLION)
- TABLE 45 ESTRADIOL MARKET, BY COUNTRY, 2021–2028 (USD MILLION)
- TABLE 46 LUTEINIZING HORMONE MARKET, BY COUNTRY, 2021–2028 (USD MILLION)
- TABLE 47 OTHER HORMONES MARKET, BY COUNTRY, 2021–2028 (USD MILLION)
- TABLE 48 OTHER VETERINARY APIS, BY COUNTRY, 2021–2028 (USD MILLION)
- TABLE 49 VETERINARY API MARKET, BY SYNTHESIS TYPE, 2021–2028 (USD MILLION)
- TABLE 50 CHEMICAL-BASED VETERINARY API MARKET, BY COUNTRY, 2021–2028 (USD MILLION)
- TABLE 51 BIOLOGICAL VETERINARY API MARKET, BY COUNTRY, 2021–2028 (USD MILLION)
- TABLE 52 HIGHLY POTENT VETERINARY API MARKET, BY COUNTRY 2021–2028 (USD MILLION)
- TABLE 53 VETERINARY API MARKET, BY ROUTE OF ADMINISTRATION, 2021–2028 (USD MILLION)
- TABLE 54 ORAL VETERINARY API MARKET, BY COUNTRY, 2021–2028 (USD MILLION)
- TABLE 55 INJECTABLE VETERINARY API MARKET, BY COUNTRY, 2021–2028 (USD MILLION)
- TABLE 56 TOPICAL VETERINARY API MARKET, BY COUNTRY, 2021–2028 (USD MILLION)
- TABLE 57 VETERINARY API MARKET FOR OTHER ROUTES, BY COUNTRY, 2021–2028 (USD MILLION)
- TABLE 58 VETERINARY API MARKET, BY ANIMAL TYPE, 2021–2028 (USD MILLION)
- TABLE 59 VETERINARY API MARKET FOR COMPANION ANIMALS, BY COUNTRY, 2021–2028 (USD MILLION)
- TABLE 60 VETERINARY API MARKET FOR LIVESTOCK ANIMALS, BY COUNTRY, 2021–2028 (USD MILLION)
- TABLE 61 VETERINARY API MARKET, BY REGION, 2021–2028 (USD MILLION)
- TABLE 62 VETERINARY API MARKET, BY COUNTRY, 2021–2028 (USD MILLION)
- TABLE 63 NORTH AMERICA: VETERINARY API MARKET, BY COUNTRY, 2021–2028 (USD MILLION)
- TABLE 64 NORTH AMERICA: VETERINARY API MARKET, BY TYPE, 2021–2028 (USD MILLION)
- TABLE 65 NORTH AMERICA: PARASITICIDES MARKET, BY TYPE, 2021–2028 (USD MILLION)
- TABLE 66 NORTH AMERICA: VACCINES MARKET, BY TYPE, 2021–2028 (USD MILLION)
- TABLE 67 NORTH AMERICA: ANTIMICROBIALS MARKET, BY TYPE, 2021–2028 (USD MILLION)
- TABLE 68 NORTH AMERICA: ANTI-INFLAMMATORIES MARKET, BY TYPE, 2021–2028 (USD MILLION)
- TABLE 69 NORTH AMERICA: HORMONES MARKET, BY TYPE, 2021–2028 (USD MILLION)
- TABLE 70 NORTH AMERICA: VETERINARY API MARKET, BY SYNTHESIS TYPE, 2021–2028 (USD MILLION)
- TABLE 71 NORTH AMERICA: VETERINARY API MARKET, BY ROUTE OF ADMINISTRATION, 2021–2028 (USD MILLION)
- TABLE 72 NORTH AMERICA: VETERINARY API MARKET, BY ANIMAL TYPE, 2021–2028 (USD MILLION)
- TABLE 73 US: VETERINARY API MARKET, BY TYPE, 2021–2028 (USD MILLION)
- TABLE 74 US: PARASITICIDES MARKET, BY TYPE, 2021–2028 (USD MILLION)
- TABLE 75 US: VACCINES MARKET, BY TYPE, 2021–2028 (USD MILLION)
- TABLE 76 US: ANTIMICROBIALS MARKET, BY TYPE, 2021–2028 (USD MILLION)
- TABLE 77 US: ANTI-INFLAMMATORIES MARKET, BY TYPE, 2021–2028 (USD MILLION)
- TABLE 78 US: HORMONES MARKET, BY TYPE, 2021–2028 (USD MILLION)
- TABLE 79 US: VETERINARY API MARKET, BY SYNTHESIS TYPE, 2021–2028 (USD MILLION)
- TABLE 80 US: VETERINARY API MARKET, BY ROUTE OF ADMINISTRATION, 2021–2028 (USD MILLION)
- TABLE 81 US: VETERINARY API MARKET, BY ANIMAL TYPE, 2021–2028 (USD MILLION)
- TABLE 82 CANADA: VETERINARY API MARKET, BY TYPE, 2021–2028 (USD MILLION)
- TABLE 83 CANADA: PARASITICIDES MARKET, BY TYPE, 2021–2028 (USD MILLION)
- TABLE 84 CANADA: VACCINES MARKET, BY TYPE, 2021–2028 (USD MILLION)
- TABLE 85 CANADA: ANTIMICROBIALS MARKET, BY TYPE, 2021–2028 (USD MILLION)
- TABLE 86 CANADA: ANTI-INFLAMMATORIES MARKET, BY TYPE, 2021–2028 (USD MILLION)
- TABLE 87 CANADA: HORMONES MARKET, BY TYPE, 2021–2028 (USD MILLION)
- TABLE 88 CANADA: VETERINARY API MARKET, BY SYNTHESIS TYPE, 2021–2028 (USD MILLION)
- TABLE 89 CANADA: VETERINARY API MARKET, BY ROUTE OF ADMINISTRATION, 2021–2028 (USD MILLION)
- TABLE 90 CANADA: VETERINARY API MARKET, BY ANIMAL TYPE, 2021–2028 (USD MILLION)
- TABLE 91 EUROPE: VETERINARY API MARKET, BY COUNTRY, 2021–2028 (USD MILLION)
- TABLE 92 EUROPE: VETERINARY API MARKET, BY TYPE, 2021–2028 (USD MILLION)
- TABLE 93 EUROPE: PARASITICIDES MARKET, BY TYPE, 2021–2028 (USD MILLION)
- TABLE 94 EUROPE: VACCINES MARKET, BY TYPE, 2021–2028 (USD MILLION)
- TABLE 95 EUROPE: ANTIMICROBIALS MARKET, BY TYPE, 2021–2028 (USD MILLION)
- TABLE 96 EUROPE: ANTI-INFLAMMATORIES MARKET, BY TYPE, 2021–2028 (USD MILLION)
- TABLE 97 EUROPE: HORMONES MARKET, BY TYPE, 2021–2028 (USD MILLION)
- TABLE 98 EUROPE: VETERINARY API MARKET, BY SYNTHESIS TYPE, 2021–2028 (USD MILLION)
- TABLE 99 EUROPE: VETERINARY API MARKET, BY ROUTE OF ADMINISTRATION, 2021–2028 (USD MILLION)
- TABLE 100 EUROPE: VETERINARY API MARKET, BY ANIMAL TYPE, 2021–2028 (USD MILLION)
- TABLE 101 GERMANY: VETERINARY API MARKET, BY TYPE, 2021–2028 (USD MILLION)
- TABLE 102 GERMANY: PARASITICIDES MARKET, BY TYPE, 2021–2028 (USD MILLION)
- TABLE 103 GERMANY: VACCINES MARKET, BY TYPE, 2021–2028 (USD MILLION)
- TABLE 104 GERMANY: ANTIMICROBIALS MARKET, BY TYPE, 2021–2028 (USD MILLION)
- TABLE 105 GERMANY: ANTI-INFLAMMATORIES MARKET, BY TYPE, 2021–2028 (USD MILLION)
- TABLE 106 GERMANY: HORMONES MARKET, BY TYPE, 2021–2028 (USD MILLION)
- TABLE 107 GERMANY: VETERINARY API MARKET, BY SYNTHESIS TYPE, 2021–2028 (USD MILLION)
- TABLE 108 GERMANY: VETERINARY API MARKET, BY ROUTE OF ADMINISTRATION, 2021–2028 (USD MILLION)
- TABLE 109 GERMANY: VETERINARY API MARKET, BY ANIMAL TYPE, 2021–2028 (USD MILLION)
- TABLE 110 FRANCE: VETERINARY API MARKET, BY TYPE, 2021–2028 (USD MILLION)
- TABLE 111 FRANCE: PARASITICIDES MARKET, BY TYPE, 2021–2028 (USD MILLION)
- TABLE 112 FRANCE: VACCINES MARKET, BY TYPE, 2021–2028 (USD MILLION)
- TABLE 113 FRANCE: ANTIMICROBIALS MARKET, BY TYPE, 2021–2028 (USD MILLION)
- TABLE 114 FRANCE: ANTI-INFLAMMATORIES MARKET, BY TYPE, 2021–2028 (USD MILLION)
- TABLE 115 FRANCE: HORMONES MARKET, BY TYPE, 2021–2028 (USD MILLION)
- TABLE 116 FRANCE: VETERINARY API MARKET, BY SYNTHESIS TYPE, 2021–2028 (USD MILLION)
- TABLE 117 FRANCE: VETERINARY API MARKET, BY ROUTE OF ADMINISTRATION, 2021–2028 (USD MILLION)
- TABLE 118 FRANCE: VETERINARY API MARKET, BY ANIMAL TYPE, 2021–2028 (USD MILLION)
- TABLE 119 UK: VETERINARY API MARKET, BY TYPE, 2021–2028 (USD MILLION)
- TABLE 120 UK: PARASITICIDES MARKET, BY TYPE, 2021–2028 (USD MILLION)
- TABLE 121 UK: VACCINES MARKET, BY TYPE, 2021–2028 (USD MILLION)
- TABLE 122 UK: ANTIMICROBIALS MARKET, BY TYPE, 2021–2028 (USD MILLION)
- TABLE 123 UK: ANTI-INFLAMMATORIES MARKET, BY TYPE, 2021–2028 (USD MILLION)
- TABLE 124 UK: HORMONES MARKET, BY TYPE, 2021–2028 (USD MILLION)
- TABLE 125 UK: VETERINARY API MARKET, BY SYNTHESIS TYPE, 2021–2028 (USD MILLION)
- TABLE 126 UK: VETERINARY API MARKET, BY ROUTE OF ADMINISTRATION, 2021–2028 (USD MILLION)
- TABLE 127 UK: VETERINARY API MARKET, BY ANIMAL TYPE, 2021–2028 (USD MILLION)
- TABLE 128 ITALY: VETERINARY API MARKET, BY TYPE, 2021–2028 (USD MILLION)
- TABLE 129 ITALY: PARASITICIDES MARKET, BY TYPE, 2021–2028 (USD MILLION)
- TABLE 130 ITALY: VACCINES MARKET, BY TYPE, 2021–2028 (USD MILLION)
- TABLE 131 ITALY: ANTIMICROBIALS MARKET, BY TYPE, 2021–2028 (USD MILLION)
- TABLE 132 ITALY: ANTI-INFLAMMATORIES MARKET, BY TYPE, 2021–2028 (USD MILLION)
- TABLE 133 ITALY: HORMONES MARKET, BY TYPE, 2021–2028 (USD MILLION)
- TABLE 134 ITALY: VETERINARY API MARKET, BY SYNTHESIS TYPE, 2021–2028 (USD MILLION)
- TABLE 135 ITALY: VETERINARY API MARKET, BY ROUTE OF ADMINISTRATION, 2021–2028 (USD MILLION)
- TABLE 136 ITALY: VETERINARY API MARKET, BY ANIMAL TYPE, 2021–2028 (USD MILLION)
- TABLE 137 SPAIN: VETERINARY API MARKET, BY TYPE, 2021–2028 (USD MILLION)
- TABLE 138 SPAIN: PARASITICIDES MARKET, BY TYPE, 2021–2028 (USD MILLION)
- TABLE 139 SPAIN: VACCINES MARKET, BY TYPE, 2021–2028 (USD MILLION)
- TABLE 140 SPAIN: ANTIMICROBIALS MARKET, BY TYPE, 2021–2028 (USD MILLION)
- TABLE 141 SPAIN: ANTI-INFLAMMATORIES MARKET, BY TYPE, 2021–2028 (USD MILLION)
- TABLE 142 SPAIN: HORMONES MARKET, BY TYPE, 2021–2028 (USD MILLION)
- TABLE 143 SPAIN: VETERINARY API MARKET, BY SYNTHESIS TYPE, 2021–2028 (USD MILLION)
- TABLE 144 SPAIN: VETERINARY API MARKET, BY ROUTE OF ADMINISTRATION, 2021–2028 (USD MILLION)
- TABLE 145 SPAIN: VETERINARY API MARKET, BY ANIMAL TYPE, 2021–2028 (USD MILLION)
- TABLE 146 REST OF EUROPE: VETERINARY API MARKET, BY TYPE, 2021–2028 (USD MILLION)
- TABLE 147 REST OF EUROPE: PARASITICIDES MARKET, BY TYPE, 2021–2028 (USD MILLION)
- TABLE 148 REST OF EUROPE: VACCINES MARKET, BY TYPE, 2021–2028 (USD MILLION)
- TABLE 149 REST OF EUROPE: ANTIMICROBIALS MARKET, BY TYPE, 2021–2028 (USD MILLION)
- TABLE 150 REST OF EUROPE: ANTI-INFLAMMATORIES MARKET, BY TYPE, 2021–2028 (USD MILLION)
- TABLE 151 REST OF EUROPE: HORMONES MARKET, BY TYPE, 2021–2028 (USD MILLION)
- TABLE 152 REST OF EUROPE: VETERINARY API MARKET, BY SYNTHESIS TYPE, 2021–2028 (USD MILLION)
- TABLE 153 REST OF EUROPE: VETERINARY API MARKET, BY ROUTE OF ADMINISTRATION, 2021–2028 (USD MILLION)
- TABLE 154 REST OF EUROPE: VETERINARY API MARKET, BY ANIMAL TYPE, 2021–2028 (USD MILLION)
- TABLE 155 ASIA PACIFIC: VETERINARY API MARKET, BY COUNTRY, 2021–2028 (USD MILLION)
- TABLE 156 ASIA PACIFIC: VETERINARY API MARKET, BY TYPE, 2021–2028 (USD MILLION)
- TABLE 157 ASIA PACIFIC: PARASITICIDES MARKET, BY TYPE, 2021–2028 (USD MILLION)
- TABLE 158 ASIA PACIFIC: VACCINES MARKET, BY TYPE, 2021–2028 (USD MILLION)
- TABLE 159 ASIA PACIFIC: ANTIMICROBIALS MARKET, BY TYPE, 2021–2028 (USD MILLION)
- TABLE 160 ASIA PACIFIC: ANTI-INFLAMMATORIES MARKET, BY TYPE, 2021–2028 (USD MILLION)
- TABLE 161 ASIA PACIFIC: HORMONES MARKET, BY TYPE, 2021–2028 (USD MILLION)
- TABLE 162 ASIA PACIFIC: VETERINARY API MARKET, BY SYNTHESIS TYPE, 2021–2028 (USD MILLION)
- TABLE 163 ASIA PACIFIC: VETERINARY API MARKET, BY ROUTE OF ADMINISTRATION, 2021–2028 (USD MILLION)
- TABLE 164 ASIA PACIFIC: VETERINARY API MARKET, BY ANIMAL TYPE, 2021–2028 (USD MILLION)
- TABLE 165 CHINA: VETERINARY API MARKET, BY TYPE, 2021–2028 (USD MILLION)
- TABLE 166 CHINA: PARASITICIDES MARKET, BY TYPE, 2021–2028 (USD MILLION)
- TABLE 167 CHINA: VACCINES MARKET, BY TYPE, 2021–2028 (USD MILLION)
- TABLE 168 CHINA: ANTIMICROBIALS MARKET, BY TYPE, 2021–2028 (USD MILLION)
- TABLE 169 CHINA: ANTI-INFLAMMATORIES MARKET, BY TYPE, 2021–2028 (USD MILLION)
- TABLE 170 CHINA: HORMONES MARKET, BY TYPE, 2021–2028 (USD MILLION)
- TABLE 171 CHINA: VETERINARY API MARKET, BY SYNTHESIS TYPE, 2021–2028 (USD MILLION)
- TABLE 172 CHINA: VETERINARY API MARKET, BY ROUTE OF ADMINISTRATION, 2021–2028 (USD MILLION)
- TABLE 173 CHINA: VETERINARY API MARKET, BY ANIMAL TYPE, 2021–2028 (USD MILLION)
- TABLE 174 JAPAN: VETERINARY API MARKET, BY TYPE, 2021–2028 (USD MILLION)
- TABLE 175 JAPAN: PARASITICIDES MARKET, BY TYPE, 2021–2028 (USD MILLION)
- TABLE 176 JAPAN: VACCINES MARKET, BY TYPE, 2021–2028 (USD MILLION)
- TABLE 177 JAPAN: ANTIMICROBIALS MARKET, BY TYPE, 2021–2028 (USD MILLION)
- TABLE 178 JAPAN: ANTI-INFLAMMATORIES MARKET, BY TYPE, 2021–2028 (USD MILLION)
- TABLE 179 JAPAN: HORMONES MARKET, BY TYPE, 2021–2028 (USD MILLION)
- TABLE 180 JAPAN: VETERINARY API MARKET, BY SYNTHESIS TYPE, 2021–2028 (USD MILLION)
- TABLE 181 JAPAN: VETERINARY API MARKET, BY ROUTE OF ADMINISTRATION, 2021–2028 (USD MILLION)
- TABLE 182 JAPAN: VETERINARY API MARKET, BY ANIMAL TYPE, 2021–2028 (USD MILLION)
- TABLE 183 INDIA: VETERINARY API MARKET, BY TYPE, 2021–2028 (USD MILLION)
- TABLE 184 INDIA: PARASITICIDES MARKET, BY TYPE, 2021–2028 (USD MILLION)
- TABLE 185 INDIA: VACCINES MARKET, BY TYPE, 2021–2028 (USD MILLION)
- TABLE 186 INDIA: ANTIMICROBIALS MARKET, BY TYPE, 2021–2028 (USD MILLION)
- TABLE 187 INDIA: ANTI-INFLAMMATORIES MARKET, BY TYPE, 2021–2028 (USD MILLION)
- TABLE 188 INDIA: HORMONES MARKET, BY TYPE, 2021–2028 (USD MILLION)
- TABLE 189 INDIA: VETERINARY API MARKET, BY SYNTHESIS TYPE, 2021–2028 (USD MILLION)
- TABLE 190 INDIA: VETERINARY API MARKET, BY ROUTE OF ADMINISTRATION, 2021–2028 (USD MILLION)
- TABLE 191 INDIA: VETERINARY API MARKET, BY ANIMAL TYPE, 2021–2028 (USD MILLION)
- TABLE 192 SOUTH KOREA: VETERINARY API MARKET, BY TYPE, 2021–2028 (USD MILLION)
- TABLE 193 SOUTH KOREA: PARASITICIDES MARKET, BY TYPE, 2021–2028 (USD MILLION)
- TABLE 194 SOUTH KOREA: VACCINES MARKET, BY TYPE, 2021–2028 (USD MILLION)
- TABLE 195 SOUTH KOREA: ANTIMICROBIALS MARKET, BY TYPE, 2021–2028 (USD MILLION)
- TABLE 196 SOUTH KOREA: ANTI-INFLAMMATORIES MARKET, BY TYPE, 2021–2028 (USD MILLION)
- TABLE 197 SOUTH KOREA: HORMONES MARKET, BY TYPE, 2021–2028 (USD MILLION)
- TABLE 198 SOUTH KOREA: VETERINARY API MARKET, BY SYNTHESIS TYPE, 2021–2028 (USD MILLION)
- TABLE 199 SOUTH KOREA: VETERINARY API MARKET, BY ROUTE OF ADMINISTRATION, 2021–2028 (USD MILLION)
- TABLE 200 SOUTH KOREA: VETERINARY API MARKET, BY ANIMAL TYPE, 2021–2028 (USD MILLION)
- TABLE 201 AUSTRALIA: VETERINARY API MARKET, BY TYPE, 2021–2028 (USD MILLION)
- TABLE 202 AUSTRALIA: PARASITICIDES MARKET, BY TYPE, 2021–2028 (USD MILLION)
- TABLE 203 AUSTRALIA: VACCINES MARKET, BY TYPE, 2021–2028 (USD MILLION)
- TABLE 204 AUSTRALIA: ANTIMICROBIALS MARKET, BY TYPE, 2021–2028 (USD MILLION)
- TABLE 205 AUSTRALIA: ANTI-INFLAMMATORIES MARKET, BY TYPE, 2021–2028 (USD MILLION)
- TABLE 206 AUSTRALIA: HORMONES MARKET, BY TYPE, 2021–2028 (USD MILLION)
- TABLE 207 AUSTRALIA: VETERINARY API MARKET, BY SYNTHESIS TYPE, 2021–2028 (USD MILLION)
- TABLE 208 AUSTRALIA: VETERINARY API MARKET, BY ROUTE OF ADMINISTRATION, 2021–2028 (USD MILLION)
- TABLE 209 AUSTRALIA: VETERINARY API MARKET, BY ANIMAL TYPE, 2021–2028 (USD MILLION)
- TABLE 210 REST OF ASIA PACIFIC: VETERINARY API MARKET, BY TYPE, 2021–2028 (USD MILLION)
- TABLE 211 REST OF ASIA PACIFIC: PARASITICIDES MARKET, BY TYPE, 2021–2028 (USD MILLION)
- TABLE 212 REST OF ASIA PACIFIC: VACCINES MARKET, BY TYPE, 2021–2028 (USD MILLION)
- TABLE 213 REST OF ASIA PACIFIC: ANTIMICROBIALS MARKET, BY TYPE, 2021–2028 (USD MILLION)
- TABLE 214 REST OF ASIA PACIFIC: ANTI-INFLAMMATORIES MARKET, BY TYPE, 2021–2028 (USD MILLION)
- TABLE 215 REST OF ASIA PACIFIC: HORMONES MARKET, BY TYPE, 2021–2028 (USD MILLION)
- TABLE 216 REST OF ASIA PACIFIC: VETERINARY API MARKET, BY SYNTHESIS TYPE, 2021–2028 (USD MILLION)
- TABLE 217 REST OF ASIA PACIFIC: VETERINARY API MARKET, BY ROUTE OF ADMINISTRATION, 2021–2028 (USD MILLION)
- TABLE 218 REST OF ASIA PACIFIC: VETERINARY API MARKET, BY ANIMAL TYPE, 2021–2028 (USD MILLION)
- TABLE 219 LATIN AMERICA: VETERINARY API MARKET, BY TYPE, 2021–2028 (USD MILLION)
- TABLE 220 LATIN AMERICA: PARASITICIDES MARKET, BY TYPE, 2021–2028 (USD MILLION)
- TABLE 221 LATIN AMERICA: VACCINES MARKET, BY TYPE, 2021–2028 (USD MILLION)
- TABLE 222 LATIN AMERICA: ANTIMICROBIALS MARKET, BY TYPE, 2021–2028 (USD MILLION)
- TABLE 223 LATIN AMERICA: ANTI-INFLAMMATORIES MARKET, BY TYPE, 2021–2028 (USD MILLION)
- TABLE 224 LATIN AMERICA: HORMONES MARKET, BY TYPE, 2021–2028 (USD MILLION)
- TABLE 225 LATIN AMERICA: VETERINARY API MARKET, BY SYNTHESIS TYPE, 2021–2028 (USD MILLION)
- TABLE 226 LATIN AMERICA: VETERINARY API MARKET, BY ROUTE OF ADMINISTRATION, 2021–2028 (USD MILLION)
- TABLE 227 LATIN AMERICA: VETERINARY API MARKET, BY ANIMAL TYPE, 2021–2028 (USD MILLION)
- TABLE 228 MIDDLE EAST & AFRICA: VETERINARY API MARKET, BY TYPE, 2021–2028 (USD MILLION)
- TABLE 229 MIDDLE EAST & AFRICA: PARASITICIDES MARKET, BY TYPE, 2021–2028 (USD MILLION)
- TABLE 230 MIDDLE EAST & AFRICA: VACCINES MARKET, BY TYPE, 2021–2028 (USD MILLION)
- TABLE 231 MIDDLE EAST & AFRICA: ANTIMICROBIALS MARKET, BY TYPE, 2021–2028 (USD MILLION)
- TABLE 232 MIDDLE EAST & AFRICA: ANTI-INFLAMMATORIES MARKET, BY TYPE, 2021–2028 (USD MILLION)
- TABLE 233 MIDDLE EAST & AFRICA: HORMONES MARKET, BY TYPE, 2021–2028 (USD MILLION)
- TABLE 234 MIDDLE EAST & AFRICA: VETERINARY API MARKET, BY SYNTHESIS TYPE, 2021–2028 (USD MILLION)
- TABLE 235 MIDDLE EAST & AFRICA: VETERINARY API MARKET, BY ROUTE OF ADMINISTRATION, 2021–2028 (USD MILLION)
- TABLE 236 MIDDLE EAST & AFRICA: VETERINARY API MARKET, BY ANIMAL TYPE, 2021–2028 (USD MILLION)
- TABLE 237 VETERINARY API MARKET: DEGREE OF COMPETITION
- TABLE 238 OVERALL COMPANY FOOTPRINT
- TABLE 239 COMPANY FOOTPRINT ANALYSIS, BY TYPE
- TABLE 240 COMPANY FOOTPRINT ANALYSIS, BY SYNTHESIS TYPE
- TABLE 241 COMPANY FOOTPRINT ANALYSIS, BY ROUTE OF ADMINISTRATION
- TABLE 242 COMPANY FOOTPRINT ANALYSIS, BY ANIMAL TYPE
- TABLE 243 COMPANY FOOTPRINT ANALYSIS, BY REGION
- TABLE 244 PRODUCT LAUNCHES & APPROVALS, JANUARY 2019–MAY 2023
- TABLE 245 DEALS, JANUARY 2021–MAY 2023
- TABLE 246 OTHER DEVELOPMENTS, JANUARY 2019- MAY 2023
- TABLE 247 BOEHRINGER INGELHEIM GMBH: BUSINESS OVERVIEW
- TABLE 248 ZOETIS, INC.: BUSINESS OVERVIEW
- TABLE 249 ELANCO ANIMAL HEALTH INCORPORATED: BUSINESS OVERVIEW
- TABLE 250 MERCK & CO., INC.: BUSINESS OVERVIEW
- TABLE 251 VIRBAC: BUSINESS OVERVIEW
- TABLE 252 VETOQUINOL S.A.: BUSINESS OVERVIEW
- TABLE 253 SEQUENT SCIENTIFIC LIMITED: BUSINESS OVERVIEW
- TABLE 254 PHIBRO ANIMAL HEALTH CORPORATION: BUSINESS OVERVIEW
- TABLE 255 FABBRICA ITALIANA SINTETICI: BUSINESS OVERVIEW
- TABLE 256 EXCEL INDUSTRIES LTD.: BUSINESS OVERVIEW
- TABLE 257 NGL FINE-CHEM: BUSINESS OVERVIEW
- TABLE 258 QILU PHARMACEUTICAL: BUSINESS OVERVIEW
- TABLE 259 OLON S.P.A: BUSINESS OVERVIEW
- TABLE 260 SHANDONG LUKANG PHARMACEUTICAL CO., LTD.: BUSINESS OVERVIEW
- TABLE 261 ZHEJIANG HUADI PHARMACEUTICAL GROUP CO., LTD.: BUSINESS OVERVIEW
- TABLE 262 INSUD PHARMA: BUSINESS OVERVIEW
- TABLE 263 MENADIONA SL: BUSINESS OVERVIEW
- TABLE 264 ROCHEM INTERNATIONAL: BUSINESS OVERVIEW
- TABLE 265 LIMITED AFTON PHARMA: BUSINESS OVERVIEW
- TABLE 266 SHAANXI HANJIANG PHARMACEUTICAL GROUP CO. LTD.: BUSINESS OVERVIEW
- FIGURE 1 VETERINARY API MARKET SEGMENTATION
- FIGURE 2 VETERINARY API MARKET, BY REGION
- FIGURE 3 RESEARCH DESIGN
- FIGURE 4 PRIMARY SOURCES
- FIGURE 5 BREAKDOWN OF PRIMARY INTERVIEWS (SUPPLY SIDE): BY COMPANY TYPE, DESIGNATION, AND REGION
- FIGURE 6 BREAKDOWN OF PRIMARY INTERVIEWS (DEMAND SIDE): BY END USER, DESIGNATION, AND REGION
- FIGURE 7 MARKET SIZE ESTIMATION: REVENUE SHARE ANALYSIS
- FIGURE 8 REVENUE SHARE ANALYSIS FOR PHIBRO ANIMAL HEALTH CORPORATION (2022)
- FIGURE 9 VETERINARY API MARKET: SUPPLY-SIDE ANALYSIS (2022)
- FIGURE 10 VETERINARY API MARKET: DRIVERS, RESTRAINTS, OPPORTUNITIES, AND CHALLENGES AND THEIR IMPACT ON MARKET GROWTH AND CAGR (2023–2028)
- FIGURE 11 VETERINARY API MARKET: CAGR PROJECTIONS (2023–2028)
- FIGURE 12 DATA TRIANGULATION METHODOLOGY
- FIGURE 13 VETERINARY API MARKET, BY TYPE, 2023 VS. 2028 (USD MILLION)
- FIGURE 14 VETERINARY API MARKET, BY SYNTHESIS TYPE, 2023 VS. 2028 (USD MILLION)
- FIGURE 15 VETERINARY API MARKET, BY ROUTE OF ADMINISTRATION, 2023 VS. 2028 (USD MILLION)
- FIGURE 16 VETERINARY API MARKET, BY ANIMAL TYPE, 2023 VS. 2028 (USD MILLION)
- FIGURE 17 VETERINARY API MARKET: GEOGRAPHIC SNAPSHOT, 2022
- FIGURE 18 GROWING PREVALENCE OF ANIMAL DISEASES AND RISING DEMAND FOR ANIMAL-DERIVED FOOD PRODUCTS TO DRIVE MARKET
- FIGURE 19 PARASITICIDES ACCOUNTED FOR LARGEST SHARE OF APAC VETERINARY API MARKET IN 2022
- FIGURE 20 CHINA TO REGISTER HIGHEST GROWTH DURING FORECAST PERIOD
- FIGURE 21 NORTH AMERICA TO CONTINUE TO DOMINATE VETERINARY API MARKET IN 2022
- FIGURE 22 EMERGING ECONOMIES TO OFFER GROWTH OPPORTUNITIES TO MARKET PLAYERS DURING FORECAST PERIOD
- FIGURE 23 VETERINARY API MARKET: DRIVERS, RESTRAINTS, OPPORTUNITIES, AND CHALLENGES
- FIGURE 24 US: INCREASING PET EXPENDITURE, 2010–2021 (USD BILLION)
- FIGURE 25 SUPPLY CHAIN ANALYSIS: VETERINARY API MARKET
- FIGURE 26 ECOSYSTEM ANALYSIS: VETERINARY API MARKET
- FIGURE 27 PATENT PUBLICATION TRENDS (JANUARY 2013–MAY 2023)
- FIGURE 28 VETERINARY API MARKET: TOP APPLICANTS (COMPANIES/INSTITUTES) FOR PATENTS (2013–2023)
- FIGURE 29 VALUE CHAIN ANALYSIS: VETERINARY API MARKET
- FIGURE 30 ANIMAL ANTIBIOTICS AND ANTIMICROBIALS MARKET: MARKET OVERVIEW
- FIGURE 31 INFLUENCE OF STAKEHOLDERS ON BUYING PROCESS FOR TOP THREE API TYPES
- FIGURE 32 VETERINARY API MARKET: GEOGRAPHIC GROWTH OPPORTUNITIES
- FIGURE 33 NORTH AMERICA: VETERINARY API MARKET SNAPSHOT
- FIGURE 34 ASIA PACIFIC: VETERINARY API MARKET SNAPSHOT
- FIGURE 35 OVERVIEW OF STRATEGIES ADOPTED BY KEY PLAYERS IN VETERINARY API MARKET
- FIGURE 36 REVENUE ANALYSIS FOR KEY PLAYERS IN VETERINARY API MARKET
- FIGURE 37 VETERINARY API MARKET SHARE ANALYSIS, BY KEY PLAYER, 2022
- FIGURE 38 VETERINARY API MARKET: COMPANY EVALUATION MATRIX, 2022
- FIGURE 39 BOEHRINGER INGELHEIM GMBH: COMPANY SNAPSHOT (2022)
- FIGURE 40 ZOETIS, INC.: COMPANY SNAPSHOT (2022)
- FIGURE 41 ELANCO ANIMAL HEALTH INCORPORATED: COMPANY SNAPSHOT (2022)
- FIGURE 42 MERCK & CO., INC.: COMPANY SNAPSHOT (2022)
- FIGURE 43 VIRBAC: COMPANY SNAPSHOT (2022)
- FIGURE 44 VETOQUINOL S.A.: COMPANY SNAPSHOT (2022)
- FIGURE 45 SEQUENT SCIENTIFIC LIMITED: COMPANY SNAPSHOT (2022)
- FIGURE 46 PHIBRO ANIMAL HEALTH CORPORATION: COMPANY SNAPSHOT (2022)
- FIGURE 47 FABBRICA ITALIANA SINTETICI: COMPANY SNAPSHOT (2022)
- FIGURE 48 EXCEL INDUSTRIES LTD.: COMPANY SNAPSHOT (2022)
- FIGURE 49 NGL FINE-CHEM: COMPANY SNAPSHOT (2022)
The market size for Veterinary API Market was estimated using four main methods in this study. The market, as well as its peer and parent markets, were the subject of extensive research. The subsequent phase involved doing primary research to confirm these conclusions, presumptions, and estimates with industry professionals across the value chain. For estimating the value market, top-down and bottom-up strategies were both used. The market size of segments and subsegments was then estimated using market breakdown and data triangulation processes.
Secondary Research
There were several secondary sources used in this study, including directories, databases like Bloomberg Business, Factiva, and Dun & Bradstreet, white papers, annual reports, corporate house documents, investor presentations, and firm SEC filings. To find and gather data for the detailed, technical, market-focused, and commercial analysis of the Veterinary API Industry, secondary research was carried out. Relevant information on major companies, market classification and segmentation according to industry trends down to the most basic level, and significant changes regarding market and technological views were also obtained. Additionally, utilizing secondary research, a database of the important industry executives was created.
Primary Research
To gather qualitative and quantitative data for this study, a variety of sources from the supply and demand sides were interviewed during the main research phase. CEOs, vice presidents, marketing and sales directors, business development managers, technology, and innovation directors of Veterinary API Industry manufacturing businesses, key opinion leaders, suppliers, and distributors are the main sources on the supply side.
The breakup of primary research:
Supply Side
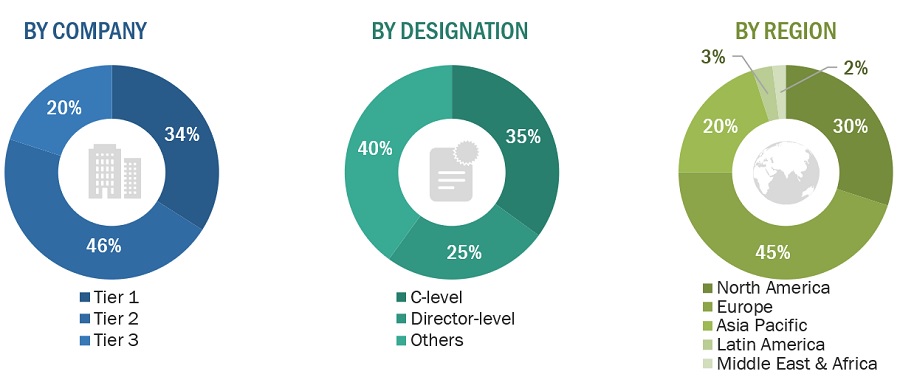
To know about the assumptions considered for the study, download the pdf brochure
Market Size Estimation
The market size for Veterinary API Market was calculated using data from four different sources, as will be discussed below. Each technique concluded and a weighted average of the four ways was calculated based on the number of assumptions each approach made. The market size for Veterinary API Industry was calculated using data from four distinct sources, as will be discussed below:
Veterinary API Market: Bottom up approach

To know about the assumptions considered for the study, Request for Free Sample Report
Veterinary API Market: Top down approach
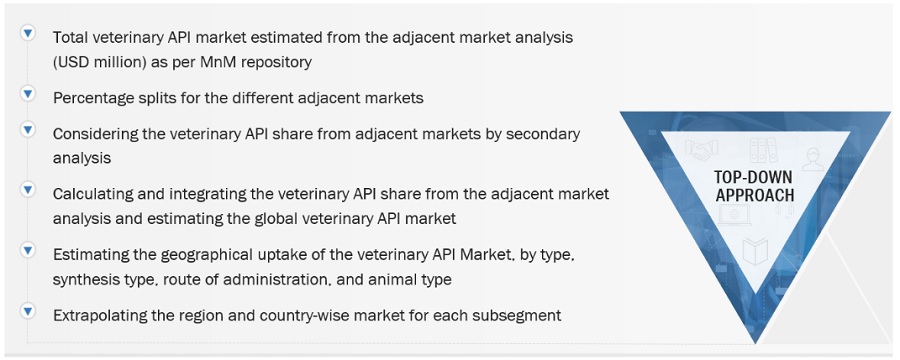
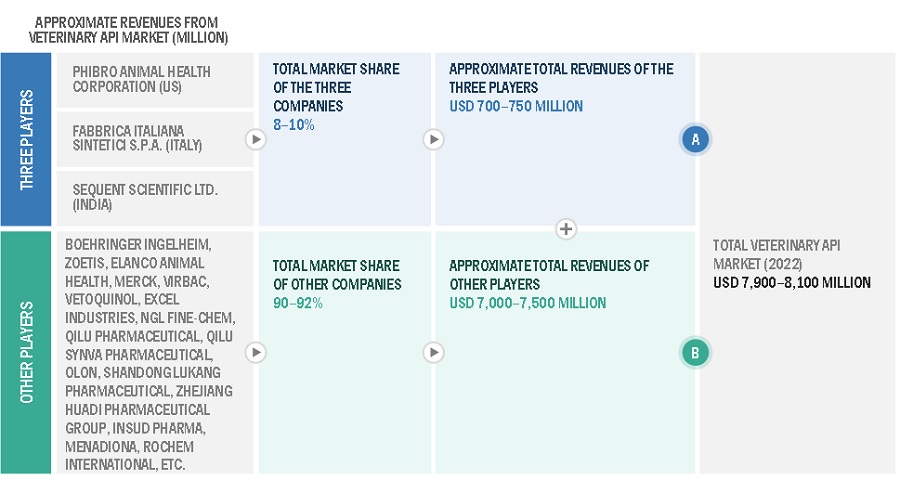
Veterinary API Market: Revenue Share Analysis
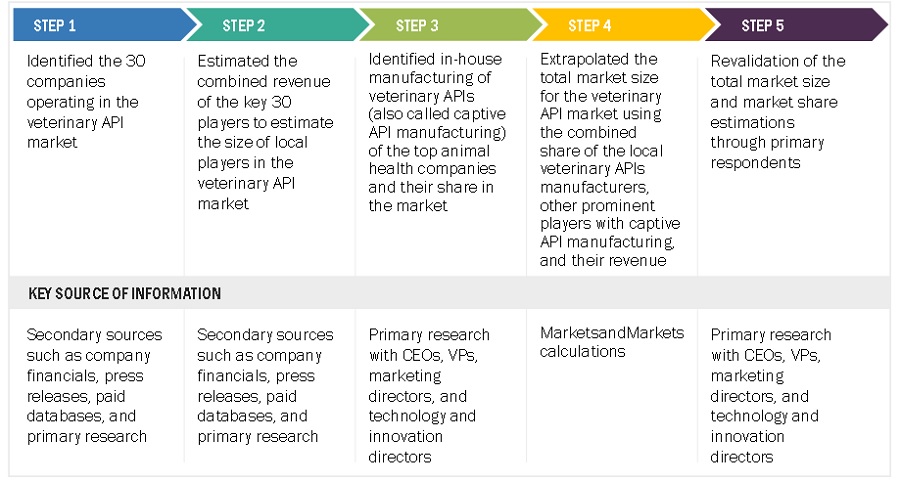
Veterinary API Market: Country level Analysis
Data Triangulation
The entire market was split up into several segments when the market size was determined. Data triangulation and market breakdown processes were used where necessary to complete the entire market engineering process and arrive at the precise statistics for all segments.
Approach to derive the market size and estimate market growth
Using secondary data from both paid and unpaid sources, the market rankings for the major players were determined following a thorough analysis of their sales of veterinary APIs. Due to data restrictions, the revenue share in certain cases was determined after a thorough analysis of the product portfolio of big corporations and their individual sales performance. This information was verified at each stage by in-depth interviews with professionals in the field.
Market Definition
The market for Active Pharmaceutical Ingredients (APIs) used in the manufacturing of veterinary drugs and medications that are specifically designed and manufactured to cater to the healthcare needs of animals, including livestock, companion animals, and other veterinary species is referred to as Veterinary API Market.
Key Stakeholders
- Veterinary API Manufacturers
- Veterinary API Distributors
- Animal Health R&D Companies
- Veterinary Clinics and Hospitals
- Veterinary Pharmaceutical Associations
- Veterinary Research Institutes and Universities
- Venture Capitalists and Investors
- Market Research and Consulting Firms
- Government Associations
Objectives of the Study
- To define, describe, segment, and forecast the Veterinary API Industry based on API type, Synthesis Type, Route of Administration, Animal Type, and region.
- To provide detailed information regarding the major factors influencing the market growth (such as drivers, restraints, opportunities, and challenges).
- To assess the Veterinary API Industry regarding Porter’s five forces analysis, regulatory landscape, value chain, supply chain, ecosystem analysis, patent analysis, and the impact of the economic recession.
- To analyze micromarkets with respect to individual growth trends, prospects, and contributions to the overall market.
- To forecast the size of the Veterinary API Industry in North America, Europe, Asia Pacific, Latin America, and the Middle East and Africa.
- To analyze opportunities in the market for stakeholders and provide details of the competitive landscape.
- To profile the key players in the Veterinary API Industry and comprehensively analyze their core competencies.
- To track and analyze competitive developments such as product launches and approvals, acquisitions, expansions, partnerships, and agreements in the Veterinary API Industry.


Growth opportunities and latent adjacency in Veterinary API Market