Veterinary CT Scanner Market by Type (Multi Slice CT Scanner, Portable CT Scanner), Animal (Small Animals, Equine, Livestock), Application (Neurology, Oncology, Orthopedic, Traumatology), End User (Animal Hospital, Clinic) - Global Forecast to 2022


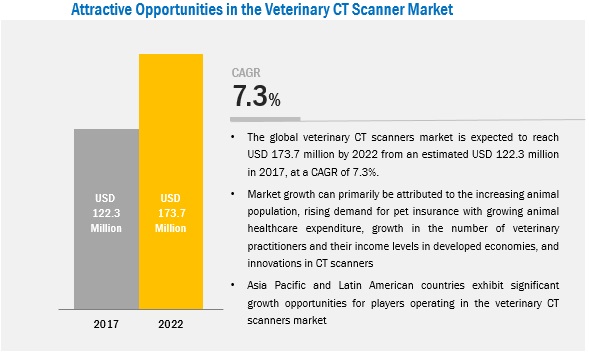
[184 Pages Report] The veterinary CT scanners market is expected to reach USD 173.7 million by 2022 from an estimated USD 122.3 million in 2017, at a CAGR of 7.3%. Veterinary CT scanners offer effective and early diagnosis of various conditions in the animal body such as, neurology, oncology, orthopedics, traumatology, and many other applications in animal healthcare. The veterinary CT scanners are used by veterinary hospitals and clinics as well as by university teaching hospitals & academic institutes on small companion animals, equine and livestock, and other animals (zoo and exotic animals). The base year considered for the study is 2017, and the forecast has been provided for the period between 2018 and 2023.
Market Dynamics
Drivers
- Increasing small companion animal population
- Rising demand for pet insurance with growing animal health expenditure
- Growth in the number of veterinary practitioners and their income levels in developed economies
- Innovations in veterinary CT scanners
Restraints
- High cost of veterinary CT scanners
Opportunities
- Emerging markets
Challenges
- Low animal health awareness in emerging markets
- Shortage of veterinary practitioners in developing markets
Use of veterinary CT scanners for the diagnosis of small companion animals to drive the veterinary CT scanners market.
The small companion animals segment includes dogs, cats, and other companion animals such as birds and small mammals. The growing population of small companion animals, rising pet ownership, increasing pet healthcare expenditure, and growing demand for pet insurance are the major factors driving the growth of small companion animal segment in veterinary CT scanner market.
The following are the major objectives of the study.
- To define, describe, and forecast the global veterinary computed tomography (CT) scanners market by type, animal type, application, end user, and region
- To provide detailed information regarding major factors influencing the growth of the market (drivers, restraints, opportunities, and industry-specific challenges)
- To analyze micromarkets1 with respect to individual growth trends, prospects, and contributions to the overall market
- To analyze opportunities in the market for stakeholders and provide details of the competitive landscape of market leaders
- To forecast the size of the veterinary CT scanners market with respect to five main regions— North America, Europe, Asia-Pacific, Latin America, and the Middle East & Africa
- To profile the key players in the global veterinary CT scanner market and comprehensively analyze their core competencies2
- To track and analyze competitive developments such as joint ventures, agreements and partnership, mergers and acquisitions, and product developments and launches of key players in the global veterinary CT scanners market
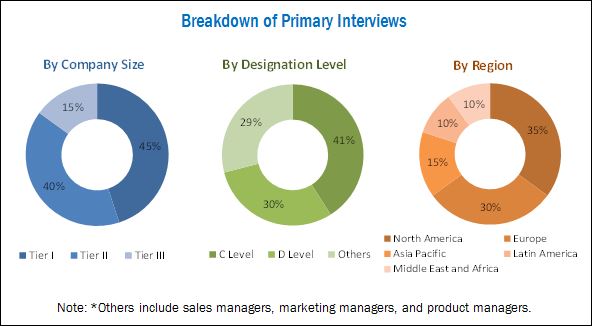
During this research study, major players operating in the Reed Sensor market in various regions have been identified, and their offerings, regional presence, and distribution channels have been analyzed through in-depth discussions. Top-down and bottom-up approaches have been used to determine the overall market size. Sizes of the other individual markets have been estimated using the percentage splits obtained through secondary sources such as Hoovers, Bloomberg BusinessWeek, and Factiva, along with primary respondents. The entire procedure includes the study of the annual and financial reports of the top market players and extensive interviews with industry experts such as CEOs, VPs, directors, and marketing executives for key insights (both qualitative and quantitative) pertaining to the market. The figure below shows the breakdown of the primaries on the basis of the company type, designation, and region considered during the research study.
To know about the assumptions considered for the study, download the pdf brochure
Key players considered in the analysis of the veterinary CT scanners market are GE Healthcare (US), Canon, Inc. (Toshiba Medical Systems Corporation) (Japan), Epica Medical Innovations (US), NeuroLogica Corporation (US), Siemens Healthineers (Germany), Koninklijke Philips N.V. (Netherlands), Hitachi, Ltd. (Japan), Animage LLC (US), QR srl (Italy), GIN ApS (Denmark), and 4DDI (U.S.).
Major Market Developments
- In 2016, Canon, Inc. (Japan) acquired Toshiba Medical Systems Corporation (Japan) to enter the veterinary CT scanners market
- In 2016, Animage, LLC (US) partnered with Sound (US) to sell, and distribute Fidex-CT scanners in the US veterinary market.
- In 2015, Hitachi, Ltd. (Japan) launched SCENARIA SE – with 64 and 128 slice scanning capacity.
Target Audience
- Veterinary imaging system manufacturers
- Veterinary imaging system suppliers
- Veterinary hospitals, clinics, and reference laboratories
- Veterinary academic and research institutions
- Government associations
- Market research and consulting firms
- Venture capitalists and investors
Report Scope
By Type
-
Stationary Multi Slice CT Scanners
- High-end CT Scanners
- Mid-end CT Scanners
- Low-end CT Scanners
- Portable CT Scanners
By Animal Type:
- Small Companion Animals
- Equine and Livestock
- Other Animals
By Application:
- Neurology
- Oncology
- Orthopedics & Traumatology
- Other Applications
By Geography:
- North America
- Europe
- Asia Pacific (APAC)
- Latin America
- Middle East & Africa
Critical questions which the report answers
- Which are the key players in the market and how intense is the competition?
- What are the key strategies adopted by the leading players in the veterinary CT scanners market?
Available Customizations
With the given market data, MarketsandMarkets offers customizations as per the company’s specific needs. The following customization options are available for the report:
Product Analysis
- Product matrix, which gives a detailed comparison of the product portfolios of each company
Geographic Analysis
- Further breakdown of the Rest of the European veterinary CT scanners market into the Netherlands, Switzerland, and other European countries
- Further breakdown of Rest of Asia-Pacific veterinary CT scanners market into Australia, South Korea, Malaysia, and other APAC countries
The veterinary CT scanners market is expected to reach USD 173.7 million by 2022 from an estimated USD 122.3 million in 2017, at a CAGR of 7.3%. The growth of the global veterinary CT scanners market during the forecast period is mainly driven by the increase in animal healthcare spending and growing pet insurance purchase, the growing companion animal population, increase in the number of veterinary practitioners and their income levels in developed regions, and launch of advanced, innovative CT scanners.
Veterinary CT scanners are used for the effective and early diagnosis and treatment process of various conditions in the animal body such as, neurology, oncology, orthopedics, traumatology, and many other applications in animal healthcare.
The veterinary CT scanners market has been segmented by type, into stationary multi slice CT scanners (high-end CT scanners, mid-end CT scanners, and low-end CT scanners), and portable CT scanners.
The market for portable CT scanners is expected to grow at the highest CAGR between 2017 and 2022. Due to their portability, these systems can be used for on-field diagnostic imaging. In many cases, portable CT imaging can provide information that cannot be obtained using portable radiography and ultrasound. Moreover, these systems are affordable and require limited space. Their growing adoption for on-field, mobile, or ambulatory veterinary diagnosis is a key driver for this segment.
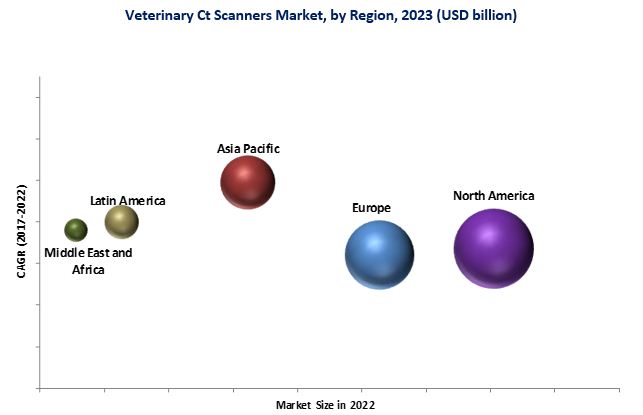
The veterinary CT scanners market in APAC is expected to grow at the highest CAGR during the forecast period. Growth in pet adoption, increasing awareness about animal health, and growing per capita animal health expenditure, especially in India and China, are contributing to the growth of the APAC veterinary CT scanners market.
Applications of veterinary CT scanner in neurology to drive the growth of veterinary CT Scanners market.
Neurology
CT is a common technique utilized for the diagnosis of various brain disorders, stroke, and neurological injuries. CT is widely used to diagnose intervertebral disc herniation in animals. As compared to MRI, CT boasts greater image generation speed as well as a lower cost.
Oncology
CT and PET/CT are widely used imaging techniques for cancer detection in animals. CT is a preferred method to detect various cancers, including lung cancer and abdominal & bone tumors. It also provides a higher resolution than radiographs and ultrasound. CT is the modality of choice for guidance in many interventional procedures in humans due to its superior contrast, spatial resolution, and its high image quality, especially in areas such as the lung retroperitoneum and bone. Owing to these advantages, the use of CT-directed or CT-guided biopsy procedures is rapidly increasing in veterinary oncology studies as well.
Orthopedics & Traumatology
CT scanning is commonly used for the diagnosis of joint diseases such as arthritis, osteoporosis, lameness diseases, angular limb deformities, bone fractures, and acute traumas in companion animals, equines, livestock, and zoo animals. CT scanners create three-dimensional images of a structure, which is useful in the pre-operative planning of fracture repair or the identification of lesion margins.
Other Applications
Other applications include cardiology, renal disorders, nephrology, dentistry, gastroenterology, gynecology, and respiratory applications. The growing prevalence of renal, oral, gastrointestinal, and respiratory diseases; increasing number of cardiac patients; and increasing usage of CT systems for the diagnosis of heart & blood vessel diseases are expected to drive the growth of this segment.
Critical questions the report answers:
- Which type of CT scanners are likely to dominate the market during the forecast period?
- Which are the growing applications areas of veterinary CT scanner?
The high cost of CT scanners is expected to restrain their adoption amongst veterinary hospitals and private veterinary clinics. Also, the lack of animal health awareness in emerging markets and shortage of veterinary practitioners in developing countries are considered as major challenges for the greater adoption of CT technology in veterinary clinics/hospitals.
Veterinary CT scanners is a very niche market and to maintain the leading position and to garner more share in this market companies are adopting various growth strategies such as, new product launches, new technology developments, partnerships, and joint ventures. Some of the major market players competing in this market include GE Healthcare (US), Canon, Inc. (Toshiba Medical Systems Corporation) (Japan), Epica Medical Innovations (U.S.), NeuroLogica Corporation (US), Siemens Healthineers (Germany), Koninklijke Philips N.V. (Netherlands), Hitachi, Ltd. (Japan), Animage LLC (US), QR srl (Italy), GIN ApS (Denmark), and 4DDI (U.S.).
To speak to our analyst for a discussion on the above findings, click Speak to Analyst
 Exclusive indicates content/data unique to MarketsandMarkets and not available with any competitors.
Table of Contents
1 Introduction (Page No. - 15)
1.1 Objectives of the Study
1.2 Market Definition
1.3 Market Scope
1.3.1 Markets Covered
1.3.2 Years Considered for the Study
1.4 Currency
1.5 Stakeholders
2 Research Methodology (Page No. - 18)
2.1 Research Approach
2.1.1 Secondary Sources
2.1.1.1 Key Data From Secondary Sources
2.1.2 Primary Sources
2.1.2.1 Key Data From Primary Sources
2.1.2.2 Key Industry Insights
2.2 Market Size Estimation
2.3 Market Breakdown and Data Triangulation
2.4 Market Share Estimation
2.5 Assumptions for the Study
3 Executive Summary (Page No. - 26)
4 Premium Insights (Page No. - 32)
4.1 Global Veterinary CT Scanners Market Overview
4.2 Asia-Pacific: Veterinary CT Scanners Market, By Application
4.3 Veterinary CT Scanners Market: Geographic Growth Opportunities
4.4 Veterinary CT Scanners Market: Geographic Mix
4.5 Veterinary CT Scanners Market: Developing vs Developed Countries/Region
5 Market Overview (Page No. - 37)
5.1 Introduction
5.2 Market Dynamics
5.2.1 Market Drivers
5.2.1.1 Increasing Small Companion Animal Population
5.2.1.2 Rising Demand for Pet Insurance With Growing Animal Health Expenditure
5.2.1.3 Growth in the Number of Veterinary Practitioners and Their Income Levels in Developed Economies
5.2.1.4 Innovations in Veterinary CT Scanners
5.2.2 Market Restraints
5.2.2.1 High Cost of Veterinary CT Scanners
5.2.3 Market Opportunities
5.2.3.1 Emerging Markets
5.2.4 Market Challenges
5.2.4.1 Low Animal Health Awareness in Emerging Markets
5.2.4.2 Shortage of Veterinary Practitioners in Developing Markets
6 Global Veterinary CT Scanners Market, By Type (Page No. - 46)
6.1 Introduction
6.2 Stationary Multi-Slice CT Scanners
6.2.1 Mid-End CT Scanners
6.2.2 High-End CT Scanners
6.2.3 Low-End CT Scanners
6.3 Portable CT Scanners
7 Global Veterinary CT Scanners Market, By Animal Type (Page No. - 57)
7.1 Introduction
7.2 Small Companion Animals
7.3 Equine and Livestock
7.4 Other Animals
8 Global Veterinary CT Scanners Market, By Application (Page No. - 64)
8.1 Introduction
8.2 Neurology
8.3 Oncology
8.4 Orthopedics and Traumatology
8.5 Other Applications
9 Global Veterinary CT Scanners Market, By End User (Page No. - 72)
9.1 Introduction
9.2 Veterinary Hospitals and Clinics
9.3 University Teaching Hospitals & Academic Institutes
10 Global Veterinary CT Scanners Market, By Region (Page No. - 77)
10.1 Introduction
10.2 North America
10.2.1 U.S.
10.2.2 Canada
10.3 Europe
10.3.1 Germany
10.3.2 U.K.
10.3.3 France
10.3.4 Italy
10.3.5 Spain
10.3.6 Rest of Europe (RoE)
10.4 Asia-Pacific
10.4.1 China
10.4.2 Japan
10.4.3 India
10.4.4 Thailand
10.4.5 Rest of Asia-Pacific (RoAPAC)
10.5 Latin America
10.6 Middle East and Africa
11 Competitive Landscape (Page No. - 138)
11.1 Introduction
11.2 Market Leadership Analysis
11.3 Competitive Leadership Mapping
11.3.1 Visionary Leaders
11.3.2 Innovators
11.3.3 Emerging Companies
11.3.4 Dynamic Differentiators
11.4 Competitive Benchmarking
11.4.1 Strength of Product Portfolio (For 11 Players)
11.4.2 Business Strategy Excellence (For 11 Players)
*Top 11 Companies Analyzed for This Study are - GE Healthcare (U.S.), Canon, Inc. (Toshiba Medical Systems Corporation) (Japan), Siemens Heathineers (Siemens AG) (Germany), Epica Medical Innovations (U.S.), Samsung Electronics Co. Ltd. (Neurologica Corporation) (South Korea), Koninklijke Philips N.V. (Netherlands), Hitachi, Ltd. (Japan), Animage, LLC (U.S.), QR S.R.L. (Italy), Gin ApS (Denmark), 4DDI (U.S.)
12 Company Profiles (Page No. - 143)
(Overview, Strength of Product Portfolio Business Strategy Excellence Products Offering, Recent Development’s, Business Strategy)*
12.1 GE Healthcare
12.2 Canon, Inc. (Toshiba Medical Systems Corporation)
12.3 Epica Medical Innovations
12.4 Siemens AG (Siemens Healthineers)
12.5 Samsung Electronics Co. Ltd. (Neurologica Corporation)
12.6 Koninklijke Philips N.V.
12.7 Hitachi, Ltd.
12.8 Animage, LLC
12.9 QR S.R.L.
12.10 Gin ApS
*Details on Overview, Strength of Product Portfolio Business Strategy Excellence Products Offering, Recent Development’s, Business Strategy Might Not Be Captured in Case of Unlisted Companies.
13 Appendix (Page No. - 174)
13.1 Insights of Industry Experts
13.2 Discussion Guide
13.3 Knowledge Store: Marketsandmarkets’ Subscription Portal
13.4 Introducing RT: Real-Time Market Intelligence
13.5 Available Customizations
13.6 Related Report
13.7 Author Details
List of Tables (156 Tables)
Table 1 Percentage of Pet Ownership, By Country, 2016
Table 2 Small Companion Animal Population, 2014 vs 2016 (Million)
Table 3 Developed Economies: Number of Veterinary Professionals (2012–2015)
Table 4 New CT Scanners Launched in Recent Years
Table 5 Market Drivers: Impact Analysis
Table 6 Average Price of Veterinary CT Scanners
Table 7 Market Restraints: Impact Analysis
Table 8 Market Opportunities: Impact Analysis
Table 9 Number of Veterinary Professionals, By Country
Table 10 Market Challenges: Impact Analysis
Table 11 Key Brands of Veterinary CT Scanners
Table 12 Global Veterinary CT Scanners Market, By Type, 2015–2022 (USD Million)
Table 13 Global Market, By Country/Region, 2015–2022 (USD Million)
Table 14 Global Stationary Multi-Slice Veterinary CT Scanners Market, By Type, 2015–2022 (USD Million)
Table 15 Global Stationary Multi-Slice Veterinary CT Scanners Market, By Country/Region, 2015–2022 (USD Million)
Table 16 Key Brands of Mid-End Veterinary CT Scanners (8 to 16 Slices)
Table 17 Global Mid-End Veterinary CT Scanners Market, By Country/Region, 2015–2022 (USD Million)
Table 18 Key Brands of High-End Veterinary CT Scanners
Table 19 Global High-End Veterinary CT Scanners Market, By Country/Region, 2015–2022 (USD Million)
Table 20 Global Low-End Veterinary CT Scanners Market, By Country/Region, 2015–2022 (USD Million)
Table 21 Key Brands of Portable Veterinary CT Scanners
Table 22 Global Portable Veterinary CT Scanners Market, By Region/Country, 2015–2022 (USD Million)
Table 23 Global Market, By Animal Type, 2015–2022 (USD Million)
Table 24 Population of Small Companion Animals, By Country, 2014 vs 2016 (Million)
Table 25 Global Market for Small Companion Animals, By Country, 2015–2022 (USD Million)
Table 26 Global Market for Equine and Livestock, By Country, 2015–2022 (USD Million)
Table 27 Global CT Scanners Market for Other Animals, By Country, 2015–2022 (USD Million)
Table 28 Global Market, By Application, 2015–2022 (USD Million)
Table 29 Global Market for Neurology, By Country/ Region, 2015–2022 (USD Million)
Table 30 Commonly Used CT Scanners for Veterinary Oncology Studies
Table 31 Global Market for Oncology, By Country/Region, 2015–2022 (USD Million)
Table 32 Global Market for Orthopedics and Traumatology, By Country/Region, 2015–2022 (USD Million)
Table 33 Percentage of Dogs and Cats Suffering From Target Diseases in the U.S., 2016
Table 34 Global Market for Other Applications, By Region/Country, 2015–2022 (USD Million)
Table 35 Global Market, By End User, 2015–2022 (USD Million)
Table 36 Number of Private Veterinary Clinical Practices, By Country, 2010 vs 2014
Table 37 Global Market for Veterinary Hospitals and Clinics, By Country, 2015–2022 (USD Million)
Table 38 Global Market for University Teaching Hospitals & Academic Institutes, By Country, 2015–2022 (USD Million)
Table 39 Veterinary CT Scanners Market, By Region, 2015–2022 (USD Million)
Table 40 North America: Veterinary CT Scanners Market, By Country, 2015–2022 (USD Million)
Table 41 North America: Market, By Type, 2015–2022 (USD Million)
Table 42 North America: Veterinary Stationary Multi-Slice CT Scanners Market, By Type, 2015–2022 (USD Million)
Table 43 North America: Market, By Animal Type, 2015–2022 (USD Million)
Table 44 North America: Market, By Application, 2015–2022 (USD Million)
Table 45 North America: Market, By End User, 2015–2022 (USD Million)
Table 46 Veterinary Expenditure Per Animal in the U.S. (USD)
Table 47 N0. of Veterinarians in Private Clinical Practices in the U.S. (2014 vs 2015)
Table 48 U.S.: Veterinary CT Scanners Market, By Type, 2015–2022 (USD Million)
Table 49 U.S.: Veterinary Stationary Multi-Slice CT Scanners Market, By Type, 2015–2022 (USD Million)
Table 50 U.S.: Market, By Animal Type, 2015–2022 (USD Million)
Table 51 U.S.: Market, By Application, 2015–2022 (USD Million)
Table 52 U.S.: Market, By End User, 2015–2022 (USD Million)
Table 53 Canada: Veterinary Practices, By Animal Type (2014 vs 2015)
Table 54 Canada: Veterinary CT Scanners Market, By Type, 2015–2022 (USD Million)
Table 55 Canada: Veterinary Stationary Multi-Slice CT Scanners Market, By Type, 2015–2022 (USD Million)
Table 56 Canada: Market, By Animal Type, 2015–2022 (USD Million)
Table 57 Canada: Market, By Application, 2015–2022 (USD Million)
Table 58 Canada: Market, By End User, 2015–2022 (USD Million)
Table 59 Europe: Market, By Country, 2015–2022 (USD Million)
Table 60 Europe: Market, By Type, 2015–2022 (USD Million)
Table 61 Europe: Veterinary Stationary Multi-Slice CT Scanners Market, By Type, 2015–2022 (USD Million)
Table 62 Europe: Veterinary CT Scanners Market, By Animal Type, 2015–2022 (USD Million)
Table 63 Europe: Market, By Application, 2015–2022 (USD Million)
Table 64 Europe: Market, By End User, 2015–2022 (USD Million)
Table 65 Germany: Pet Population, 2012 vs 2014 (Million)
Table 66 Germany: Percentage of Veterinary Practices, By Animal Type, 2014
Table 67 Germany: Number of Veterinarians, 2010 vs 2014
Table 68 Germany: Veterinary CT Scanners Market, By Type, 2015–2022 (USD Million)
Table 69 Germany: Veterinary Stationary Multi-Slice CT Scanners Market, By Type, 2015–2022 (USD Million)
Table 70 Germany: Market, By Animal Type, 2015–2022 (USD Million)
Table 71 Germany: Market, By Application, 2015–2022 (USD Million)
Table 72 Germany: Market, By End User, 2015–2022 (USD Million)
Table 73 U.K.: Pet Population (Million)
Table 74 U.K.: Practicing and Non-Practicing Veterinarians, 2010 vs 2013
Table 75 Veterinary Practice Premises Under the Royal College of Veterinary Surgeons (Rcvs) Practice Standards Scheme in the U.K., 2013 vs 2014
Table 76 U.K.: Veterinary CT Scanners Market, By Type, 2015–2022 (USD Million)
Table 77 U.K.: Veterinary Stationary Multi-Slice CT Scanners Market, By Type, 2015–2022 (USD Million)
Table 78 U.K.: Market, By Animal Type, 2015–2022 (USD Million)
Table 79 U.K.: Market, By Application, 2015–2022 (USD Million)
Table 80 U.K.: Market, By End User, 2015–2022 (USD Million)
Table 81 France: Pet Population (Million)
Table 82 France: Number of Veterinarians (2010 vs 2015)
Table 83 France: Veterinary CT Scanners Market, By Type, 2015–2022 (USD Million)
Table 84 France: Veterinary Stationary Multi-Slice CT Scanners Market, By Type, 2015–2022 (USD Million)
Table 85 France: Market, By Animal Type, 2015–2022 (USD Million)
Table 86 France: Market, By Application, 2015–2022 (USD Million)
Table 87 France: Market, By End User, 2015–2022 (USD Million)
Table 88 Italy: Livestock Population (Million)
Table 89 Italy: Number of Veterinarians, 2009 vs 2015
Table 90 Italy: Veterinary CT Scanners Market, By Type, 2015–2022 (USD Million)
Table 91 Italy: Veterinary Stationary Multi-Slice CT Scanners Market, By Type, 2015–2022 (USD Million)
Table 92 Italy: Market, By Animal Type, 2015–2022 (USD Million)
Table 93 Italy: Market, By Application, 2015–2022 (USD Million)
Table 94 Italy: Market, By End User, 2015–2022 (USD Million)
Table 95 Spain: Number of Veterinarians, 2010 vs 2015
Table 96 Spain: Veterinary CT Scanners Market, By Type, 2015–2022 (USD Million)
Table 97 Spain: Veterinary Stationary Multi-Slice CT Scanners Market, By Type, 2015–2022 (USD Million)
Table 98 Spain: Veterinary CT Scanners Market, By Animal Type, 2015–2022 (USD Million)
Table 99 Spain: Veterinary CT Scanners Market, By Application, 2015–2022 (USD Million)
Table 100 Spain: Market, By End User, 2015–2022 (USD Million)
Table 101 Companion Animal Ownership in the Rest of Europe, 2016
Table 102 Number of Veterinarians and Paraveterinarians in the Rest of Europe
Table 103 RoE: Veterinary CT Scanners Market, By Type, 2015–2022 (USD Million)
Table 104 RoE: Veterinary Stationary Multi-Slice CT Scanners Market, By Type, 2015–2022 (USD Million)
Table 105 RoE: Market, By Animal Type, 2015–2022 (USD Million)
Table 106 RoE: Market, By Application, 2015–2022 (USD Million)
Table 107 RoE: Market, By End User, 2015–2022 (USD Million)
Table 108 APAC: Veterinary CT Scanners Market, By Country, 2015–2022 (USD Million)
Table 109 APAC: Market, By Type, 2015–2022 (USD Million)
Table 110 APAC: Veterinary Stationary Multi-Slice CT Scanners Market, By Type, 2015–2022 (USD Million)
Table 111 APAC: Market, By Animal Type, 2015–2022 (USD Million)
Table 112 APAC: Market, By Application, 2015–2022 (USD Million)
Table 113 APAC: Market, By End User, 2015–2022 (USD Million)
Table 114 China: Number of Veterinarians, 2010 vs 2012
Table 115 China: Veterinary CT Scanners Market, By Type, 2015–2022 (USD Million)
Table 116 China: Veterinary Stationary Multi-Slice CT Scanners Market, By Type, 2015–2022 (USD Million)
Table 117 China: Market, By Animal Type, 2015–2022 (USD Million)
Table 118 China: Market, By Application, 2015–2022 (USD Million)
Table 119 China: Market, By End User, 2015–2022 (USD Million)
Table 120 Japan: Number of Veterinarians (2010 vs 2015)
Table 121 Japan: Veterinary CT Scanners Market, By Type, 2015–2022 (USD Million)
Table 122 Japan: Veterinary Stationary Multi-Slice CT Scanners Market, By Type, 2015–2022 (USD Million)
Table 123 Japan: Market, By Animal Type, 2015–2022 (USD Million)
Table 124 Japan: Market, By Application, 2015–2022 (USD Million)
Table 125 Japan: Market, By End User, 2015–2022 (USD Million)
Table 126 India: Market, By Type, 2015–2022 (USD Million)
Table 127 India: Veterinary Stationary Multi-Slice CT Scanners Market, By Type, 2015–2022 (USD Million)
Table 128 India: Veterinary CT Scanners Market, By Animal Type, 2015–2022 (USD Million)
Table 129 India: Market, By Application, 2015–2022 (USD Million)
Table 130 India: Market, By End User, 2015–2022 (USD Million)
Table 131 Thailand: Veterinary CT Scanners Market, By Type, 2015–2022 (USD Million)
Table 132 Thailand: Veterinary Stationary Multi-Slice CT Scanners Market, By Type, 2015–2022 (USD Million)
Table 133 Thailand: Market, By Animal Type, 2015–2022 (USD Million)
Table 134 Thailand: Market, By Application, 2015–2022 (USD Million)
Table 135 Thailand: Market, By End User, 2015–2022 (USD Million)
Table 136 Australia: Companion Animal Population (Million)
Table 137 New Zealand: Companion Animal Ownership and Population, 2015
Table 138 RoAPAC: Number of Veterinarians, By Country, 2010 vs 2014
Table 139 RoAPAC: Veterinary CT Scanners Market, By Type, 2015–2022 (USD Million)
Table 140 RoAPAC: Veterinary Stationary Multi-Slice CT Scanners Market, By Type, 2015–2022 (USD Million)
Table 141 RoAPAC: Market, By Animal Type, 2015–2022 (USD Million)
Table 142 RoAPAC: Market, By Application, 2015–2022 (USD Million)
Table 143 RoAPAC: Market, By End User, 2015–2022 (USD Million)
Table 144 Number of Veterinarians (2010 vs 2014)
Table 145 Latin America: Veterinary CT Scanners Market, By Type, 2015–2022 (USD Million)
Table 146 Latin America: Veterinary Stationary Multi-Slice CT Scanners Market, By Type, 2015–2022 (USD Million)
Table 147 Latin America: Market, By Animal Type, 2015–2022 (USD Million)
Table 148 Latin America: Market, By Application, 2015–2022 (USD Million)
Table 149 Latin America: Market, By End User, 2015–2022 (USD Million)
Table 150 Number of Veterinarians in Major Middle Eastern Countries (2010 vs 2014)
Table 151 Africa: Number of Veterinarians, 2010 vs 2014
Table 152 Middle East and Africa: Veterinary CT Scanners Market, By Type, 2015–2022 (USD Million)
Table 153 Middle East and Africa: Veterinary Stationary Multi-Slice CT Scanners Market, By Type, 2015–2022 (USD Million)
Table 154 Middle East and Africa: Market, By Animal Type, 2015–2022 (USD Million)
Table 155 Middle East and Africa: Market, By Application, 2015–2022 (USD Million)
Table 156 Middle East and Africa: Market, By End User, 2015–2022 (USD Million)
List of Figures (28 Figures)
Figure 1 Research Design
Figure 2 Breakdown of Primary Interviews: By Company Type, Designation, and Region
Figure 3 Bottom-Up Approach
Figure 4 Top-Down Approach
Figure 5 Data Triangulation Methodology
Figure 6 Veterinary CT Scanners Market, By Type, 2017 vs 2022
Figure 7 Stationary Multi-Slice CT Scanners Market, By Type, 2017 vs 2022
Figure 8 Veterinary CT Scanners Market, By Application, 2017 vs 2022
Figure 9 Veterinary CT Scanners Market, By Animal Type, 2017 vs 2022
Figure 10 Veterinary CT Scanners Market, By End User, 2017 vs 2022
Figure 11 Geographic Snapshot: Veterinary CT Scanners Market
Figure 12 Innovations in Veterinary CT Scanners to Drive Market Growth
Figure 13 Neurology Segment Commanded the Largest Share of the APAC Veterinary CT Scanners Market in 2016
Figure 14 U.S. Held the Largest Share of the Veterinary CT Scanners Market in 2016
Figure 15 North America to Dominate the Veterinary CT Scanners Market During the Forecast Period
Figure 16 China to Register the Highest Growth During the Forecast Period
Figure 17 Veterinary CT Scanners Market: Drivers, Restraints, Opportunities, and Challenges
Figure 18 North American Pet Health Insurance Market, 2012–2015 (USD Million)
Figure 19 Veterinary CT Scanners Market: Geographic Growth Opportunities
Figure 20 North America: Veterinary CT Scanners Market Snapshot
Figure 21 Asia-Pacific: Veterinary CT Scanners Market Snapshot
Figure 22 Veterinary CT Scanners Market (Global): Competitive Leadership Mapping, 2017
Figure 23 GE Healthcare: Company Snapshot (2016)
Figure 24 Canon, Inc.: Company Snapshot (2016)
Figure 25 Siemens AG: Company Snapshot (2016)
Figure 26 Samsung Electronics Co. Ltd.: Company Snapshot (2016)
Figure 27 Koninklijke Philips N.V.: Company Snapshot (2016)
Figure 28 Hitachi, Ltd.: Company Snapshot (2016)

 Generating Response ...


Growth opportunities and latent adjacency in Veterinary CT Scanner Market