Virtual Retinal Display Market by End-User Industry (Aviation & Tactical, Engineering, Medical, Gaming & Entertainment, Sports, Training & Development, and Others) and Geography - Trends and Forecast to 2035


Virtual Retinal Display Market Summary
The Virtual Retinal Display Market is entering a high-growth phase as advances in augmented reality (AR), mixed reality (MR), wearable computing, artificial intelligence (AI), and miniaturized optical systems accelerate demand for immersive and high-resolution visualization technologies. The global Virtual Retinal Display Market is estimated at approximately USD 1–2 billion in 2025 and is projected to reach USD 20–25 billion by 2035, registering a CAGR of 28%–31% during the forecast period. Virtual retinal displays generate images by projecting modulated light directly toward the retina, creating the perception of a virtual image without relying solely on conventional display panels positioned in front of the eyes.
The technology is attracting attention because of its potential to deliver high-resolution visual information in compact wearable form factors while reducing some limitations associated with traditional displays. Improvements in laser-based projection, micro-optics, MEMS, photonics, eye tracking, optical scanning, and image processing are supporting technological development. At the same time, AI is enhancing eye tracking, image rendering, object recognition, adaptive brightness, and personalized visualization.
The growing adoption of AR glasses, industrial wearables, healthcare visualization systems, defense head-mounted displays, and next-generation human-machine interfaces is creating opportunities for virtual retinal display technologies. In industrial environments, lightweight wearable displays can provide workers with real-time instructions, equipment information, digital twins, maintenance procedures, and remote-assistance data. In healthcare, retinal projection and advanced near-eye display architectures can support visualization, accessibility, medical training, and specialized assistive applications.
The convergence of AI, IoT, cloud computing, edge computing, and automation is also expanding the addressable market. Connected wearable devices can receive data from enterprise systems, sensors, cameras, and cloud platforms and present context-aware information directly within the user's field of view. As digital transformation moves toward more human-centric interfaces, virtual retinal displays could become an important component of future wearable computing ecosystems.
Key Market Trends & Insights
The Virtual Retinal Display Market is characterized by rapid technological innovation and increasing investment in near-eye display architectures. One of the strongest trends is the convergence of retinal projection with AR glasses and compact wearable systems. Manufacturers are exploring smaller optical engines that can deliver high-quality images while reducing device size, weight, and power consumption.
North America is expected to remain a leading regional market, supported by strong investments in AR/VR, defense technology, healthcare innovation, semiconductor development, and advanced wearable computing. The region also benefits from a large ecosystem of technology companies and research institutions working on optical displays and human-computer interfaces.
Asia Pacific is expected to register the fastest growth, supported by electronics manufacturing capabilities, increasing investment in AR/VR technologies, rising demand for smart wearables, and expanding consumer electronics markets in China, Japan, and South Korea.
Laser-based retinal projection is another important technology trend. Compared with conventional displays, laser scanning can potentially support high brightness, compact optical architectures, and flexible image-generation systems. However, eye safety, power consumption, optical alignment, cost, and regulatory requirements remain important considerations.
AI is increasingly becoming part of the display ecosystem. AI-based eye tracking can determine where users are looking, while foveated rendering can allocate computational resources to areas receiving the most visual attention. This can reduce processing requirements and improve energy efficiency in wearable devices.
Market Size & Forecast
- Base year market size (2025): USD 1–2 billion
- Forecast market value (2035): USD 20–25 billion
- CAGR (2025–2035): 28%–31%
- Primary growth factors: AR/VR adoption, AI-powered wearable computing, optical miniaturization, laser projection, healthcare applications, defense modernization, and industrial digitalization.
- Technology outlook: Laser scanning, MEMS, micro-optics, eye tracking, AI-based rendering, waveguide integration, edge computing, and low-power photonics are expected to influence future market development.
Virtual Retinal Display Market Top 10 key takeaway
- The Virtual Retinal Display Market is estimated at USD 1–2 billion in 2025.
- The market is projected to reach USD 20–25 billion by 2035.
- The market is expected to register a CAGR of 28%–31% during 2025–2035.
- AR and MR wearables are expected to represent major demand opportunities.
- Laser-based retinal projection is an important area of technology development.
- AI-powered eye tracking can improve rendering efficiency and user interaction.
- North America is expected to remain a leading regional market.
- Asia Pacific is projected to record the fastest growth.
- Healthcare, industrial, defense, and consumer applications will diversify market demand.
- Miniaturization, lower power consumption, optical safety, and image quality will remain critical innovation priorities.
Product Insights
The product landscape of the Virtual Retinal Display Market includes retinal scanning display modules, wearable retinal projection systems, AR glasses, head-mounted displays, near-eye display engines, and specialized visualization systems. Retinal scanning display modules and compact optical engines are expected to represent important product categories because they form the core hardware required to generate and direct images toward the user's retina.
AR glasses are emerging as a particularly important product category. Traditional smart glasses may rely on microdisplays and optical combiners, whereas retinal projection technologies can provide an alternative architecture in which light is scanned or projected into the eye. This approach can potentially enable compact designs and high-quality visual information.
The demand for lightweight wearable products is encouraging manufacturers to reduce the size of optical components. Advances in MEMS mirrors, semiconductor lasers, micro-optical elements, and integrated photonic components are supporting this trend. Miniaturization is especially important for consumer applications because device weight, comfort, battery life, and appearance strongly influence user acceptance.
Healthcare and assistive applications represent another emerging product category. Specialized retinal projection systems could support visual assistance, accessibility, medical visualization, and customized interfaces. However, these applications require rigorous validation, optical safety assessment, and compliance with relevant medical and regulatory requirements.
AI integration is increasingly influencing product development. Future retinal display devices may dynamically adjust image brightness, contrast, focus, field of view, and rendering quality according to user behavior and environmental conditions. AI-enabled eye tracking can also support intuitive interaction without relying exclusively on physical controls.
Product manufacturers are therefore moving toward integrated optical and computing architectures rather than standalone projection modules. The combination of retinal display engines with cameras, inertial sensors, eye trackers, wireless connectivity, and AI processors is expected to create more capable wearable platforms.
Technology / Component Insights
Technology innovation is at the center of the Virtual Retinal Display Market. Key components include semiconductor lasers, LEDs, MEMS scanners, optical combiners, mirrors, lenses, micro-optical systems, photonic components, image processors, eye-tracking sensors, and control electronics.
Laser scanning is among the most important technologies because it can create images by rapidly directing modulated light. RGB laser systems can potentially deliver a wide color gamut and high brightness, while advancements in semiconductor laser manufacturing are helping reduce component size and cost.
MEMS technology is also important for miniaturized scanning systems. MEMS mirrors can redirect light at high speeds while occupying relatively small physical volumes. Their integration with semiconductor lasers can support compact optical engines suitable for wearable devices.
Eye tracking is becoming increasingly important because retinal displays operate in close proximity to the user's visual system. Accurate eye tracking can help optimize image positioning and enable advanced user interfaces. AI algorithms can process eye movement information to support foveated rendering, gaze-based interaction, and adaptive display behavior.
IoT connectivity provides another growth opportunity. Connected wearable displays can access real-time information from industrial equipment, healthcare platforms, navigation systems, enterprise applications, and smart environments. This transforms the display from a passive visualization device into an intelligent interface.
Cloud computing can provide data-intensive processing and content management, while edge computing enables latency-sensitive functions directly on the wearable device. A hybrid architecture can distribute workloads between local processors and cloud platforms.
Future innovation will increasingly focus on AI-powered optical control, low-power laser systems, integrated photonics, advanced eye tracking, spatial computing, foveated rendering, real-time 3D visualization, and adaptive optics. Improving eye safety and reliability will remain essential as the technology becomes more commercially mature.
Application Insights
The AR and mixed reality application segment is expected to represent one of the most significant opportunities for the Virtual Retinal Display Market. AR systems require compact technologies capable of presenting digital information while allowing users to interact with the physical environment. Retinal projection can potentially support this requirement through advanced near-eye optical architectures.
Industrial applications are expected to grow rapidly as enterprises adopt digital work instructions, remote assistance, predictive maintenance, and digital twins. Workers wearing advanced displays can receive step-by-step instructions, equipment diagnostics, sensor information, and safety alerts without continuously looking away from machinery.
Healthcare represents another promising application. Advanced near-eye displays can support medical training, visualization, accessibility, and specialized clinical applications. Retinal projection may also contribute to future assistive technologies, although medical applications will require greater validation than general-purpose consumer products.
Defense and aerospace applications can benefit from lightweight high-information displays. Pilots, soldiers, and operators may require real-time navigation, targeting information, maps, sensor feeds, and situational-awareness data while maintaining visual attention on their environment.
Consumer applications include smart glasses, immersive entertainment, gaming, navigation, communication, and personal productivity. As wearable computing becomes more mainstream, demand for visually immersive and unobtrusive interfaces could accelerate.
Future opportunities will increasingly emerge from autonomous systems and industrial automation. Wearable displays could provide workers with AI-generated recommendations, real-time equipment information, and automated alerts based on IoT sensor data.
Regional Insights
North America is expected to remain a leading region in the Virtual Retinal Display Market because of its strong technology ecosystem, high R&D investment, advanced defense programs, and growing adoption of AR/VR and spatial computing. The United States is particularly important because of its concentration of optical technology developers, semiconductor companies, defense contractors, healthcare technology organizations, and software companies.
Europe represents another important market, supported by industrial automation, automotive technology, healthcare innovation, aerospace development, and research into photonics. Germany, France, and the UK are expected to contribute significantly to regional demand.
Asia Pacific is projected to achieve the fastest growth during the forecast period. China, Japan, South Korea, and other Asian economies possess strong electronics and semiconductor manufacturing capabilities. Increasing consumer interest in smart glasses, AR devices, gaming, and advanced visualization technologies is expected to support demand.
- North America: Strong R&D investment and advanced AR/VR ecosystems support market leadership.
- Europe: Industrial automation and photonics research create opportunities for advanced display technologies.
- Asia Pacific: Electronics manufacturing and expanding wearable markets support rapid growth.
- China: Strong consumer electronics and AR/VR investment support technology adoption.
- Japan: Advanced optics, robotics, electronics, and healthcare technologies create significant opportunities.
Country-Specific Market Trends
China is expected to record approximately 32%–35% CAGR through 2035, driven by electronics manufacturing, AR/VR investment, smart wearable development, and government-supported technology modernization. Domestic companies are increasingly investing in spatial computing and intelligent wearable technologies.
Japan could achieve approximately 25%–28% CAGR, supported by advanced optical engineering, robotics, healthcare technologies, and consumer electronics. Japanese companies and research institutions have significant capabilities in precision optics and photonics.
In North America, the United States is expected to grow at approximately 28%–31% CAGR, supported by defense applications, AR/VR development, AI investment, and advanced semiconductor technologies. Canada could register approximately 25%–28% CAGR, supported by research capabilities in photonics, AI, and wearable technologies, while Mexico could record approximately 23%–26% CAGR as electronics manufacturing and automotive technology ecosystems expand.
In Europe, Germany is expected to register approximately 25%–28% CAGR, supported by industrial automation, automotive applications, and advanced manufacturing. France could grow at approximately 24%–27% CAGR, supported by aerospace, defense, healthcare, and photonics innovation.
- China: Rapid AR/VR development and electronics manufacturing strengthen market growth.
- Japan: Precision optics and photonics expertise support advanced retinal display development.
- United States: AI, defense, and spatial computing drive high-value applications.
- Germany: Industrial automation creates opportunities for wearable visualization.
- France: Aerospace, defense, and healthcare support specialized applications.
Key Virtual Retinal Display Market Company Insights
The competitive landscape of the Virtual Retinal Display Market includes optical technology companies, AR/VR developers, semiconductor manufacturers, laser technology providers, and specialized display innovators. Key companies and technology developers associated with the broader ecosystem include QD Laser, Inc., Avegant Corporation, Vuzix Corporation, Magic Leap, Inc., MicroVision, Inc., Sony Corporation, Epson, Panasonic Holdings Corporation, and Samsung Electronics.
QD Laser has developed retinal scanning technologies and is particularly associated with laser-based retinal projection. Avegant has focused on advanced near-eye display technologies, while Vuzix has developed smart glasses and wearable display platforms.
Magic Leap has focused on spatial computing and enterprise AR, creating opportunities for advanced near-eye visualization technologies. MicroVision has extensive expertise in laser scanning and MEMS-based display and sensing technologies, while Sony and Samsung contribute capabilities in imaging, displays, semiconductors, and consumer electronics.
Company strategies increasingly emphasize miniaturization, optical efficiency, AI integration, low-power architectures, and integration with broader wearable computing platforms. Partnerships between display companies, semiconductor manufacturers, optics specialists, and software providers are likely to remain important.
- QD Laser: Focuses on retinal scanning and laser-based display technologies.
- Avegant: Develops advanced near-eye and immersive display architectures.
- Vuzix: Emphasizes smart glasses and enterprise wearable applications.
- Magic Leap: Focuses on spatial computing and enterprise AR.
- MicroVision: Develops MEMS-based laser scanning and related optical technologies.
Recent Developments
The Virtual Retinal Display Market is witnessing increased development of compact laser-based projection engines designed for wearable applications. Improvements in semiconductor laser efficiency and MEMS scanning are helping technology developers target smaller and lighter optical systems.
AI integration is another important development. Eye-tracking algorithms and AI-powered rendering can dynamically optimize visual content based on the user's gaze. Foveated rendering can reduce computational requirements by allocating higher image quality to the area where the user is looking.
Technology partnerships are also increasing across the broader AR and photonics ecosystem. Collaborations among optics companies, semiconductor manufacturers, wearable device developers, and software providers are helping accelerate the integration of optical engines, AI processors, sensors, and connectivity.
Market Segmentation
The Virtual Retinal Display Market can be segmented by Product, Technology/Component, Application, and Region. By Product, the market includes retinal scanning display modules, wearable retinal projection systems, AR glasses, head-mounted displays, and specialized near-eye visualization devices. By Technology/Component, the market includes laser projection, LED-based systems, MEMS scanning, micro-optics, optical combiners, eye-tracking technologies, image processors, and control electronics. By Application, the market encompasses consumer electronics, AR/MR, healthcare, industrial applications, defense and aerospace, education, and other specialized applications. By Region, the market includes North America, Europe, Asia Pacific, and Rest of the World.
- By Product: Retinal scanning modules and wearable display systems represent important product categories.
- By Technology: Laser projection and MEMS scanning are key technology areas.
- By Application: AR/MR, industrial, healthcare, defense, and consumer applications provide major opportunities.
- By Connectivity: IoT and wireless connectivity are expanding the functionality of wearable displays.
- By Region: North America leads in technology development, while Asia Pacific is expected to grow fastest.
Conclusion
The Virtual Retinal Display Market is positioned to become an important technology segment within the broader evolution of wearable computing, spatial computing, AR, and advanced human-machine interfaces. With an estimated market size of USD 1–2 billion in 2025 and projected growth to USD 20–25 billion by 2035, the market is expected to expand at a CAGR of 28%–31%.
AI will be a major force shaping the next generation of virtual retinal display systems. AI-powered eye tracking, foveated rendering, adaptive brightness, object recognition, and contextual information delivery can improve both performance and usability. These capabilities will enable displays to respond dynamically to users and their surroundings.
IoT and automation will expand enterprise opportunities by connecting wearable displays with industrial equipment, robotics, smart buildings, healthcare systems, and enterprise software. Workers could receive real-time instructions and AI-generated insights directly through their field of view, supporting faster decision-making and reducing operational errors.
The market's long-term success will depend on overcoming several technical challenges, including eye safety, power consumption, optical alignment, image quality, field of view, manufacturing costs, and user comfort. Companies that successfully address these challenges while maintaining compact form factors will be better positioned to capture emerging opportunities.
By 2035, the convergence of AI, photonics, IoT, spatial computing, edge processing, automation, and advanced optics is expected to transform the role of displays from passive screens into intelligent visual interfaces. This evolution will make the Virtual Retinal Display Market strategically important for technology companies, healthcare providers, industrial organizations, defense agencies, and consumer electronics manufacturers.
FAQs
1. What is the market size of the Virtual Retinal Display Market?
The Virtual Retinal Display Market is estimated at USD 1–2 billion in 2025 and is projected to reach USD 20–25 billion by 2035.
2. What is the growth rate of the Virtual Retinal Display Market?
The market is expected to register a CAGR of 28%–31% from 2025 to 2035, supported by AR/VR adoption, wearable computing, AI, photonics, and advanced optical technologies.
3. What are the key drivers of the Virtual Retinal Display Market?
Key growth drivers include increasing adoption of AR and MR devices, AI-powered wearable computing, laser projection, MEMS scanning, IoT connectivity, industrial digitalization, healthcare applications, and demand for compact high-resolution displays.
4. Which region is expected to lead the Virtual Retinal Display Market?
North America is expected to remain a leading regional market due to strong investment in AR/VR, AI, defense, photonics, and wearable technologies. Asia Pacific is expected to experience the fastest growth during the forecast period.
5. Who are the key companies in the Virtual Retinal Display Market?
Key companies and technology developers include QD Laser, Avegant, Vuzix, Magic Leap, MicroVision, Sony, Epson, Panasonic, and Samsung Electronics. These companies are focusing on retinal scanning, laser projection, smart glasses, spatial computing, MEMS, and advanced near-eye display technologies.
To speak to our analyst for a discussion on the above findings, click Speak to Analyst
 Exclusive indicates content/data unique to MarketsandMarkets and not available with any competitors.
Table of Contents
1 Introduction (Page No. - 11)
1.1 Objectives of Study
1.2 Market Definition
1.3 Study Scope
1.3.1 Markets Covered
1.3.2 Years Considered for the Study
1.3.3 Currency
1.4 Limitations
1.5 Stakeholders
2 Research Methodology (Page No. - 14)
2.1 Introduction
2.2 Virtual Retinal Display Market Size Estimation
2.3 Virtual Retinal Display Market Breakdown & Data Triangulation
2.4 Virtual Retinal Display Market Share Estimation
2.4.1 Key Data Points Taken From Secondary Sources
2.4.2 Key Data Points From Primary Sources
2.4.3 Key Industry Insights
2.5 Market Breakdown & Data Triangulation
2.6 Assumptions
3 Executive Summary (Page No. - 25)
4 Premium Insights (Page No. - 28)
4.1 Growth Drivers for the Virtual Retinal Display Market
4.2 VRD Market – Comparison of Four Geogrpahic Regions
4.3 North American VRD Market
4.4 Gaming & Entertainment Industry Expected to Be the Largest End-User Industry in the VRD Market Between 2016 and 2025
5 Market Overview (Page No. - 33)
5.1 Introduction
5.2 Market Segmentation
5.2.1 Virtual Retinal Display Market, By End-User Industry
5.2.2 Virtual Retinal Display Market, By Geography
5.3 Market Dynamics
5.3.1 Drivers
5.3.1.1 Fast Growing Virtual Reality and Augmented Reality Applications in Gaming, Entertainment, and Other End-User Industries
5.3.1.2 Potential of VRDs to Address Constraints Related to Portability- and Space Requirement of Screen-Based Displays
5.3.1.3 Features Such as Greater Clarity, Low Manufacturing Cost, and Reduced Power Consumption Could Help VRDs Reduce Screen-Based Displays Used By an Individual
5.3.1.4 Complete Privacy Can Be Achieved By Using VRD
5.3.2 Restraints
5.3.2.1 Potential Hazards of Scanning the Laser Light Directly Onto A Human Eye
5.3.2.2 Difficulties in Interpersonal Communication Due to Covered Eyes
5.3.3 Opportunities
5.3.3.1 Demand for Products That Consume Less Power
5.3.3.2 Growing Need of Online Personal Assistance Amongst Smartphone Users
5.3.3.3 Reducing the Number of Screens Used By an Individual
5.3.4 Challenges
5.3.4.1 Development of A Virtual Retinal Display That is Suitable for All Weather Conditions
6 Industry Trends (Page No. - 41)
6.1 Introduction
6.2 Value Chain Analysis
6.3 Emerging Trends
7 Global Virtual Retinal Display Market, By End-User Industry (Page No. - 44)
7.1 Introduction
7.2 Aviation & Tactical
7.3 Engineering
7.4 Medical
7.5 Gaming & Entertainment
7.6 Sports
7.7 Training & Simulation
7.8 Others
8 Global Virtual Retianl Display Market, By Geography (Page No. - 73)
8.1 Introduction
8.2 North America
8.3 Europe
8.4 Asia-Pacific
8.5 RoW
9 Competitive Landscape (Page No. - 87)
9.1 Overview
9.2 Ranking Analysis, Virtual Retinal Displays Market in 2016
9.3 Significant Developments in Visual Retinal Displays Market
10 Company Profiles (Page No. - 92)
10.1 Introduction
10.2 Avegant Corporation
10.2.1 Business Overview
10.2.2 Products
10.2.3 Recent Developments
10.2.4 MnM View
10.2.4.1 Key Strategies
10.3 Microvision Inc.
10.3.1 Business Overview
10.3.2 Products
10.3.3 Recent Developments
10.3.4 MnM View
10.3.4.1 Key Strategies
10.3.4.2 SWOT Analysis
10.4 Texas Instruments
10.4.1 Business Overview
10.4.2 Products
10.4.3 Recent Developments
10.4.4 MnM View
10.4.4.1 Key Strategies
10.4.4.2 SWOT Analysis
10.5 Human Interface Technology Laboratory
10.5.1 Business Overview
10.5.2 Research Projects
10.5.3 Recent Developments
10.5.4 MnM View
10.5.4.1 Key Strategies
10.6 Google Inc.
10.6.1 Business Overview
10.6.2 Products
10.6.3 Recent Developments
10.6.4 MnM View
10.6.4.1 Key Strategies
10.6.4.2 SWOT Analysis
11 Appendix (Page No. - 109)
11.2 Discussion Guide
11.3 Introducing RT: Real Time Market Intelligence
11.4 Available Customizations
11.5 Related Reports
List of Tables (41 Tables)
Table 1 Fast-Growing Virtual Reality and Augmented Realty Applications in Gaming & Entertainment and Other End User Industriesexpected to Propel the Growth of the Virtual Retinal Display Market
Table 2 Potential Hazards of Scanning the Laser Light Directly Onto Human Eye Would Be A Restraint for Virtual Retinal Display Market
Table 3 Growing Need of Online Personal Assistance Amongst Smartphone Users is A Huge Opportunity for the Virtual Retinal Display Market
Table 4 Development of A Virtual Retinal Display Suitable for All Weather Conditions
Table 5 Increasing Application Areas are Driving the Virtual Retinal Display Market
Table 6 Virtual Retinal Display Market Size, By End-User Industry, 2016–2025 (USD Thousand)
Table 7 Aviation & Tactical Industry Market Size for VRD, By Region, 2022–2025 (USD Thousand)
Table 8 North American Aviation & Tactical Industry Market Size for VRD, By Country, 2022–2025 (USD Thousand)
Table 9 European Aviation & Tactical Industry Market Size for VRD, By Country, 2022–2025 (USD Thousand)
Table 10 APAC Aviation & Tactical Industry Market Size for VRD, By Country, 2022–2025 (USD Thousand)
Table 11 Engineering Industry Market Size for VRD, By Region, 2020–2025 (USD Thousand)
Table 12 North American Engineering Industry Market Size for VRD, By Country, 2022–2025 (USD Thousand)
Table 13 European Engineering Industry Market Size, By Country, 2022–2025 (USD Thousand)
Table 14 APAC Engineering Industry Market Size for VRD, By Country, 2022–2025 (USD Thousand)
Table 15 Medical Industry Market Size, By Region, 2021–2025 (USD Thousand)
Table 16 North American Medical Industry Market Size, By Country, 2021–2025 (USD Thousand)
Table 17 European Medical Industry Market Size, By Country, 2021–2025 (USD Thousand)
Table 18 APAC Medical Industry Market Size, By Country, 2021–2025 (USD Thousand)
Table 19 Gaming & Entertainment Industry Market Size, By Region, 2016–2025 (USD Thousand)
Table 20 North American Gaming & Entertainment Industry Market Size, By Country, 2016–2025 (USD Thousand)
Table 21 European Gaming & Entertainment Industry Market Size, By Country, 2016–2025 (USD Thousand)
Table 22 APAC Gaming & Entertainment Industry Market Size, By Country, 2016–2025 (USD Thousand)
Table 23 Sports Industry Market Size, By Region, 2019–2025 (USD Thousand)
Table 24 North American Sports Industry Market Size, By Country, 2019–2025 (USD Thousand)
Table 25 European Sports Industry Market Size, By Country, 2019–2025 (USD Thousand)
Table 26 APAC Sports Industry Market Size, By Country, 2019–2025 (USD Thousand)
Table 27 Training & Simulation Industry Market Size, By Region, 2018–2025 (USD Thousand)
Table 28 North American Training & Simulation Industry Market Size, By Country, 2018–2025 (USD Thousand)
Table 29 European Training & Simulation Industry Market Size, By Country, 2018–2025 (USD Thousand)
Table 30 APAC Training & Simulation Industry Market Size, By Country, 2018–2025 (USD Thousand)
Table 31 Other Industries Market Size, By Region, 2020–2025 (USD Thousand)
Table 32 North American Other Industries Market Size, By Country, 2020–2025 (USD Thousand)
Table 33 European Other Industries Market Size, By Country, 2020–2025 (USD Thousand)
Table 34 APAC Other Industries Market Size, By Country, 2020–2025 (USD Thousand)
Table 35 Global Virtual Retinal Display Market, By Region, 2016–2025 (USD Thousand)
Table 36 North America: Virtual Retinal Display Market, By End-User Industry, 2016–2025 (USD Thousand)
Table 37 Europe: Virtual Retinal Display Market, By End-User Industry, 2016–2025 (USD Thousand)
Table 38 Asia-Pacific: Virtual Retinal Display Market, By End-User Industry, 2016–2025 (USD Thousand)
Table 39 RoW: Virtual Retinal Display Market, By End-User Industry, 2016–2025 (USD Thousand)
Table 40 Avegant Technologies Expected to Lead the Visual Retinal Display Market in 2016
Table 41 Significant Developments
List of Figures (34 Figures)
Figure 1 Virtual Retinal Display Market Covered
Figure 2 Virtual Retinal Display Market: Research Design
Figure 3 Research Methodology
Figure 4 Virtual Retinal Display Market Size Estimation Methodology: Bottom-Up Approach
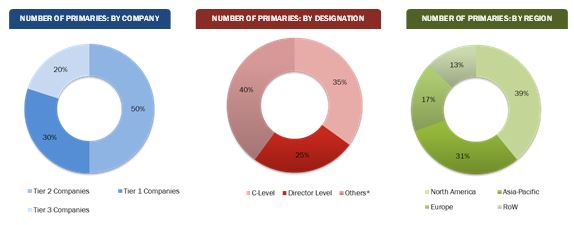
Figure 5 Breakdown of Primary Interviewsbreakdown of Primary Interviews
Figure 6 Virtual Retinal Display Market Breakdown & Data Triangulation
Figure 1 Gaming & Entertainment Industry Expected to Dominate the Overall Virtual Retinal Display Market During 2016–2025
Figure 2 Global Virtual Retinal Display Market, By Region, 2016
Figure 3 Gaming & Entertainment Industry Expected to Drive the Virtual Retinal Display Market Between 2016 and 2025
Figure 4 APAC to Grow at A Higher Rate Between 2016 and 2025
Figure 5 U.S. Would Hold the Largest Share of the North American VRD Market By 2022
Figure 6 North America Would Hold the Largest Share of Most of the End-User Industries
Figure 7 By Geography
Figure 8 Fast-Growing Virtual Reality (VR) and Augmented Reality (AR) Applications in Various End-User Industries Including Gaming and Entertainment Expected to Spur the Demand for Virtual Retinal Display
Figure 9 Value Chain Analysis (2015): Major Value is Added During R&D and Manufacturing Phases
Figure 10 Virtual Retinal Display Market By End-User Industry
Figure 11 Year of Adoption of VRD By End-User Industries and Potential Driving Factors
Figure 12 Sports to Witness the Highest Growth Rate in the VRD Market Between 2019 and 2025
Figure 13 APAC to Witness the Highest Growth Rate in the Aviation & Tactical Industry Between 2022 and 2025 (USD Thousand)
Figure 14 APAC Would Hold the Largest Market Share of the Engineering Industry Between 2022 and 2025 (USD Thousand)
Figure 15 North America to Hold the Largest Market Share in Medical Industry Between 2021 and 2025 (USD Thousand)
Figure 16 APAC to Grow at the Highest CAGR in Gaming & Entertainment Industry Between 2016 and 2025 (USD Thousand)
Figure 17 North America to Grow at the Highest CAGR in Sports Industry Between 2019 and 2025 (USD Thousand)
Figure 18 North America to Hold the Largest Share in Training & Simulation Industry Between 2018 and 2025 (USD Thousand)
Figure 19 North America to Grow at the Highest CAGR in Other Industries Between 2020 and 2025 (USD Thousand)
Figure 20 Geographic Snapshot (2016-2025) –Markets in North America and APAC Expected to Grow Rapidly
Figure 21 Asia-Pacific– an Attractive Destination for All End-User Industries of the Virtual Retinal Display Technology
Figure 22 Asia-Pacific to Witness Highest Growth Between 2016 and 2025
Figure 23 North America: Market With Respect to End User Industries
Figure 24 Virtual Retinal Display Market for Sports in Europe Expected to Grow at the Highest CAGR Between 2016 and 2025
Figure 25 Virtual Retinal Display Market in the Engineering Industry in Asia-Pacific to Grow at the Highest Rate in Between 2020 and 2025
Figure 26 Application in the Gaming & Entertainment Industry Expected to Hold the Largest Share in 2016
Figure 27 Avegant Corporation : Company Snapshot
Figure 28 Microvision Inc: Company Snapshot
Figure 29 Microvision Inc: SWOT Analysis
Figure 30 Texas Instruments: Company Snapshot
Figure 31 Texas Instruments: SWOT Analysis
Figure 32 Human Interface Technology Laboratory : Company Snapshot
Figure 33 Google Inc: Company Snapshot
Figure 34 Google Inc: SWOT Analysis
The research methodology used to estimate and forecast the virtual retinal display market began with gathering data related to the revenue of existing companies through the secondary research. The vendor offerings have also been taken into consideration to determine the market segmentation. The bottom-up procedure has been employed to arrive at the overall size of the global virtual retinal display market from the estimated revenue of e existing key players. After arriving at the overall market size, the total market has been split into several segments and sub-segments and then verified through the primary research by conducting extensive interviews with people holding key positions such as CEOs, VPs, directors, and executives. The data triangulation and market breakdown procedures have been employed to complete the overall market engineering process and arrive at the exact statistics for all segments and sub-segments. The breakdown of profiles of primaries is depicted in the below figure
To know about the assumptions considered for the study, download the pdf brochure
The virtual retinal display ecosystem comprises research & development laboratories, major display companies, start-up companies working on the technology, distributors and end-user industries that implement these systems.
Key Target Audience
- Display technology vendors
- Start-up companies in display technology
- Venture capitalists
- Investment houses
- Consulting firms
- End-user industry players
Scope of the Report:
The research report segments the virtual retinal display market to following submarkets
By end-user industry:
- Aviation & Tactical
- Engineering
- Medical
- Gaming & Entertainment
- Sports
- Training & simulation
- Others
By geography:
- North America
- Europe
- Asia-Pacific
- RoW.
Available customizations:
- Detailed analysis and profiling of additional market players (Upto Five)













Growth opportunities and latent adjacency in Virtual Retinal Display Market