Vision Sensor Market by Sensor Type (Less than 3D, 3D), Application (Inspection, Gauging, Code Reading & Localization), End-User Industry (Automotive, Electronics & Semiconductor, Pharmaceuticals, Food & Packaging), and Geography - Global Forecast to 2025-2035


The global vision sensor market was valued at USD 5.15 billion in 2024 and is estimated to reach USD 24.90 billion by 2036, at a CAGR of 14.1% between 2025 and 2035.
The vision sensor market is driven by the rapid adoption of industrial automation, robotics, and smart manufacturing across sectors such as automotive, electronics, food packaging, and logistics. Integration of artificial intelligence, machine learning, and edge computing is enhancing real-time defect detection, predictive maintenance, and quality control capabilities. Industry 4.0/5.0 implementation and the expansion of smart factories will further accelerate demand. Additionally, miniaturization, improved connectivity through Ethernet/IP and IO-Link, and advances in 3D and dynamic vision technologies will make sensors more versatile and precise. Growth in autonomous vehicles, smart cities, and healthcare robotics will also contribute significantly to market expansion.

Vision sensors are automated devices combining a camera’s image capture capability with computer-based processing to perform inspection and error-proofing tasks. They analyze images to detect object presence, defects, assembly correctness, optical character recognition (OCR), counting, and sorting in industrial environments. Specific applications include quality inspection in manufacturing, robotics for object recognition and guidance, logistics for barcode reading and counting, automated assembly verification, and smart packaging. Key features are ease of use with fast setup, binary or multi-class pass/fail outputs, and ability to handle varying object sizes, colors, and orientations. Vision sensors excel in fast, precise, and reliable automated inspection and decision-making.
Market by Industry
Automotive
The automotive industry is a major driver of the vision sensor market due to its increasing demand for advanced driver assistance systems (ADAS), autonomous driving technologies, and quality inspection applications. Vision sensors are used extensively for object detection, identification, inspection of parts, and guiding robotic arms on automotive assembly lines. The push for vehicle safety, automation, and precision manufacturing fuels the demand. Furthermore, vision sensors enable features such as collision avoidance, lane departure warnings, and parking assistance, which are becoming standard in modern vehicles.
Food & Packaging
The food & packaging industry is significant in the vision sensor market because vision sensors ensure high-quality inspection and safety throughout food production and packaging. They detect defects like damaged packaging, incorrect labeling, improper sealing, and foreign contaminants, preventing compromised products from reaching consumers. Vision sensors verify fill levels and label alignment, improving efficiency and reducing waste. They support compliance with food safety regulations and enable real-time, non-contact, high-speed inspections on packaging lines. These capabilities ensure product integrity, enhance consumer trust, minimize recalls, and boost operational efficiency, making vision sensors indispensable in food & beverage packaging.
Pharmaceutical
The food and packaging industry plays a considerable role in the vision sensor market because vision sensors play a critical role in quality inspection, safety, and efficiency throughout food production and packaging processes. They automatically detect packaging defects such as tears, misaligned labels, improper sealing, and contamination, ensuring product integrity and consumer safety. Vision sensors verify fill levels, label authenticity, and print quality in real time, helping reduce waste and improve compliance with stringent food safety regulations. Their high-speed, non-contact inspections optimize production efficiency while supporting traceability and brand reputation, making them indispensable in modern food and beverage packaging.
Market by Sensor Type
Less-than-3D
Less-than-3D (mainly 2D) vision sensors are significant in the vision sensor market because they offer cost-effective, easy-to-install, and reliable solutions for many common industrial inspection tasks. They excel in high-speed inspections on flat surfaces such as barcode reading, label verification, defect detection, and counting, where depth information is not critical. Compared to complex and expensive 3D systems, 2D sensors have lower upfront costs, simpler setup, and require less processing power, making them ideal for many applications in packaging, consumer electronics, and automotive quality control. Their widespread adaptability and affordability ensure continued strong demand alongside emerging 3D vision systems.
3D sensor
The major growth of 3D sensor types in the vision sensor market is driven by their advanced capability to capture depth information, enabling more precise object recognition, inspection, and measurement than traditional 2D sensors. Key growth drivers include increasing automation across industries such as automotive, electronics, logistics, and healthcare. Integration of AI and machine learning enhances 3D sensor functionality in applications like autonomous vehicles, robotics, and smart city infrastructure. Miniaturization, cost reduction, and higher resolution are expanding market accessibility and adoption. The 3D vision sensor trend continues to accelerate as demand rises for complex, high-precision sensing technologies in Industry 4.0/5.0 and IoT ecosystems.
Market by Geography:
Geographically, the vision sensor market is experiencing widespread adoption across North America, Europe, Asia Pacific, and the Middle East & Africa. The Asia-Pacific region leads the vision sensor market in growth and share due to rapid industrialization, expanding electronics manufacturing, and strong adoption of automation in countries like China, Japan, South Korea, and India. North America holds a prominent position with advanced industrial infrastructure, extensive use of vision sensors in automotive, healthcare, and electronics, and strong AI and robotics integration. Europe follows, supported by mature manufacturing, stringent regulations, and innovation in automotive and industrial sectors. The Rest of the World mainly in emerging regions investing in automation and smart technologies
Market Dynamics
Driver: Growth of electronics and electrical industry
The growth of the electronics and electrical industry is a major driver of the vision sensor market as these sectors require precise, automated inspection and quality control solutions. With increasing complexity in electronic devices, from smartphones to consumer electronics and industrial components, vision sensors enable defect detection, assembly verification, and dimensional measurement at high speed and accuracy. The rise of smart devices, IoT adoption, and miniaturization in electronics further amplifies demand for vision sensors. Industry 4.0 and automation integration boost sensor deployment in electronics manufacturing, helping reduce errors, enhance throughput, and ensure compliance with stringent quality standards, thereby propelling the vision sensor market growth.
Restraint: Adoption of product differentiation strategy by established players
The adoption of product differentiation strategies by established players in the vision sensor market acts as a restraint because it intensifies competition and increases market fragmentation. As leading companies focus on continuous innovation, enhanced product quality, and integration of advanced features like AI and machine learning, smaller players find it difficult to compete due to high capital and R&D investment requirements. Differentiated products often come at a higher price, limiting penetration in cost-sensitive segments. This strategy also elongates product development cycles and complicates supply chains, which may slow overall market growth despite driving technological advancement and specialization.
Opportunity: Application of AI /IIOT in vision sensor systems
The application of AI and IIoT in vision sensor systems offers a significant opportunity for the vision sensor market. AI-powered vision sensors enhance accuracy, flexibility, and automation by enabling intelligent defect detection, object recognition, and quality control with minimal human intervention. These systems learn and adapt over time, improving inspection in complex and variable environments. IIoT integration allows real-time data collection, remote monitoring, and predictive maintenance, boosting operational efficiency and reducing downtime. Together, AI and IIoT make vision sensors more autonomous, scalable, and valuable for smart manufacturing, logistics, healthcare, and autonomous vehicles, driving market growth and technological innovation.
Challenge: Price level sensitivity
Price level sensitivity is a significant challenge in the vision sensor market because the high costs of advanced vision sensor systems limit adoption in price-sensitive industries and small to medium enterprises (SMEs). The initial investment includes not only the sensor hardware but also specialized processing units, software, and integration expenses. Additionally, maintenance and calibration add to operational costs. While technological advancements have reduced costs, many end-users still find the upfront financial burden prohibitive, restricting market penetration especially in emerging markets and sectors focused on cost efficiency rather than high-end performance. This sensitivity slows widespread adoption despite growing automation needs.
Future Outlook
The vision sensor market is projected to grow significantly from 2025 to 2036 driven by widespread adoption of AI and Industry 4.0/5.0 technologies, driving smarter, faster, and more accurate automated inspections. Integration of edge AI processing, enhanced connectivity via Ethernet/IP and IO-Link, and miniaturization will enable seamless incorporation into industrial automation. The growing use of 3D vision sensors for complex applications, along with less-than-3D sensors for cost-sensitive tasks, will balance market expansion. Rising demand in automotive, electronics, food packaging, and smart manufacturing industries will fuel this growth globally, with Asia-Pacific leading adoption followed by North America and Europe.
Key Market Players
Key Vision sensor companies Cognex Corporation (US), Keyence Corporation (Japan), Teledyne Technologies (US), Sick AG (Germany ) Baumer (Switzerland), among others.
Key Questions addressed in this report:
- What are the global trends in demand for the market?
- What are the upcoming technologies/product areas that will have a significant impact on the market in the future?
- What will be the revenue pockets for the market players in the next 10 years?
- What are the prime strategies followed by key players in the market?
 Exclusive indicates content/data unique to MarketsandMarkets and not available with any competitors.
Table of Contents
1 Introduction (Page No. - 16)
1.1 Study Objectives
1.2 Definition
1.3 Study Scope
1.3.1 Markets Covered
1.3.2 Geographic Scope
1.3.3 Years Considered
1.4 Currency
1.5 Limitations
1.6 Stakeholders
2 Research Methodology (Page No. - 20)
2.1 Research Data
2.1.1 Secondary Data
2.1.1.1 Secondary Sources
2.1.2 Primary Data
2.1.2.1 Primary Sources
2.1.2.2 Breakdown of Primaries
2.2 Market Size Estimation
2.2.1 Bottom-Up Approach
2.2.1.1 Analysis of Average Selling Prices of Different Types of Sensors
2.2.2 Top-Down Approach
2.2.2.1 Estimating Value and Volume From Secondary Treasures
2.2.2.2 Validating Derived Results With Companies’ Revenues and Primaries
2.2.3 Market Ranking Estimation
2.3 Market Breakdown and Data Triangulation
2.4 Research Assumptions
3 Executive Summary (Page No. - 27)
4 Premium Insights (Page No. - 31)
4.1 Attractive Opportunities in Vision Sensor Market
4.2 Market, By Sensor Type
4.3 Market in North America, By Country and Industry, 2023
4.4 Market, By Region (2018–2023)
4.5 Market, By Application
4.6 Market, By Industry
5 Market Overview (Page No. - 35)
5.1 Introduction
5.2 Market Dynamics
5.2.1 Drivers
5.2.1.1 Growth of Electronics and Electrical Industry
5.2.1.2 Use of Machine Vision Technology in Automotive Industry and Traffic Safety
5.2.1.3 Focus of Manufacturing Companies on Cost and Time Saving
5.2.2 Restraints
5.2.2.1 Adoption of Product Differentiation Strategy By Established Players
5.2.3 Opportunities
5.2.3.1 Introduction of Iiot in Manufacturing
5.2.3.2 Need for Fewer Devices to Inspect Multiple Parameters
5.2.4 Challenges
5.2.4.2 Price Level Sensitivity
5.2.4.3 Designing Miniaturized Image Sensor Chips
5.3 Value Chain Analysis
5.3.1 R&D
5.3.2 Machine Vision Component Manufacturers
5.3.3 Original Equipment Manufacturers (OEMS)
5.3.4 System Integrators
5.3.5 Resellers and Distributors
5.3.6 End Users
6 Vision Sensor Market, By Sensor Type (Page No. - 41)
6.1 Introduction
6.2 Less Than 3D Vision Sensors
6.2.1 Monochrome Vision Sensors
6.2.1.1 Automotive Industry Will Drive the Demand for Monochrome Sensors for Part Inspection Application
6.2.2 Color Vision Sensors
6.2.2.1 Sorting in Food & Packaging, and Pharmaceutical Industry Will Boost the Market for Color Vison Sensors During the Forecast Period.
6.2.3 Code Readers
6.2.3.1 Text and Character Recognition in Electronics, Food & Packaging, and Pharmaceutical Industry Will Drive the Demand for Code Reader Sensors During the Forecast Period.
6.3 3D Vision Sensors
6.3.1 3D Sensors Market Will Grow at A Faster Rate Due to their Inclusion in Inspection and Robotic Arm Guidance Applications.
6.4 Others
6.4.1 Contour Sensors
6.4.2 Pixel Sensors
7 Vision Sensor Market, By Application (Page No. - 48)
7.1 Introduction
7.2 Inspection
7.2.1 Inspection Will Continue to Maintain Its Position as the Leading Application for Vision Sensors
7.3 Gauging
7.3.1 Gauging Application Will Continue to Grow Due to Increased Adoption in Material Handling and Warehousing Industry
7.4 Code Reading
7.4.1 Code Reading Application Will Grow and the Fastest Rate Due to the Increased Adoption in Pharmaceuticals, and Food & Packaging Industries.
7.5 Localization
7.5.1 APAC Will Be the Leading Market for Vision Sensors for Localization Application
8 Vision Sensor Market, By Industry (Page No. - 54)
8.1 Introduction
8.2 Automotive
8.2.1 Inspection and Localization Applications Will Drive the Market for Vision Sensors in Automotive Industry.
8.3 Electronics & Semiconductor
8.3.1 Code Reading and Localization Applications Will Boost the Demand for Vision Sensors From Electronics and Semiconductor Industry.
8.4 Consumer Electronics
8.4.1 APAC Will Be the Fastest Growing Market for Vision Sensors for the Consumer Electronics Industry
8.5 Pharmaceuticals
8.5.1 North America Will Continue to Dominate the Market for Vision Sensors in the Pharmaceutical Industry
8.6 Food & Packaging
8.6.1 Demand for Stringent Checks During Quality Testing and Packaging Will Boost the Demand for Vision Sensors in the Food & Packaging Industry.
8.7 Others
8.7.1 Metals
8.7.2 Machinery
9 Geographic Analysis (Page No. - 75)
9.1 Introduction
9.2 North America
9.2.1 US
9.2.1.1 US Holds Significant Share of the North American Market for Vision Sensors
9.2.2 Canada
9.2.2.1 Increasing Investments in Biopharmaceutical and Pharmaceutical Industry Will Boost the Vision Sensor Market in Canada During the Forecast Period 80
9.2.3 Mexico
9.2.3.1 The Modernization of the Mexican Automotive Industry Will Boost the Vision Sensor During the Forecast Period
9.3 Europe
9.3.1 Germany
9.3.1.1 Increased Focus on Product Quality and Process Optimization Will Boost the Market in Germany
9.3.2 France
9.3.2.1 Upgradation of Existing Manufacturing Facilities in France Will Lead to Increased Demand for Vision Sensors During the Forecast Period.
9.3.3 UK
9.3.3.1 Revival of Ageing Manufacturing Sector Will Lead to Increased Adoption of Vision Sensors in the UK During the Forecast Period
9.3.4 Italy
9.3.4.1 Italy Will Continue to Hold A Significant Market Share of the Vision Sensor Market Due to Its Food, and Automotive Industry.
9.3.5 Rest of Europe
9.4 APAC
9.4.1 China
9.4.1.1 China's Drive to Become the Leading Manufacturing Nation in the World Will Drive the Demand for Automation and Vision Sensors During the Forecast Period.
9.4.2 Japan
9.4.2.1 Initiatives to Accelerate the Adoption of Industry 4.0 Will Boost the Market in Japan.
9.4.3 South Korea
9.4.3.1 Increased Adoption of Industrial Robotics and Automation Systems By the Electronics Industry in South Korea Will Drive the Vision Sensor Market During the Forecast Period.
9.4.4 India
9.4.4.1 India Will Be the Fastest Growing Market for Vision Sensors
9.4.5 Rest of APAC
9.5 RoW
9.5.1 South America
9.5.1.1 Heavy Investments Towards Modernization of the South American Automotive Industry Will Drive the Vision Sensor Market
9.5.2 Africa
9.5.2.1 Migration of Manufacturing Projects to Africa Will Provide an Opportunity for Growth of the Market During the Forecast Period
9.5.3 Middle East
9.5.3.1 Heavy Investments Towards Setting Up Modernized Manufacturing Infrastructure Will Boost the Vision Sensor Market in the Middle East During the Forecast Period.
10 Competitive Landscape (Page No. - 98)
10.1 Overview
10.2 Market Player Ranking Analysis
10.3 Competitive Scenario
10.3.1 Product Launches and Developments
10.3.2 Acquisitions & Expansions
10.3.3 Partnerships & Collaborations
10.3.4 Others
10.4 Competitive Leadership Mapping
11 Company Profiles (Page No. - 111)
11.1 Introduction
(Business Overview, Products Offered, Recent Developments, SWOT Analysis, and MnM View)*
11.2 Key Players
11.2.1 Cognex Corporation
11.2.2 Teledyne Technologies
11.2.3 Keyence Corporation
11.2.4 Sick AG
11.2.5 Balluff GmhH.
11.2.6 Baumer Holding AG
11.2.7 Ifm Electronic GmhH
11.2.8 Leuze Electronic GmhH + Co Kg.
11.2.9 Pepperl+Fuchs GmhH
11.2.10 Hans Turck GmhH & Co. Kg
11.3 Other Key Players
11.3.1 Omron Microscan Systems
11.3.2 Basler AG.
11.3.3 Datalogic SPA
11.3.4 Sensopart GmhH
11.3.5 Wenglor Sensoric AG
11.3.6 Aquifi
11.3.7 Ximea GmhH
11.3.8 Micro-Epsilon Messtechnik GmhH Co. Kg
11.3.9 Isra Vision
11.3.10 Sualab
11.3.11 Qualitas Technologies
*Details on Business Overview, Products Offered, Recent Developments, SWOT Analysis, and MnM View Might Not Be Captured in Case of Unlisted Companies.
12 Appendix (Page No. - 151)
12.1 Discussion Guide
12.2 Knowledge Store: Marketsandmarkets’ Subscription Portal
12.3 Available Customizations
12.4 Related Reports
12.5 Author Details
List of Tables (66 Tables)
Table 1 Vision Sensor Market, By Sensor Type, 2015–2023 (USD Million)
Table 2 Market, By Sensor Technology, 2015–2023 (USD Million)
Table 3 Less Than 3D Vision Sensor Market, By Application, 2015–2023 (USD Million)
Table 4 3D Vision Sensor Market, By Application, 2015–2023 (USD Million)
Table 5 Market, By Application, 2015–2023 (USD Million)
Table 6 Market for Inspection Application, By Sensor Type, 2015–2023 (USD Million)
Table 7 Market for Gauging Application, By Sensor Type, 2015–2023 (USD Million)
Table 8 Market for Code Reading Application, By Sensor Type, 2015–2023 (USD Million)
Table 9 Market for Localization Application, By Sensor Type, 2015–2023 (USD Million)
Table 10 Market, By Industry, 2015–2023 (USD Million)
Table 11 Market for Automotive Industry, By Region, 2015–2023 (USD Million)
Table 12 Market in North America for Automotive Industry, By Country, 2015–2023 (USD Million)
Table 13 Market in Europe for Automotive Industry, By Country, 2015–2023 (USD Million)
Table 14 Market in APAC for Automotive Industry, By Country, 2015–2023 (USD Million)
Table 15 Market in RoW for Automotive Industry, By Region, 2015–2023 (USD Million)
Table 16 Market for Electronics & Semiconductor Industry,By Region, 2015–2023 (USD Million)
Table 17 Market in North America for Electronics & Semiconductor Industry, By Country, 2015–2023 (USD Million)
Table 18 Market in Europe for Electronics & Semiconductor Industry, By Country, 2015–2023 (USD Million)
Table 19 Market in APAC for Electronics & Semiconductor Industry, By Country, 2015–2023 (USD Million)
Table 20 Market in RoW for Electronics & Semiconductor Industry, By Region, 2015–2023 (USD Million)
Table 21 Market for Consumer Electronics Industry, By Region, 2015–2023 (USD Million)
Table 22 Market in North America for Consumer Electronics Industry, By Country, 2015–2023 (USD Million)
Table 23 Market in Europe for Consumer Electronics Industry, By Country, 2015–2023 (USD Million)
Table 24 Market in APAC for Consumer Electronics Industry, By Country, 2015–2023 (USD Million)
Table 25 Market in RoW for Consumer Electronics Industry, By Region, 2015–2023 (USD Million)
Table 26 Market in Pharmaceuticals Industry, By Region, 2015–2023 (USD Million)
Table 27 Market in North America for Pharmaceuticals Industry, By Country, 2015–2023 (USD Million)
Table 28 Market in Europe for Pharmaceuticals Industry, By Country, 2015–2023 (USD Million)
Table 29 Market in APAC for Pharmaceuticals Industry, By Country, 2015–2023 (USD Million)
Table 30 Market in RoW for Pharmaceuticals Industry, By Region, 2015–2023 (USD Million)
Table 31 Market for Food & Packaging Industry, By Region,2015–2023 (USD Million)
Table 32 Market in North America for Food & Packaging Industry, By Country, 2015–2023 (USD Million)
Table 33 Market in Europe for Food & Packaging Industry,By Country, 2015–2023 (USD Million)
Table 34 Market in APAC for Food & Packaging Industry, By Country, 2015–2023 (USD Million)
Table 35 Market in RoW for Food & Packaging Industry, By Region, 2015–2023 (USD Million)
Table 36 Market for Other Industries, By Region, 2015–2023 (USD Million)
Table 37 Market in North America for Other Industries, By Country, 2015–2023 (USD Million)
Table 38 Market in Europe for Other Industries, By Country, 2015–2023 (USD Million)
Table 39 Market in APAC for Other Industries, By Country, 2015–2023 (USD Million)
Table 40 Market in RoW for Other Industries, By Region, 2015–2023 (USD Million)
Table 41 Market in RoW for Other Industries, By Region, 2015–2023 (USD Million)
Table 42 Market in North America, By Country, 2015–2023 (USD Million)
Table 43 Market in US, By Industry, 2015–2023 (USD Million)
Table 44 Market in Canada, By Industry, 2015–2023 (USD Million)
Table 45 Market in Mexico, By Industry, 2015–2023 (USD Million)
Table 46 Market in Europe, By Country, 2015–2023 (USD Million)
Table 47 Market in Germany, By Industry, 2015–2023 (USD Million)
Table 48 Market in France, By Industry, 2015–2023 (USD Million)
Table 49 Market in UK, By Industry, 2015–2023 (USD Million)
Table 50 Market in Italy, By Industry, 2015–2023 (USD Million)
Table 51 Market in Rest of Europe, By Industry, 2015–2023 (USD Million)
Table 52 Market in APAC, By Country, 2015–2023 (USD Million)
Table 53 Market in China, By Industry, 2015–2023 (USD Million)
Table 54 Market in Japan, By Industry, 2015–2023 (USD Million)
Table 55 Market in South Korea, By Industry, 2015–2023 (USD Million)
Table 56 Market in India, By Industry, 2015–2023 (USD Million)
Table 57 Market in Rest of APAC, By Industry, 2015–2023 (USD Million)
Table 58 Market in RoW, By Region, 2015–2023 (USD Million)
Table 59 Market in South America, By Industry, 2015–2023 (USD Million)
Table 60 Market in Africa, By Industry, 2015–2023 (USD Million)
Table 61 Market in Middle East, By Industry, 2015–2023 (USD Million)
Table 62 Ranking of Top 5 Players in Vision Sensor Market, 2017
Table 63 Product Development
Table 64 Acquisitions & Expansions
Table 65 Partnerships & Collaborations
Table 66 Key Agreements & Contracts
List of Figures (39 Figures)
Figure 1 Vision Sensor Market Segmentation
Figure 2 Market: Research Design
Figure 3 Research Flow of Market Size Estimation
Figure 4 Market Size Estimation Methodology: Bottom-Up Approach
Figure 5 Market Size Estimation Methodology: Top-Down Approach
Figure 6 Data Triangulation
Figure 7 Assumptions of Research Study
Figure 8 3D Vision Sensors to Exhibit Higher CAGR in Market During 2018–2023
Figure 9 Inspection Application to Account for Largest Size of Market By 2023
Figure 10 Food & Packaging Industry to Command Vision Sensor Market During Forecast Period
Figure 11 Market in APAC to Grow at Highest CAGR During Forecast Period
Figure 12 Increasing Investments Toward Factory Automation in Automotive, Food & Packaging, and Pharmaceuticals Industries to Drive Market Growth in Coming Years
Figure 13 Less Than 3D Sensors Hold Larger Size of Market By 2023
Figure 14 Pharmaceuticals Industry to Hold Largest Share of Market in North America By 2023
Figure 15 Vision Sensor Market in India to Grow at Highest CAGR From 2018 to 2023
Figure 16 Code Reading Application to Witness Highest CAGR in Market During 2018–2023
Figure 17 Food & Packaging Industry to Witness Higher CAGR in Market During Forecast Period
Figure 18 Drivers, Restraints, Opportunities and Challenges for Market
Figure 19 Value Chain Analysis: Maximum Value Added During the Component and Equipment Manufacturing and System Integration Stages
Figure 20 Market, By Sensor Type
Figure 21 Less Than 3D Sensors to Hold Largest Size of Vision Sensor Market in 2023
Figure 22 Market, By Application
Figure 23 Vision Sensors Expected to Have Growing Demand for Inspection Applications During Forecast Period
Figure 24 Food & Packaging Industry to Hold Largest Size of Market By 2023
Figure 25 Market: Geographic Snapshot
Figure 27 Snapshot of Vision Sensor Market in North America
Figure 30 Market Players Adopted Product Launches and Developments as Key Growth Strategy From March 2015 to December 2018
Figure 31 Evaluation Framework: Vision Sensor Market
Figure 32 Competitive Situation and Trend
Figure 33 Vision Sensor Market (Global) Competitive Leadership Mapping, 2018
Figure 35 Teledyne Technologies: Company Snapshot
Figure 36 Keyence Corporation: Company Snapshot
Figure 37 Sick AG: Company Snapshot
Figure 38 Balluff GmhH: Company Snapshot
Figure 39 Pepperl+Fuchs GmhH: Company Snapshot
The study involved four major activities in estimating the current market size for vision sensors. Exhaustive secondary search has been done to collect information on the market, peer market, and parent market. To validate these findings, assumptions, and sizing with industry experts across the value chain through primary research have been the next steps. The top-down and bottom-up approaches have been employed to estimate the complete market size. After that the market breakdown and triangulation procedures have been used to estimate the market size of subsegments.
Secondary Research
In the secondary research process, to identify and collect information for this study, various secondary sources such as Hoovers, Bloomberg BusinessWeek, and Dun & Bradstreet have been referred to. These secondary sources included annual reports, press releases and investor presentations of companies, white papers, certified publications, articles by recognized authors, gold standard and silver standard websites, regulatory bodies, trade directories, and databases.
Primary Research
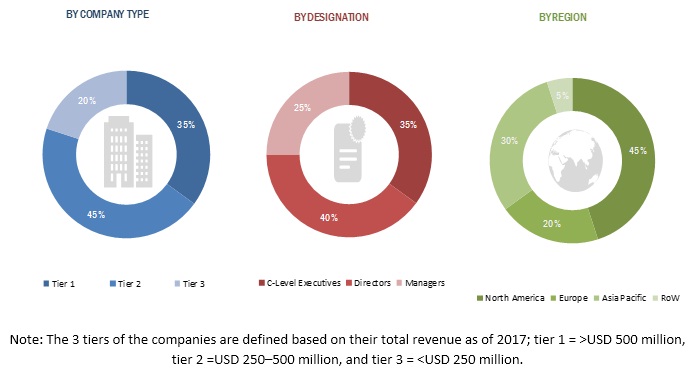
The vision sensor market comprises several stakeholders, such as chip manufacturers, image sensor manufacturers, vision sensor manufacturers, vision system manufacturers, system integrators, end-user industries, industrial associations, and regulatory bodies. The demand side of this market is characterized by the adoption of automation in industries such as automotive, pharmaceuticals, electronics & semiconductor, consumer electronics, and food & packaging. The supply side is characterized by the rapid development in chip technology and programming software. Various primary sources from both the supply and demand sides of the market have been interviewed to obtain qualitative and quantitative information. The breakdown of primary respondents has been provided below.
To know about the assumptions considered for the study, download the pdf brochure
Market Size Estimation
Both top-down and bottom-up approaches have been used to estimate and validate the total size of the vision sensor market. These methods have also been used extensively to estimate the size of various subsegments in the market. The research methodology used to estimate the market size is as follows:
- Key industry players have been identified through extensive secondary research.
- The market size of industries, in terms of value, has been determined through primary and secondary research processes.
- All percentage shares, splits, and breakdowns have been determined using secondary sources and verified through primary sources.
Data Triangulation
After arriving at the overall market size-using the market size estimation processes as explained above—the market has been split into several segments and subsegments. To complete the overall market engineering process and arrive at the exact statistics of each market segment and subsegment, the data triangulation and market breakdown procedures have been employed, wherever applicable. The data has been triangulated by studying various factors and trends from both the demand and supply sides in the automotive, electronics & semiconductor, pharmaceuticals, food & packaging, and other related industries.
Report Objectives
- To define, segment, and project the global market size for vision sensors
- To understand the structure of the vision sensor market by identifying its various subsegments
- To provide detailed information about key factors influencing the growth of the vision sensor market (drivers, restraints, opportunities, and challenges)
- To analyze micromarkets with respect to individual growth trends, prospects, and their contribution to the total market
- To project the size of the market and its submarkets, in terms of value, with respect to the 4 regions – (North America, Europe, APAC, and RoW) along with their respective key countries
- To profile key players and comprehensively analyze their core competencies
- To understand the competitive landscape and identify major growth strategies adopted by players across key regions
- To analyze competitive developments such as expansions & investments, new product launches, mergers & acquisitions, joint ventures, and agreements in the vision sensor market
Scope of the Report
|
Report Metric |
Details |
|
Market size available for years |
2015–2023 |
|
Base year considered |
2017 |
|
Forecast period |
2018–2023 |
|
Forecast units |
Value (USD) and volume (million units) |
|
Segments covered |
Sensor type, application, end-user industry, and region |
|
Geographies covered |
North America, Europe, APAC, and RoW |
|
Companies covered |
Cognex (US), Teledyne (US), Keyence (Japan), Omron (Japan), Baumer (Switzerland), Sick AG (Germany). |
This research report categorizes the overall vision sensor market on the basis of sensor type, application, end-user industry, and geography.
On the basis of sensor type, the vision sensor market is segmented as follows:
- Less than 3D sensors (1D, line scan, area scan, 2D)
- 3D sensors
On the basis of application, the vision sensor market is segmented as follows:
- Inspection
- Gauging
- Code reading
- Localization
On the basis of end-user industry, the vision sensor market is segmented as follows:
- Automotive
- Electronics & semiconductor
- Consumer electronics
- Pharmaceuticals
- Food & packaging
- Others (metals and machinery)
On the basis of region, the vision sensor market is segmented as follows:
- North America
- Europe
- APAC
- RoW
Available Customizations:
With the given market data, MarketsandMarkets offers customizations according to the companies’ specific needs. The following customization options are available for the report:
Geographic Analysis
- Further breakdown of geography segment, by country
Company Information
- Detailed analysis and profiling of additional market players based on various blocks of the value chain


Growth opportunities and latent adjacency in Vision Sensor Market