Vitamin D Therapy Market by Route of administration (Oral, Parenteral), Age Group (Children, Adult, Senior Adult), Purchase Pattern (OTC, Prescription), Application (Osteoporosis, Rickets, Autoimmune Disorder, Skin Diseases) - Global Forecast to 2024


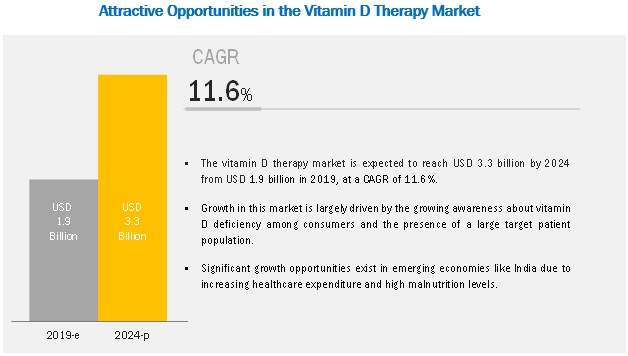
[112 Pages Report] The vitamin D therapy market is projected to reach USD 3.3 billion by 2024 from USD 1.9 billion in 2019, at a CAGR of 11.6% during the forecast period. Growth in this market is largely driven by the growing awareness about vitamin D deficiency and the presence of a large target patient population. On the other hand, the fortification of foods is likely to challenge the growth of this market.
�Oral route of administration expected to fuel the growth of the vitamin D therapy market over the forecast period.�
By route of administration, the market is segmented into oral and parenteral routes of administration. The oral route of administration is expected to register the largest share and highest CAGR during the forecast period. This can be attributed to the ease of administration, better pharmacokinetic and pharmacodynamic activity, reduced chance of toxicity, increased patient compliance, and higher preference for the oral route.
�Increasing use of vitamin D in osteoporosis to drive market growth during the forecast period.�
Based on application, the market is segmented into osteoporosis, rickets, skin diseases, muscle weakness, autoimmune disorders, and other applications. The osteoporosis segment is expected to register the highest growth during the forecast period. This growth can be attributed to the increasing incidence of falls and fractures in senior adults due to the elevated levels of parathyroid hormones and the poor absorption of calcium from their diets.
�The Asia Pacific to grow at the highest rate during the forecast period (2018�2023).�
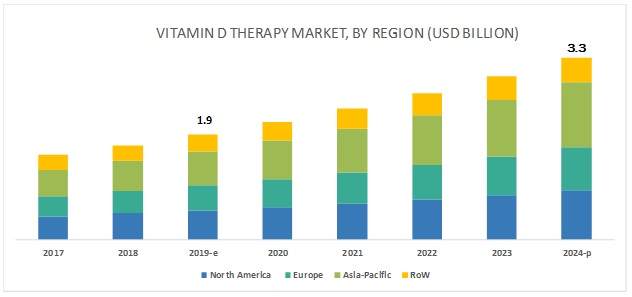
The vitamin D therapy market is geographically segmented into North America, Europe, Asia Pacific, and the Rest of the World (RoW). The Asia Pacific dominated the market in 2018 and is expected to register the highest CAGR during the forecast period. Growth in the APAC is largely driven by the increasing awareness about vitamin D deficiency and supportive government policies and programs for the implementation of vitamin D deficiency treatment plans, heavy air pollution, sedentary lifestyles, increasing incidence of vitamin D deficiency, atypical diets, decreasing sun exposure, and rising malnutrition levels.
Key Market Players
Some of the prominent players in the market are Abbott (US), Sanofi (France), GlaxoSmithKline plc (UK), Pfizer Inc. (US), Merck & Co., Inc. (US), Torrent Pharmaceuticals Ltd. (India), Novartis International AG (Switzerland), Alkem Laboratories (India), Sun Pharmaceutical Industries Ltd. (India), and Cadila Healthcare Ltd (India).
Abbott (US) is the largest player in the vitamin D therapy market. It has a strong foothold in the market. Abbott has a global distribution network and a good brand reputation among end users. The company�s strong presence and wide distribution channels across the globe have helped it to maintain its leading position in the market. In order to strengthen its position in the market, the company significantly invests in R&D activities. In 2018, the company invested USD 2.30 billion in R&D activities as compared to USD 2.26 billion in 2017.
Scope of the Report
|
Report Metric |
Details |
|
Market Size Available for Years |
2017�2024 |
|
Base Year Considered |
2017 |
|
Forecast Period |
2019�2024 |
|
Forecast Units |
Value (USD) |
|
Segments Covered |
Route of administration, purchasing pattern, application, age group, and region |
|
Geographies Covered |
North America (US and Canada), Europe (Germany, France, UK, and RoE), APAC (China, Japan, India, and RoAPAC), and the RoW (Latin America and the Middle East & Africa) |
|
Companies Covered |
Major 10 players covered, including: |
This research report categorizes the vitamin D therapy market into the following segments and subsegments:
Vitamin D therapy: market, by Route of Administration
- Oral Route
- Parenteral Route
Vitamin D therapy: market, by Purchasing Pattern
- OTC Drugs
- Prescription Drugs
Vitamin D therapy: market, by Application
- Osteoporosis
- Rickets
- Skin Diseases
- Muscle Weakness
- Autoimmune Disorders
- Other Applications
Vitamin D therapy: market, by Age Group
- Children
- Adults
- Senior Adults
Vitamin D therapy: market, by Region
- North America
- US
- Canada
- Europe
- Germany
- UK
- France
- Rest of Europe
- Asia Pacific
- China
- Japan
- India
- Rest of Asia Pacific
- Rest of the World
- Latin America
- Middle East & Africa
Recent Developments:
- In 2018, GlaxoSmithKline plc completed the buyout of Novartis� 36.5% stake in its Consumer Healthcare Joint Venture for USD 13 billion.
- In 2018, GlaxoSmithKline plc and Pfizer Inc. collaborated to form a new world-leading consumer healthcare joint venture. The joint venture will be a category leader in pain relief, respiratory, vitamin and mineral supplements, digestive health, skin health, and therapeutic oral health.
Key Questions Addressed in the Report:
- What are the growth opportunities in the vitamin D therapy market across major regions?
- Emerging countries have immense opportunities for the growth and adoption of vitamin D. Will this scenario continue during the next five years?
- Where will all the advancements in products offered by various companies take the industry in the mid- to long-term?
- What are the various vitamin D companies and their respective market shares in the overall market?
- What are the new trends and advancements in the vitamin D therapy market?
To speak to our analyst for a discussion on the above findings, click Speak to Analyst
 Exclusive indicates content/data unique to MarketsandMarkets and not available with any competitors.
Table of Contents
1 Introduction (Page No. - 13)
1.1 Objectives of the Study
1.2 Market Definition
1.2.1 Markets Covered
1.2.2 Years Considered for the Study
1.3 Currency
1.4 Limitations
1.5 Stakeholders
2 Research Methodology (Page No. - 16)
2.1 Secondary Data
2.1.1 Key Data From Secondary Sources
2.2 Primary Data
2.2.1 Key Data From Primary Sources
2.3 Market Size Estimation
2.3.1 Bottom-Up Approach
2.3.2 Top-Down Approach
2.4 Market Breakdown and Data Triangulation
2.5 Assumptions for the Study
3 Executive Summary (Page No. - 23)
4 Premium Insights (Page No. - 27)
4.1 Vitamin D: Market Overview
4.2 North America: Vitamin D Therapy Market, By Route of Administration (2019)
4.3 Geographical Snapshot of the Vitamin D Therapy Market
5 Market Overview (Page No. - 30)
5.1 Introduction
5.2 Market Dynamics
5.2.1 Drivers
5.2.1.1 Growing Awareness About Vitamin D Deficiency Among Consumers
5.2.1.2 Presence of A Large Target Patient Population
5.2.2 Market Opportunities
5.2.2.1 Growth Opportunities in Countries With A High Prevalence of Undernutrition
5.2.3 Market Challenges
5.2.3.1 Fortified Foods
6 Role of Vitamin D in Disease Progression (Page No. - 33)
6.1 Role of Vitamin D in the Prevention and Treatment of Cancer
6.2 Role of Vitamin D in the Prevention and Treatment of Diabetes
6.3 Role of Vitamin D in the Prevention and Treatment of Cardiovascular Diseases
7 Vitamin D Therapy Market, By Route of Administration (Page No. - 35)
7.1 Introduction
7.2 Oral Route of Administration
7.2.1 Oral Route of Administration Likely to Dominate the Vitamin D Therapy Market Due to High Patient Compliance
7.3 Parenteral Route of Administration
7.3.1 Use of Parenterals is Mostly Reserved for Hypovitaminosis D
8 Vitamin D Therapy Market, By Purchasing Pattern (Page No. - 39)
8.1 Introduction
8.2 Prescription Drugs
8.2.1 Growing Hypovitaminosis D Prevalence is Expected to Drive the Prescription Drugs Market
8.3 Over-The-Counter Drugs
8.3.1 Ease of Purchase Leads to People Opting for OTC
9 Vitamin D Therapy Market, By Application (Page No. - 42)
9.1 Introduction
9.2 Osteoporosis
9.2.1 Fractures and Broken Bones Leading to Rise in Vitamin D Therapy Market
9.3 Rickets
9.3.1 Updated Guidelines on Daily Dietary Intake of Vitamin D Likely to Lower Incidence of Rickets
9.4 Muscle Weakness
9.4.1 Evidence Indicates Impact of Vitamin D on Athlete and Injury Profiles
9.5 Autoimmune Disorders
9.5.1 Research is Required to Understand the Role of Vitamin D in Autoimmune Disorders
9.6 Skin Diseases
9.6.1 Immunomodulatory Activity of Vitamin D Likely to Increase the Market for Psoriasis
9.7 Other Applications
10 Vitamin D Therapy Market, By Age Group (Page No. - 49)
10.1 Introduction
10.2 Senior Adults
10.2.1 Increasing Incidence of Osteoporosis Among Senior Adults has Driven Demand for Vitamin D
10.3 Adults
10.3.1 Sedentary Lifestyles are Leading to Hypovitaminosis D Among Adults
10.4 Children
10.4.1 High Prevalence of Rickets Among Children is Driving Market Growth
11 Vitamin D Therapy Market, By Region (Page No. - 53)
11.1 Introduction
11.2 North America
11.2.1 US
11.2.1.1 US to Dominate the North American Vitamin D Therapy Market
11.2.2 Canada
11.2.2.1 Limited Endogenous Synthesis and Limited Dietary Sources are the Major Factors Responsible for Vitamin D Deficiency in the Canadian Population
11.3 Europe
11.3.1 UK
11.3.1.1 Vitamin D Deficiency is Prevalent Among All Age Groups in the UK
11.3.2 Germany
11.3.2.1 High Prevalence of Osteoporosis is Expected to Be the Key Factor Driving Market Growth in Germany
11.3.3 France
11.3.3.1 Vitamin D Levels are Declining in France
11.3.4 Rest of Europe
11.4 Asia Pacific
11.4.1 China
11.4.1.1 Heavy Air Pollution and Sedentary Lifestyles are Driving Market Growth in China
11.4.2 Japan
11.4.2.1 Increasing Incidence of Vitamin D Deficiency in Japan to Drive Market Growth
11.4.3 India
11.4.3.1 A Large Part of India�s Population is Vitamin D-Deficient
11.4.4 Rest of Asia Pacific
11.5 Rest of the World
12 Competitive Landscape (Page No. - 85)
12.1 Overview
12.2 Market Ranking Analysis, 2018
12.3 Key Strategies
12.3.1 Acquisitions and Collaborations, 2015�2018
12.4 Competitive Leadership Mapping (2018)
12.4.1 Visionary Leaders
12.4.2 Innovators
12.4.3 Dynamic Differentiators
12.4.4 Emerging Companies
13 Company Profiles (Page No. - 89)
(Introduction, Products & Services, Strategy, & Analyst Insights, Developments, MnM View)*
13.1 Novartis AG
13.2 Pfizer Inc
13.3 GlaxoSmithKline PLC
13.4 Merck & Co., Inc.
13.5 Abbott
13.6 Sanofi
13.7 Torrent Pharmaceuticals Ltd.
13.8 Sun Pharmaceutical Industries Ltd.
13.9 Alkem Laboratories Ltd.
13.10 Cadila Healthcare Ltd.
*Details on MarketsandMarkets view, Introduction, Product & Services, Strategy, & Analyst Insights, New Developments might not be captured in case of unlisted companies.
14 Appendix (Page No. - 106)
14.1 Insights of Industry Experts
14.2 Discussion Guide
14.3 Knowledge Store: Marketsandmarkets� Subscription Portal
14.4 Available Customizations
14.5 Related Reports
14.6 Author Details
List of Tables (77 Tables)
Table 1 Vitamin D Therapy Market, By Route of Administration, 2017�2024 (USD Million)
Table 2 Market for Oral Route of Administration, By Region, 2017�2024 (USD Million)
Table 3 Market for Parenteral Route of Administration, By Region, 2017�2024 (USD Million)
Table 4 Market, By Purchasing Pattern, 2017�2024 (USD Million)
Table 5 Market for Prescription Drugs, By Region, 2017�2024 (USD Million)
Table 6 Market for OTC Drugs, By Region, 2017�2024 (USD Million)
Table 7 Market, By Application, 2017�2024 (USD Million)
Table 8 Market for Osteoporosis, By Region, 2017�2024 (USD Million)
Table 9 Market for Rickets, By Region, 2017�2024 (USD Million)
Table 10 Market for Muscle Weakness, By Region, 2017�2024 (USD Million)
Table 11 Market for Autoimmune Disorders, By Region, 2017�2024 (USD Million)
Table 12 Market for Skin Diseases, By Region, 2017�2024 (USD Million)
Table 13 Market for Other Applications, By Region, 2017�2024 (USD Million)
Table 14 Market, By Age Group, 2017�2024 (USD Million)
Table 15 Market for Senior Adults, By Region, 2017�2024 (USD Million)
Table 16 Market for Adults, By Region, 2017�2024 (USD Million)
Table 17 Market for Children, By Region, 2017�2024 (USD Million)
Table 18 Market, By Region, 2017�2024 (USD Million)
Table 19 North America: Market, By Country, 2017�2024 (USD Million)
Table 20 North America: Market, By Route of Administration, 2017�2024 (USD Million)
Table 21 North America: Market, By Purchasing Pattern, 2017�2024 (USD Million)
Table 22 North America: Market, By Application, 2017�2024 (USD Million)
Table 23 North America: Market, By Age Group, 2017�2024 (USD Million)
Table 24 US: Market, By Route of Administration, 2017�2024 (USD Million)
Table 25 US: Market, By Purchasing Pattern, 2017�2024 (USD Million)
Table 26 US: Market, By Application, 2017�2024 (USD Million)
Table 27 US: Market, By Age Group, 2017�2024 (USD Million)
Table 28 Canada: Market, By Route of Administration, 2017�2024 (USD Million)
Table 29 Canada: Market, By Purchasing Pattern, 2017�2024 (USD Million)
Table 30 Canada: Market, By Application, 2017�2024 (USD Million)
Table 31 Canada: Market, By Age Group, 2017�2024 (USD Million)
Table 32 Europe: Market, By Country, 2017�2024 (USD Million)
Table 33 Europe: Market, By Route of Administration, 2017�2024 (USD Million)
Table 34 Europe: Market, By Purchasing Pattern, 2017�2024 (USD Million)
Table 35 Europe: Market, By Application, 2017�2024 (USD Million)
Table 36 Europe: Market, By Age Group, 2017�2024 (USD Million)
Table 37 UK: Market, By Route of Administration, 2017�2024 (USD Million)
Table 38 UK: Market, By Purchasing Pattern, 2017�2024 (USD Million)
Table 39 UK: Market, By Application, 2017�2024 (USD Million)
Table 40 UK: Market, By Age Group, 2017�2024 (USD Million)
Table 41 Germany: Market, By Route of Administration, 2017�2024 (USD Million)
Table 42 Germany: Market, By Purchasing Pattern, 2017�2024 (USD Million)
Table 43 Germany: Market, By Application, 2017�2024 (USD Million)
Table 44 Germany: Market, By Age Group, 2017�2024 (USD Million)
Table 45 France: Market, By Route of Administration, 2017�2024 (USD Million)
Table 46 France: Market, By Purchasing Pattern, 2017�2024 (USD Million)
Table 47 France: Market, By Application, 2017�2024 (USD Million)
Table 48 France: Market, By Age Group, 2017�2024 (USD Million)
Table 49 RoE: Market, By Route of Administration, 2017�2024 (USD Million)
Table 50 RoE: Market, By Purchasing Pattern, 2017�2024 (USD Million)
Table 51 RoE: Market, By Application, 2017�2024 (USD Million)
Table 52 RoE: Market, By Age Group, 2017�2024 (USD Million)
Table 53 APAC: Market, By Country, 2017�2024 (USD Million)
Table 54 APAC: Market, By Route of Administration, 2017�2024 (USD Million)
Table 55 APAC: Market, By Purchasing Pattern, 2017�2024 (USD Million)
Table 56 APAC: Market, By Application, 2017�2024 (USD Million)
Table 57 APAC: Market, By Age Group, 2017�2024 (USD Million)
Table 58 China: Market, By Route of Administration, 2017�2024 (USD Million)
Table 59 China: Market, By Purchasing Pattern, 2017�2024 (USD Million)
Table 60 China: Market, By Application, 2017�2024 (USD Million)
Table 61 China: Market, By Age Group, 2017�2024 (USD Million)
Table 62 Japan: Market, By Route of Administration, 2017�2024 (USD Million)
Table 63 Japan: Market, By Purchasing Pattern, 2017�2024 (USD Million)
Table 64 Japan: Market, By Application, 2017�2024 (USD Million)
Table 65 Japan: Market, By Age Group, 2017�2024 (USD Million)
Table 66 India: Market, By Route of Administration, 2017�2024 (USD Million)
Table 67 India: Market, By Purchasing Pattern, 2017�2024 (USD Million)
Table 68 India: Market, By Application, 2017�2024 (USD Million)
Table 69 India: Market, By Age Group, 2017�2024 (USD Million)
Table 70 RoAPAC: Market, By Route of Administration, 2017�2024 (USD Million)
Table 71 RoAPAC: Market, By Purchasing Pattern, 2017�2024 (USD Million)
Table 72 RoAPAC: Market, By Application, 2017�2024 (USD Million)
Table 73 RoAPAC: Market, By Age Group, 2017�2024 (USD Million)
Table 74 RoW: Market, By Route of Administration, 2017�2024 (USD Million)
Table 75 RoW: Market, By Purchasing Pattern, 2017�2024 (USD Million)
Table 76 RoW: Market, By Application, 2017�2024 (USD Million)
Table 77 RoW: Market, By Age Group, 2017�2024 (USD Million)
List of Figures (29 Figures)
Figure 1 Research Design
Figure 2 Breakdown of Primary Interviews: By Company Type, Designation, and Region
Figure 3 Market: Bottom-Up Approach
Figure 4 Market: Top-Down Approach
Figure 5 Data Triangulation Methodology
Figure 6 Market, By Route of Administration, 2019 vs 2024 (USD Million)
Figure 7 Market, By Purchasing Pattern, 2019 vs 2024 (USD Million)
Figure 8 Market, By Application, 2019 vs 2024 (USD Million)
Figure 9 Market, By Age Group, 2019 vs 2024 (USD Million)
Figure 10 Market, By Region, 2019 vs 2024 (USD Million)
Figure 11 Growing Awareness About Vitamin D Deficiency and Large Patient Population to Drive Market Growth During the Forecast Period
Figure 12 Oral Route of Administration to Dominate the North American Vitamin D Therapy Market in 2019
Figure 13 Asian Countries to Register High Growth Rates During the Forecast Period
Figure 14 Vitamin D Therapy Market: Drivers, Opportunities, and Challenges
Figure 15 North America: Vitamin D Therapy Market Snapshot
Figure 16 Asia Pacific: Vitamin D Therapy Market Snapshot
Figure 17 Key Developments in the Vitamin D Therapy Market From 2015 to 2018
Figure 18 Vitamin D Therapy Market Ranking, By Key Player, 2018
Figure 19 MnM Dive-Vendor Comparison Matrix: Vitamin D Therapy Market
Figure 20 Novartis AG: Company Snapshot (2018)
Figure 21 Pfizer Inc.: Company Snapshot (2018)
Figure 22 GlaxoSmithKline PLC: Company Snapshot (2018)
Figure 23 Merck & Co., Inc.: Company Snapshot (2018)
Figure 24 Abbott: Company Snapshot (2018)
Figure 25 Sanofi: Company Snapshot
Figure 26 Torrent: Company Snapshot (2018)
Figure 27 Sun Pharmaceutical Industries Ltd.: Company Snapshot (2018)
Figure 28 Alkem Laboratories Ltd.: Company Snapshot (2018)
Figure 29 Cadila Healthcare Ltd.: Company Snapshot (2018)
The study involved four major activities in estimating the current size of the vitamin D therapy market. Exhaustive secondary research was conducted to collect information on the market and its subsegments. The next step was to validate these findings, assumptions, and sizing estimates with industry experts across the value chain through primary research. Both top-down and bottom-up approaches were employed to estimate the complete market size. Thereafter, market breakdown and data triangulation procedures were used to estimate the market size of segments and subsegments.
Secondary Research
In the secondary research process, various secondary sources such as annual reports, press releases & investor presentations of companies, white papers, certified publications, articles by recognized authors, gold-standard & silver-standard websites, regulatory bodies, and databases (such as D&B Hoovers, Bloomberg Business, and Factiva) were referred to in order to identify and collect information for this study.
Primary Research
Several stakeholders such as vitamin D manufacturers, vendors, distributors, endocrinologists, pediatricians, gynecologists, and general physicians were consulted for this report. The demand side of this market is characterized by the significant use of vitamin D due to increasing hospital visits by patients with associated disorders like osteoporosis. The supply side of this market is characterized by the high prevalence of hypovitaminosis D globally. Various primary sources from both the supply and demand sides of the market were interviewed to obtain qualitative and quantitative information. The following is a breakdown of the primary respondents:
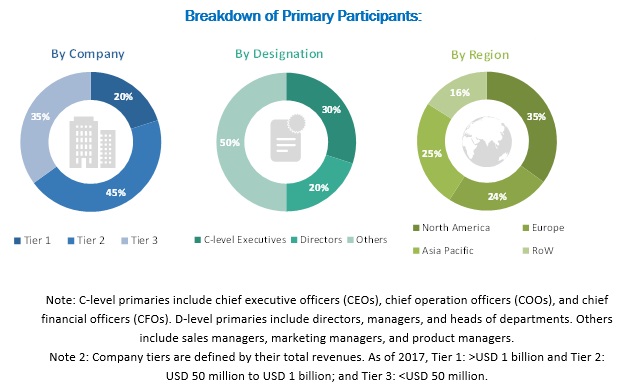
To know about the assumptions considered for the study, download the pdf brochure
Market Size Estimation
Both top-down and bottom-up approaches were used to estimate and validate the total size of the vitamin D therapy market. These methods were also used extensively to estimate the size of various subsegments in the market. The research methodology used includes the following:
- The key players in the industry and markets have been identified through extensive secondary research
- The industry�s supply chain and market size, in terms of value, have been determined through primary and secondary research
- All percentage shares, splits, and breakdowns have been determined using secondary sources and verified through primary sources
Data Triangulation
After arriving at the overall market size�using the market size estimation processes�the market was split into several segments and subsegments. To complete the overall market engineering process and arrive at the exact statistics of each market segment and subsegment, the data triangulation and market breakdown procedures were employed, wherever applicable. The data was triangulated by studying various factors and trends from both the demand and supply sides in the vitamin D industry.
Report Objectives
- To define, describe, and forecast the vitamin D therapy market on the basis of route of administration, purchasing pattern, application, age group, and region
- To forecast the revenue of the market segments with respect to four main regional segments, namely, North America, Europe, Asia Pacific, and the Rest of the World (RoW)
- To identify the micromarkets with respect to the drivers, industry-specific challenges, opportunities, and trends affecting the growth of the market
- To analyze the market segments and subsegments with respect to individual growth trends, prospects, and contributions to the overall market
- To analyze the opportunities in the market for stakeholders and provide details of the competitive landscape for market leaders
- To profile the key players and comprehensively analyze their market shares and core competencies, in terms of market developments and growth strategies
- To track and analyze competitive developments such as partnerships, agreements, collaborations, acquisitions, product launches, and R&D activities in the vitamin D therapy market
Available Customizations:
With the given market data, MarketsandMarkets offers customizations as per the company�s specific needs. The following customization options are available for the report:
- Product Analysis: Product matrix, which gives a detailed comparison of the product portfolios of each company
- Geographic Analysis: Further breakdown of the European, Asia Pacific, and RoW regional segments into their respective countries for this market
- Company Information: Detailed analysis and profiling of additional market players (up to 5)
- Volume Data: Customization options for volume data (number of units sold) and customization options for volume data (number of tests)
- Opportunities Assessment: A detailed report underlining the various growth opportunities presented in the market

 Generating Response ...


Growth opportunities and latent adjacency in Vitamin D Therapy Market