Water Automation and Instrumentation Market by Process stage (Collection, Treatment and Distribution), Automation Technology, Instrumentation, End user Application and Geography - Analysis & Forecast (2014 - 2020)


The present water shortage, decreasing water quality, and increasing processing supply and cost are the concerning factors for automation in the waterindustry. Hence, the events related to the water treatment, intake, distribution and transmission are important. Instrumentation, control, and automation therefore, are the key technologies for modern water and waste water systems in the water industry. Purification and waste water management take place with different technologies, instruments, and treatments.
The Americas is the major market for water automation and instrumentation industry; however, Asia-Pacific is expected to grow at the highest CAGR of 12.07% from 2014 to 2020.The process stage market for water automation and instrumentation industry can be divided into collection, treatment, and distribution. The treatment market accounts for a better share compared to collection and distribution markets.
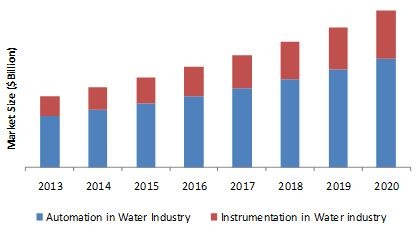
The report provides the profile of all major companies in the water automation and instrumentation industry. The report provides the competitive landscape of the key players, which indicate the growth strategy of the market. The report also covers the entire value chain for the market from the raw material supplier to the end user. Along with the value chain, this report also provides an in-depth view on the process stage, automation technology, instrumentation, end user application and the drivers and restraints for water automation and instrumentation industry. The water automation and instrumentation market is estimated to reach $17.73 billion by 2020, at a CAGR of 11.75% from 2014 to 2020.
The report also provides the water automation and instrumentation market dynamics such as drivers, restraints, and opportunities. Apart from the market segmentation, the report also includes the critical market data and qualitative information for each product type along with the qualitative analysis, such as the Porter�s five force analysis, value chain analysis, and market crackdown analysis.
The major players in water automation and instrumentation market are General Electric (U.S.), Siemens AG (Germany), ABB (Switzerland), Emersion Electric (US), Rockwell Automation (US) among others.
Market by process stage:
The process stage market for water automation and instrumentation industry includes collection, treatment, and distribution of water.
Market by automation technology:
The technologies used in this market are distributed control system, supervisory control and data acquisition, programmable logic controller, human machine interface, manufacturing execution systems, identity & access management, and laboratory information management system.
Market by instrumentation:
The instrumentation market for water automation and instrumentation water industry consists of pressure transmitter, level transmitter, temperature transmitter, electromagnetic flowmeters, sludge density measurement, gas and liquid analyzer, leakage detection systems, control valves, and high & low ACdrives.
Market by end user application:
The major end user applications of water automation and instrumentation industry are drinking, household, commercial, industrial water, and others.
Market by geography:
The market is segmented by geography into four different regions; namely Americas, Europe, Middle East, APAC, and Africa.
Automation and instrumentation is the basis of most of the advanced control techniques that exist in the modern industry. It is through the further growthof automation and instrumentation that the industry, as a whole, will address the current challenges that it faces and move forward into the future. The global market for water automation and instrumentation industry is primarily driven by the increasing water scarcity and growing complexity of water management in water utilities and plants.
In this report, an in-depth market analysis has been drawn to craft a vision for automated water network solutions and their potential benefits for utilities and their stakeholders. With growing advancements in technologies, the future of automation and instrumentation of water networks is expected to rely on partnerships between the people and technology to address water scarcity.
This report on the automation and instrumentation market in the water industry aims to feature the summation of equipment, components, systems, OEMs, and contractor services involved across the value chain in the industry. This report also aims to capture the industry roadmap with regards to the market sizein terms of value and volumemarket dynamics, applications and product trends, geographic analysis, and price trends.
The report is segmented into process stage, automation technology, instrumentation, end-user application and geography; each of these segments is further divided into sub-segments.The total market size of the collection process for water automation and instrumentation industry is expected to reach $17.73billion by2020 atan estimated CAGR of 11.75% from 2014 to 2020.
Some of the major players in the market are Schneider Electric Corp (France), Pepperl+Fuchs (U.S.), Rockwell Automation (U.S.), ABB (Switzerland), CH2M HILL (U.S.), Emerson Electric Company (U.S.), Endress+Hauser Consult AG (Switzerland), General Electric (GE)(U.S.), Mitsubishi Electric Corp (Japan), Siemens (U.S.), and Yokogawa Electric Corporation (Japan).
Water Automation and Instrumentation Market (2013-2020)
 Exclusive indicates content/data unique to MarketsandMarkets and not available with any competitors.
Table Of Contents
1 Introduction (Page No. - 19)
1.1 Objectives
1.2 Report Description
1.3 Markets Covered
1.4 Stakeholders
1.5 Research Methodology
1.5.1 Market Size
1.5.2 Key Data Taken From Secondary Sources
1.5.3 Key Data Taken From Primary Sources
1.5.4 Assumptions Made For This Report
1.5.5 List of Companies Covered During Primaries
2 Executive Summary (Page No. - 30)
3 Cover Story: Expert Interview (Page No. - 33)
4 Market Overview (Page No. - 38)
4.1 Market Definition
4.2 Evolution of Process Automation
4.3 Market Dynamics
4.3.1 Market Drivers
4.3.1.1 Need for A Smart Water System Due To Water Scarcity
4.3.1.2 The Need of Automated Processing Systems Due To the Growing Complexities In The Water System
4.3.1.3 Growing Investments in Infrastructure through Public And Private Partnerships
4.3.1.4 Increasing Labor Wages Expected To Drive the Process Automation Landscape
4.3.2 Restraints
4.3.2.1 Slow Growth In The Saturated Markets: A Cause Of Concern Among The Suppliers
4.3.2.2 The Lack of Talent Is Expected To Negatively Impact The Market
4.3.3 Opportunities
4.3.3.1 The Emerging Economies Present Tremendous Growth Opportunities
4.4 Burning Issue
4.4.1 Cyber Threat: A Major Vulnerability to the Automated Systems
4.5 Winning Imperatives
4.5.1 Improved Customer Service Is Pivotal For the Water Automation and Instrumentation Market
4.5.2 Implementation of The Latest It And Telecom Infrastructure Within The Water Automation System Will Be A Game Changer
4.6 Value Chain Analysis
4.7 Porter�s Five Force Analysis
4.7.1 Threats of New Entrants
4.7.2 Threats from Substitutes
4.7.3 Bargaining Power of Suppliers
4.7.4 Bargaining Power of Buyers
4.7.5 Degree of Competition
5 Market By Process Stage (Page No. - 64)
5.1 Introduction
5.2 Collection of Water
5.2.1 Wireless Monitoring Of Wastewater Collection System
5.3 Treatment of Water
5.3.1 Application of Process Automation In Water/Wastewater Management
5.4 Distribution of Water
5.4.1 Dead End System
5.4.2 Radial System
5.4.3 Grid System
5.4.4 Ring System
5.4.5 Method of Water Distribution
5.4.5.1 Gravity System
5.4.5.2 Pumping System
5.4.5.3 Combined System
5.4.5.4 Application of Process Automation In Water Distribution System
6 Market By Automation Technology (Page No. - 77)
6.1 Introduction
6.2 Distributed Control System (DCS)
6.3 Supervisory Control and Data Acquisition (SCADA)
6.4 Programmable Logic Controller (PLC)
6.5 Human Machine Interface (HMI)
6.6 Manufacturing Execution Systems (MES)
6.7 Identity & Access Management (IAM)
6.8 Laboratory Information Management System (LIMS)
7 Market By Instrumentation (Page No. - 106)
7.1 Introduction
7.2 Pressure Transmitter
7.3 Level Transmitter
7.3.1 Hydrostatic Operating Principle
7.3.2 Ultrasonic Operating Principle
7.3.3 Capacitive Operation
7.3.4 Guided Wave Radar
7.4 Electromagnetic Flow meters
7.5 Sludge Density Measurement
7.6 Gas and Liquid Analyzer
7.7 Leakage Detection Systems
7.8 Control Valves
7.9 High And Low Ac Drives
7.10 Others
8 Market By End-User Application (Page No. - 139)
8.1 Introduction
8.2 Drinking Water
8.3 Household Water (Other Than Drinking Water)
8.4 Commercial Water
8.5 Industrial Water
8.6 Agriculture
8.7 Others
9 Market By Geography (Page No. - 162)
9.1 Introduction
9.2 Americas
9.2.1 North America
9.2.1.1 U.S.
9.2.1.2 Canada
9.2.1.3 Mexico
9.2.2 South America
9.3 Europe
9.3.1 Germany
9.3.2 U.K.
9.3.3 France
9.3.4 Italy
9.4 APAC
9.4.1 Australia
9.4.2 China
9.4.3 Japan
9.4.4 South Korea
9.4.5 India
9.5 Middle East
9.5.1 Egypt
9.5.2 Kuwait
9.5.3 Qatar
9.5.4 Saudi Arabia
9.5.5 United Arab emirates
9.6 Africa
10 Competitive Landscapes (Page No. - 193)
10.1 Introduction
10.1.1 Key Growth Strategies
10.1.2 Major Companies and Their Rankings
10.1.3 New Product Developments in Automation and Instrumentation In Water Industry
10.1.4 Contracts in Automation and Instrumentation In Water Industry Market
10.1.5 Partnerships and Collaborations in Automation And Instrumentation In Water Industry Market
10.1.6 Acquisitions in Automation and Instrumentation In Water Industry Market
10.1.7 Business Expansion in Automation and Instrumentation In Water Industry Market
10.1.8 Others (Awards, Recognitions, Certifications And Up gradation) In Automation And Instrumentation In Water Industry Market
11 Company Profiles (Overview, Products and Services, Financials, Strategy & Development)* (Page No. - 210)
11.1 ABB Ltd.
11.2 Ch2m Hill Inc.
11.3 Emerson Electric Co.
11.4 Endress+Hauser AG
11.5 General Electric
11.6 Mitsubishi Electric Corp
11.7 Pepperl+Fuchs
11.8 Rockwell Automation Inc.
11.9 Siemens AG
11.10 Yokogawa Electric Corporation
*Details On Overview, Products And Services, Financials, Strategy & Development Might Not Be Captured In Case Of Unlisted Companies.
List Of Tables (88 Tables)
Table 1 Impact Analysis of Market Drivers
Table 2 Impact Analysis of Market Restraints
Table 3 Automation and Instrumentation In Water Industry Market Size, By Process Stage, 2012-2020 ($Million)
Table 4 Collection: Automation And Instrumentation In Water Industry Market Size, By Automation Technology,2012-2020 ($Million)
Table 5 Treatment: Automation And Instrumentation In Water Industry Market Size, By Automation Technology,2012-2020 ($Million)
Table 6 Distribution: Automation And Instrumentation In Water Industry Market Size, By Automation Technology,2012-2020 ($Million)
Table 7 Automation in Water Industry Market Size, By Technology, 2012-2020 ($Million)
Table 8 DCS: Automation In Water Industry Market Size, By End User Application, 2012-2020 ($Million)
Table 9 DCS: Automation In Water Industry Market Size, By Geography, 2012-2020 ($Million)
Table 10 Types of SCADA Architectures
Table 11 SCADA: Automation In Water Industry Market Size, By End User Application, 2012-2020 ($Million)
Table 12 SCADA: Automation in Water Industry Market Size, By Geography, 2012-2020 ($Million)
Table 13 PLC: Automation in Water Industry Market Size, By End User Application, 2012-2020 ($Million)
Table 14 PLC: Automation in Water Industry Market Size, By Geography, 2012-2020 ($Million)
Table 15 HMI: Automation in Water Industry Market Size, By End User Application, 2012-2020 ($Million)
Table 16 HMI: Automation in Water Industry Market Size, By Geography, 2012-2020 ($Million)
Table 17 MES: Automation in Water Industry Market Size, By End User Application, 2012-2020 ($Million)
Table 18 MES: Automation in Water Industry Market Size, By Geography, 2012-2020 ($Million)
Table 19 IAM: Automation in Water Industry Market Size, By End User Application, 2012-2020 ($Million)
Table 20 IAM: Automation in Water Industry Market Size, By Geography, 2012-2020 ($Million)
Table 21 LIMS: Automation in Water Industry Market Size, By End User Application, 2012-2020 ($Million)
Table 22 LIMS: Automation in Water Industry Market Size, By Geography, 2012-2020 ($Million)
Table 23 Instrumentation in Water Industry Market Size, By Instrumentation, 2012-2020 ($Million)
Table 24 Pressure Transmitter: Water Instrumentation Industry Market Size, By End User Application, 2012-2020 ($Million)
Table 25 Pressure Transmitter: Water Instrumentation Industry Market Size, By Geography, 2012-2020 ($Million)
Table 26 Level Transmitter: Water Instrumentation Industry Market Size, By End User Application, 2012-2020 ($Million)
Table 27 Level Transmitter: Water Instrumentation Industry Market Size, By Geography, 2012-2020 ($Million)
Table 28 Advantages and Disadvantages of Hydrostatic Pressure
Table 29 Advantages and Disadvantages of Ultrasonic
Table 30 Advantages and Disadvantages of Capacitive
Table 31 Advantages and Disadvantages of Guided Wave Radar
Table 32 Electromagnetic Flow meter: Water Instrumentation Industry Market Size, By End User Application,2012-2020 ($Million)
Table 33 Electromagnetic Flow meter: Water Instrumentation Industry Market Size, By Geography, 2012-2020 ($Million)
Table 34 Sludge Density Measurement: Water Instrumentation Industry Market Size, By End User Application,2012-2020 ($Million)
Table 35 Sludge Density Measurement: Water Instrumentation Industry Market Size, By Geography, 2012-2020 ($Million)
Table 36 Gas and Liquid Analyzer: Water Instrumentation Industry Market Size, By End User Application, 2012-2020 ($Million)
Table 37 Gas and Liquid Analyzer: Automation And Instrumentation In Water Industry Market Size, Geography, 2012-2020 ($Million)
Table 38 Leakage Detection Systems: Water Instrumentation Industry Market Size, By End User Application, 2012-2020 ($Million)
Table 39 Leakage Detection Systems: Water Instrumentation Industry Market Size, By Geography, 2012-2020 ($Million)
Table 40 Control Valves: Water Instrumentation Industry Market Size, By End User Application, 2012-2020 ($Million)
Table 41 Control Valves: Automation and Instrumentation In Water Industry Market Size, By Geography, 2012-2020 ($Million)
Table 42 High & Low Ac Drives: Instrumentation in Water Industry Market Size, By End User Application, 2012-2020 ($Million)
Table 43 High & Low Ac Drives: Automation And Instrumentation In Water Industry Market Size, By Application,2012-2020 ($Million)
Table 44 Others: Automation and Instrumentation In Water Industry Market Size, By End User Application, 2012-2020 ($Million)
Table 45 Others: Automation and Instrumentation In Water Industry Market Size, By Geography, 2012-2020 ($Million)
Table 46 Automation and Instrumentation In Water Industry Market Size, By End User Application, 2012-2020 ($Million)
Table 47 Automation in Water Industry Market Size, By End User Application, 2012-2020 ($Million)
Table 48 Instrumentation in Water Industry Market Size, By End User Application, 2012-2020 ($Million)
Table 49 Drinking Water: Automation in Water Industry Market Size, By Geography, 2012-2020 ($Million)
Table 50 Drinking Water: Instrumentation In Water Industry Market Size, By Geography, 2012-2020 ($Million)
Table 51 Household: Automation in Water Industry Market Size, By Geography, 2012-2020 ($Million)
Table 52 Household: Instrumentation in Water Industry Market Size, By Geography, 2012-2020 ($Million)
Table 53 Commercial: Automation in Water Industry Market Size, By Geography, 2012-2020 ($Million)
Table 54 Commercial: Instrumentation in Water Industry Market Size, By Geography, 2012-2020 ($Million)
Table 55 Water Usage in Industrial Applications
Table 56 Industrial: Automation In Water Industry Market Size, By Geography, 2012-2020 ($Million)
Table 57 Industrial: Instrumentation in Water Industry Market Size, By Geography, 2012-2020 ($Million)
Table 58 Agriculture: Automation in Water Industry Market Size, By Geography, 2012-2020 ($Million)
Table 59 Agriculture: Instrumentation in Water Industry Market Size, By Geography, 2012-2020 ($Million)
Table 60 Others: Automation in Water Industry Market Size, By Geography, 2012-2020 ($Million)
Table 61 Others: Instrumentation in Water Industry Market Size, By Geography, 2012-2020 ($Million)
Table 62 Automation and Instrumentation in Water Industry Market Size, By Geography, 2012-2020 ($Million)
Table 63 Automation in Water Industry Market Size, By Geography, 2012-2020 ($Million)
Table 64 Instrumentation in Water Industry Market Size, By Geography 2012-2020 ($Million)
Table 65 Americas: Automation in Water Industry Market Size, By Region, 2012-2020 ($Million)
Table 66 Americas: Automation in Water Industry Market Size, By Country, 2012-2020 ($Million)
Table 67 Americas: Instrumentation in Water Industry Market Size, By Region, 2012-2020 ($Million)
Table 68 Americas: Instrumentation in Water Industry Market Size, By Country, 2012-2020 ($Million)
Table 69 Latin America�s Five Largest Wastewater Treatment Plant Projects
Table 70 Americas: Automation in Water Industry Market Size, By Country, 2012-2020 ($Million)
Table 71 Americas: Instrumentation in Water Industry Market Size, By Region, 2012-2020 ($Million)
Table 72 Americas: Instrumentation in Water Industry Market Size, By Country, 2012-2020 ($Million)
Table 73 Europe: Automation in Water Industry Market Size, By Country, 2012-2020 ($Million)
Table 74 Europe: Instrumentation in Water Industry Market Size, By Country, 2012-2020 ($Million)
Table 75 APAC: Instrumentation in Water Industry Market Size, By Country, 2012-2020 ($Million)
Table 76 APAC: Automation in Water Industry Market Size, By Country, 2012-2020 ($Million)
Table 77 Middle East: Automation in Water Industry Market Size, By Country, 2012-2020 ($Million)
Table 78 Middle East: Instrumentation in Water Industry Market Size, By Country, 2012-2020 ($Million)
Table 79 Africa: Automation in Water Industry Market Size, By Country, 2012-2020 ($Million)
Table 80 Africa: Instrumentation in Water Industry Market Size, By Country, 2012-2020 ($Million)
Table 81 Market Rankings of Key Players 2013 ($Billion)
Table 82 New Product Developments
Table 83 Contracts
Table 84 Partnerships and Collaborations
Table 85 Acquisitions
Table 86 Business Expansion
Table 87 Others (Awards, Recognitions, Certifications And Up gradation)
Table 88 Pepperl+Fuchs: Company Snapshot
List Of Figures (66 Figures)
Figure 1 Automation and Instrumentation In Water Industry Market Segmentation
Figure 2 Steps in Research Methodology
Figure 3 Automation and Instrumentation In Water Industry: Market Research Strategy
Figure 4 Automation and Instrumentation In Water Industry: Market Crackdown Strategy
Figure 5 Automation and Instrumentation Market In Water Industry 2013-2020 ($Billion)
Figure 6 Evolutions of Production Control Systems for Process Automation
Figure 7 Wastewater Treatment Process
Figure 8 Automation and Instrumentation Market in The Water Industry: Segmentation
Figure 9 Automation and Instrumentation Market in Water Industry: Value Chain
Figure 10 Automation And Instrumentation Market In Water Industry: Porter�s Five Force Analysis
Figure 11 Porter�s Five Force Analysis: Threats of New Entrants
Figure 12 Porter�s Five Force Analysis: Threats from Substitutes
Figure 13 Porter�s Five Force Analysis: Bargaining Power of Supplier S
Figure 14 Porter�s Five Force Analysis: Bargaining Power of Buyers
Figure 15 Porter�s Five Force Analysis: Degree of Competition
Figure 16 Market Segmentation by Process Stage
Figure 17 Wastewater Treatment Method
Figure 18 Type Of Water Distribution Systems
Figure 19 Type Of Water Distribution Systems
Figure 20 Market Segmentation: By Automation Technology
Figure 21 Automated Systems In Industrial It Infrastructure
Figure 22 Basic SCADA Architecture
Figure 23 Basic MES Architecture
Figure 24 Identity & Access Management System
Figure 25 Market Segmentation: By Instrumentation
Figure 26 Operation Principles for Level Measurement Techniques
Figure 27 Types of Automatic Control Valves
Figure 28 Market Segmentation � By End User Application
Figure 29 Global & Region Market Analysis: Water Automation and Instrumentation Market
Figure 30 Automation And Instrumentation In Water Industry Market, By Geography
Figure 31 Americas Automation And Instrumentation Market In Water Industry, By Region
Figure 32 North America: Automation and Instrumentation Market In Water Industry, By Country
Figure 33 Europe Automation And Instrumentation Market in Water Industry, By Country
Figure 34 APAC Automation And Instrumentation in Water Industry Market by Country
Figure 35 Middle East Automation And Instrumentation in Water Industry Market by Country
Figure 36 Automation and Instrumentation in Water Industry: Competitive Landscape
Figure 37 Key Growth Strategies in Automation and Instrumentation in Water Industry
Figure 38 ABB Ltd.: Company Snapshot
Figure 39 ABB Ltd.: Product Portfolio
Figure 40 Ch2m Hill Inc: Company Snapshot
Figure 41 Ch2m Hill Inc.: Product Portfolio
Figure 42 Ch2mhill Inc: Operating Segments
Figure 43 Emerson Electric Co.: Company Snapshot
Figure 44 Emerson Electric Co.: Markets Served
Figure 45 Emerson Process Management: Products & Services Portfolio
Figure 46 Emerson Electric Co.: SWOT Analysis
Figure 47 Endress+Hauser Ag: Company Snapshot
Figure 48 Endress+Hauser Ag: Product Portfolio
Figure 49 General Electric: Company Snapshot
Figure 50 General Electric: Products And Services
Figure 51 GE Water and Process Technologies: Product Portfolio
Figure 52 GE Water and Process Technologies: SWOT Analysis
Figure 53 Mitsubishi Electric Corp: Company Snapshot
Figure 54 Mitsubishi Electric Corp: Products & Services
Figure 55 Mitsubishi Electric Corp: SWOT Analysis
Figure 56 Pepperl+Fuchs: Product Portfolio
Figure 57 Rockwell Automation Inc: Company Snapshot
Figure 58 Rockwell Automation Inc: Products and Services Portfolio
Figure 59 Rockwell Automation Inc: SWOT Analysis
Figure 60 Siemens AG: Company Snapshot
Figure 61 Siemens AG: Operating Segments
Figure 62 Siemens AG: Operating Segments
Figure 63 Siemens AG: SWOT Analysis
Figure 64 Yokogawa Electric Corporation: Company Snapshot
Figure 65 Yokogawa Electric Corporation: Products and Services Portfolio
Figure 66 Yokogawa Electric Corporation: Operating Segments


Growth opportunities and latent adjacency in Water Automation and Instrumentation Market
Rationalization for investment in product development.