Wearable Fitness Technology Market by Product (Smartwatch, Wristband (Bracelet), Shoe, Shirt, Headband), Category (Handwear, Torsowear, Legwear, Headwear), Component (Display, Processor, Memory, Power, Networking, Interface, Sensor) - Global Forecast to 2022


[163 Pages Report] The wearable fitness technology market was worth USD 5.77 billion in 2016 and USD 12.44 billion by 2022, growing at a CAGR of 13.7% from 2016 to 2022. The market is likely to witness rapid growth in the coming years driven by consumer preference for sophisticated gadgets, increasing popularity of wearable fitness and medical devices, growing popularity of the Internet of things, increasing awareness about fitness and rise in disposable incomes in developing economies.
Major trends in the wearable fitness technology market include smartphone applications (apps) and advanced data analysis, advanced sensors, integration and implantation of technology with and in the human body, and specific-purpose wearables. Companies are developing advanced apps with advanced data analysis features. Companies may charge monthly subscription fees for premium data analysis and reports. Also, they are focused on developing advanced sensors that track not only accurate metrics but also qualitative attributes such as stress level and athletic performance. In the future, wearable fitness technology would make a way to the development of implanted technology which will have complete integration and implantation with and in a human body.
Fitness technology has evolved significantly with the advent of wearable technology products such as smartwatches and wristbands. Wearable fitness technology has gone beyond just smartwatches and wristbands with new products such as smart shoes, smart apparels, headbands and more. This growth is largely driven by the popularity of wristwears such as wristbands and smartwatches.
MARKET DYNAMICS
Drivers
- Consumer preference for smart gadgets
- Increasing popularity of wearable fitness and medical devices
- Increasing awareness about fitness and rise in disposable income in developing economies
Restraints
- Power consumption and limited battery life of wearable devices
- High initial and production costs
- Fast-paced development in the electronics industry
Opportunities
- Use of smart textiles and e-textiles in wearable fitness devices
- Development of key enabling technologies
- Increasing demand for connected devices
Challenges
- Dimension constraints
- Failure to achieve long-term engagement
- Unaddressed regulatory issues
Report Objectives:
The base year considered for the study is 2015; estimated year is 2016 and the forecast period is from 2017 to 2022. The objective of the report is to provide a detailed analysis of the global wearable fitness technology market by products, product categories, components, and geography. The report provides detailed information regarding the major factors influencing the growth of the market.
The wearable fitness technology market is expected to be worth USD 12.44 billion by 2022, growing at a CAGR of 13.7% during the forecast period. Some of the major growth drivers for this market would be consumer preference for smart gadgets, increasing popularity of wearable fitness and medical devices, increasing awareness about fitness and rise in disposable income in developing economies.
Among all products, smartwatch are expected to account for the largest market share as well as the highest CAGR during the forecast period. Smartwatch has captured more than one third of the total wearable fitness technology market, because smartwatch provided many additional features other than fitness tracking such as text messaging,, answering call, social media, and music. Smartwatch provides all features of wristband along with many other features, thus it is expected that more consumer would prefer smartwatches over wristbands in future. In the last few years, their market has improved and companies such as Apple Inc. (U.S.) and Samsung Electronics Co., Ltd. (South Korea) have come up with successful introductions of such devices.
Display are expected to account for major shares of the overall wearable fitness technology market during the forecast period. Display being the most expensive part of the wearable devices, its market in wearable fitness technology larger than other components. Also, display technology is evolving day by day, and new technologies such as organic light-emitting diode (OLED), active-matrix organic light-emitting diode (AMOLED), tactile/haptic touch, and more are being incorporated in new products by companies. The demand for displays has grown over the past few years, customized to the needs of wearables, such as wearable-based augmented reality, heads-up display (HUD), heads-mounted display (HMD), holographic display, and so on. Another interesting development in the wearable display is Microsoft’s (U.S.) “Project Glass” which was launched in late 2014; it is an augmented reality glass, featuring an HUD that is expected to change the outlook of playing online games and watching online events.
Smartwatch, wristband, and smart shirts/jackets to drive market growth
Smartwatch
Smartwatches and other wrist wearable computing devices have been around for quite some time. Often, the market has anticipated the launch of smart watches and wrist wearable devices which are sophisticated and sleek, but they have mostly gone in vain. Of all the gadgets that have ever failed to take off, smart watches are among the most unsuccessful ones. Microsoft Corporation’s (U.S.) SPOT watches and Fossil Inc.’s (U.S.) Palm OS-based Wrist Personal Digital Assistant (PDA) are some of the examples which failed to capture a large market size. However, in the last few years, their market has improved and companies such as Apple Inc. (U.S.) and Samsung Electronics Co., Ltd. (South Korea) have come up with successful introductions of such devices. Wearable computing devices run on a modified version of the Android operating system with a 667-MHz CPU and up to 32GB of storage. It also has other specifications such as GPS, Bluetooth, Wi-Fi, accelerometer, activity tracker, and magnetometer. The device comes preloaded with several apps, and additional apps can also be downloaded from the micro app store or loaded over USB.
Wristband (Smart Bracelet)
Smart wrist bands or bracelets not only enhance the aesthetic sense but are also used as fitness devices, monitoring the wearer’s heart rate and other metrics. A number of smart wristbands have hit the market in recent years such as Nike FuelBand, Jawbone’s UP, Fitbit’s Flex among others. Wristbands measure time, heart rate, calories, and steps with the help of an accelerometer to measure movement. Some of the wristbands use galvanic skin response (GSR) sensors to measure the body temperature and the amount of heat that has dissipated from the body to determine the amount of energy used. In August 2014, the U.S. Patent and Trademark Office (USPTO) granted 58 new patents to Apple, Inc. (U.S.) for a wireless communication technology that could be used with medical wristbands. This patent is for the invention that has the ability to collect and use microwave energy gathered through an antenna, while also wirelessly communicating with other devices such as smartphones and tablets.
Smart shirts/jackets
Fabrics and clothes are being transformed into wearable technology products because of the advancements in the field of textiles and electronics. Smart textiles with embedded electronics have already hit the market for display-embedded shirts and gowns. E-textile, with electronics in textile itself, is being commercialized. Many events showcasing fashion and electronics such as the 6th International Conference on the Future Technical Textile, 2014 hosted at Istanbul, Turkey, and the Smart Textiles, and Fashion Track, 2015 held at London, U.K. have shown promising developments. Such events help promote the emerging trend of techno-fashion clothing that gets an electrifying makeover; the clothing that brings electronics closer to skin.
Textile-integrated sensors have the potential to equip everyday clothes with smart capabilities, making the detection of body movements accessible during normal life activities. This solution records variables directly related to a wearer’s needs such as comfort and awareness that must be prioritized equally with the accuracy and precision of the sensor data.
Sensors are already being used in clothing lines and innerwear such as heart rate monitoring sports bra and heated underwear. These sensors in the fabric pick up heartbeats, pulse rate, and other fitness and medical metrics and relay it to the transmitter.
Critical questions would be:
- Where will all these developments take the industry in mid- to long-term?
- Will the suppliers continue to explore new avenues for wearable fitness technology?
Key restraining factors for the market’s growth are power consumption and limited battery life of wearable devices, high initial and production costs, and fast-paced development in the electronics industry. Dimension constraints, failure to achieve long-term engagement, and unaddressed regulatory issues is as a major challenge for the growth of the market.
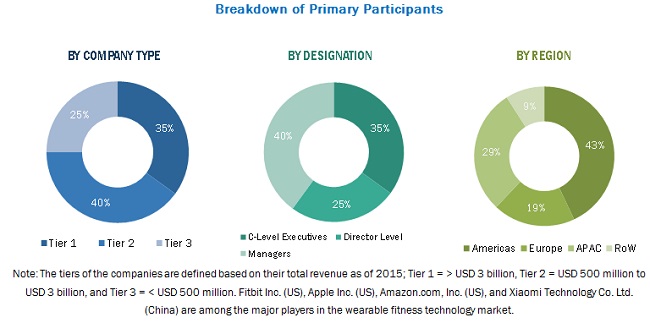
Some of the major companies operating in the global wearable fitness technology market are Adidas AG (Germany), Apple Inc. (U.S.), Fitbit Inc. (U.S.), Garmin Ltd. (Switzerland), Google Inc. (U.S.), Jawbone Inc. (U.S.), LG Electronics Inc. (South Korea), Nike Inc. (U.S.), Pebble Technology Corp. (U.S.), Qualcomm Inc. (U.S.), Samsung Electronics Co. Ltd. (South Korea), Sony Corp. (Japan), and Xiaomi Technology Co. Ltd. (China).
To speak to our analyst for a discussion on the above findings, click Speak to Analyst
 Exclusive indicates content/data unique to MarketsandMarkets and not available with any competitors.
Table of Contents
1 Introduction (Page No. - 14)
1.1 Objectives of the Study
1.2 Market Definition
1.3 Market Scope
1.3.1 Markets Covered
1.3.2 Years Considered for the Study
1.4 Currency
1.5 Limitations
1.6 Market Stakeholders
2 Research Methodology (Page No. - 17)
2.1 Introduction
2.1.1 Secondary Data
2.1.1.1 Key Data From Secondary Sources
2.1.2 Primary Data
2.1.2.1 Key Data From Primary Sources
2.1.2.2 Key Industry Insights
2.1.2.3 Breakdown of Primary Interviews
2.2 Factor Analysis
2.2.1 Introduction
2.2.2 Demand-Side Analysis
2.2.2.1 Large Growth of the Smartphones Market
2.2.3 Supply-Side Analysis
2.2.3.1 Innovation in Technology
2.3 Market Size Estimation
2.3.1 Bottom-Up Approach
2.3.2 Top-Down Approach
2.4 Market Breakdown and Data Triangulation
2.5 Assumptions of the Study
3 Executive Summary (Page No. - 27)
4 Premium Insights (Page No. - 31)
4.1 Wearable Fitness Technology Market Opportunities
4.2 Market, By Product Category
4.3 Geographic Snapshot of the Market
4.4 Market, By Component, 2014–2022 (USD Million)
4.5 Market, By Geography, 2016 vs. 2020 (USD Million)
5 Market Overview (Page No. - 35)
5.1 Introduction
5.2 Wearable Fitness Technology Market Segmentation
5.2.1 Market, By Product
5.2.2 Market, By Product Category
5.2.3 Market, By Component
5.2.4 Market, By Geography
5.3 Market Evolution
5.3.1 Events in the Wearable Fitness Technology Market Till 2000
5.3.2 Wearable 2.0
5.3.3 Next-Generation Wearable Devices
5.4 Market Dynamics
5.4.1 Drivers
5.4.1.1 Consumer Preference Towards Smart Gadgets
5.4.1.2 Increasing Demand for Wearable Fitness and Medical Devices
5.4.1.3 Increasing Awareness About Fitness and Rise in Disposable Incomes in Developing Economies
5.4.2 Restraints
5.4.2.1 Power Consumption and Limited Battery Life of Wearable Devices
5.4.2.2 High Initial and Production Costs
5.4.2.3 Fast-Paced Development in the Electronics Industry
5.4.3 Opportunities
5.4.3.1 Use of Smart Textiles and E-Textiles in Wearable Fitness Devices
5.4.3.2 Development of Key Enabling Technologies
5.4.3.3 Increasing Demand for Connected Devices
5.4.4 Challenges
5.4.4.1 Dimension Constraints
5.4.4.2 Failure to Achieve Long-Term Engagement
5.4.4.3 Unaddressed Regulatory Issues
6 Industry Analysis (Page No. - 48)
6.1 Introduction
6.2 Industry Trends
6.3 Market Life Cycle Analysis
6.4 Supply Chain Analysis
6.4.1 Core Industry Segments
6.4.2 Supporting Industry Segments
6.5 Value Chain Analysis
6.6 Porter’s Five Forces Analysis
6.6.1 Intensity of Competitive Rivalry
6.6.2 Threat of Substitutes
6.6.3 Bargaining Power of Buyers
6.6.4 Bargaining Power of Suppliers
6.6.5 Threat of New Entrants
7 Market, By Product (Page No. - 59)
7.1 Introduction
7.2 Smartwatch
7.3 Wristband (Smart Bracelet)
7.4 Smartshoe
7.5 Smart Shirt/Jacket
7.6 Headband/Smartcap
7.7 Others
8 Market, By Product Category (Page No. - 72)
8.1 Introduction
8.2 Handwear
8.3 Torsowear
8.4 Legwear
8.5 Headwear
8.6 Others
9 Market, By Component (Page No. - 79)
9.1 Introduction
9.1.1 Display
9.1.2 Processor
9.1.3 Memory Chip
9.1.4 Power Management Components
9.1.5 Networking Components
9.1.6 User Interface Components
9.1.7 Sensors
9.1.8 Mechanical Components
9.1.9 Others
10 Market, By Technology (Page No. - 90)
10.1 Introduction
10.2 Computing Technologies (Wearable Computers)
10.3 Display Technlogies (HUD, HMD, Amoled, and Augmented Reality)
10.4 Networking Technologies (Bluetooth, NFC, AND+, and Wi-Fi)
10.5 Positioning Technologies (GPS and Digital Compass)
10.6 Sensor Technologies (Accelerometers and MEMS)
10.7 Speech Recognition Technologies
11 Wearable Fitness Technology, By Activity Tracking (Page No. - 95)
11.1 Introduction
11.2 Heart Rate
11.3 Sleep
11.4 Steps
11.5 Calories
11.6 Others
12 Wearable Fitness Technology, By Software and Services (Page No. - 97)
12.1 Introduction
12.2 Software
12.2.1 Operating System (OS)
12.2.1.1 Android Wear OS
12.2.1.2 Tizen for Wearable
12.2.1.3 Pebble OS
12.2.1.4 Webos
12.2.1.5 Watchos
12.2.1.6 Linkit OS
12.2.1.7 Others
12.2.2 Apps (Applications)
12.3 Services
12.3.1 Personal Coach
12.3.2 Cloud Computing and Data Analytics
12.3.3 Others
13 Geographic Analysis (Page No. - 101)
13.1 Introduction
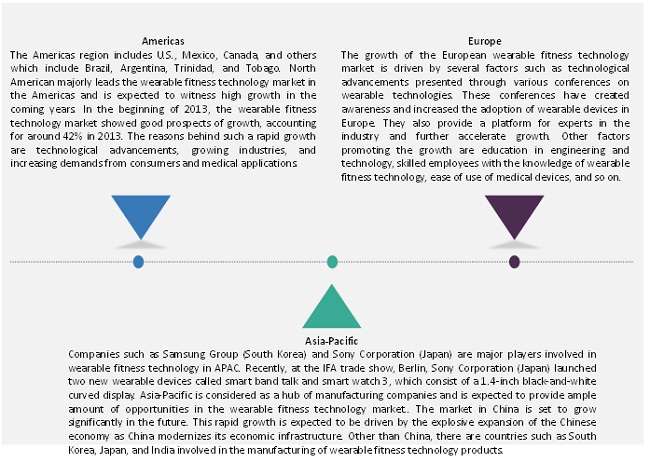
13.2 Americas
13.2.1 U.S.
13.2.2 Canada
13.2.3 Mexico
13.2.4 Others
13.3 Europe
13.3.1 U.K.
13.3.2 Germany
13.3.3 France
13.3.4 Others
13.4 Asia-Pacific
13.4.1 China
13.4.2 Japan
13.4.3 South Korea
13.4.4 India
13.4.5 Others
13.5 Rest of the World
13.5.1 Middle East
13.5.2 Africa
14 Competitive Landscape (Page No. - 120)
14.1 Overview
14.2 Market Share Analysis of the Wearable Fitness Technology, 2015
14.3 Competitive Situation and Trends
14.3.1 New Product Launches
14.3.2 Agreements, Collaborations, Contracts, & Partnerships
14.3.3 Acquisitions
14.3.4 Expansions and Investments
15 Company Profiles (Page No. - 126)
(Overview, Products and Services, Financials, Strategy & Development)*
15.1 Introduction
15.2 Fitbit Inc.
15.3 Apple Inc.
15.4 Xiaomi Technology Co. Ltd.
15.5 Garmin Ltd.
15.6 Samsung Electronics Co. Ltd.
15.7 Adidas AG
15.8 LG Electronics Inc.
15.9 Nike Inc.
15.10 Qualcomm Inc.
15.11 Sony Corp.
15.12 Jawbone Inc.
15.13 Pebble Technology Corp.
*Details on Overview, Products and Services, Financials, Strategy & Development Might Not Be Captured in Case of Unlisted Companies
16 Appendix (Page No. - 154)
16.1 Insights of Industry Experts
16.2 Discussion Guide
16.3 Knowledge Store: Marketsandmarkets’ Subscription Portal
16.4 Introducing RT: Real-Time Market Intelligence
16.5 Available Customizations
16.6 Related Report
List of Tables (69 Tables)
Table 1 The Need for Sophisticated Devices Propels the Growth of the Market
Table 2 Need of Self-Powering Devices Restrains the Growth of the Market
Table 3 Increasing Opportunities in Multiple Applications and Technological Advancements Pave the Growth Avenue for Players in the Wearables Market
Table 4 Size Constraints of Wearable Products Present A Major Challenge for Designers
Table 5 The Porter’s Five Forces Analysis: Bargaining Power of Suppliers Had the Lowest Impact on the Overall Market
Table 6 Global Wearable Fitness Technology Market, By Product,2014–2022 (USD Million)
Table 7 Global Market Size, By Product,2014–2022 (Thousand Units)
Table 8 Smartwatch Wearable Fitness Technology Market, By Region,2014–2022 (USD Million)
Table 9 Smartwatch Market Size, By Geography, 2014–2022 (Thousand Units)
Table 10 Smartwatch Market, By Component, 2014–2022 (USD Million)
Table 11 Wristband Wearable Fitness Technology Market, By Region,2014–2022 (USD Million)
Table 12 Wristband Market Size, By Geography, 2014–2022 (Thousand Units)
Table 13 Wristband Market, By Component,2014–2022 (USD Million)
Table 14 Smartshoe Wearable Fitness Technology Market, By Region,2014–2022 (USD Million)
Table 15 Smartshoe Market Size, By Region,2014–2022 (Thousand Units)
Table 16 Smartshoe Market, By Component,2014–2022 (USD Million)
Table 17 Smart Shirt/Jacket Wearable Fitness Technology Market, By Region, 2014–2022 (USD Million)
Table 18 Smart Shirt/Jacket Market Size,By Region, 2014–2022 (Thousand Units)
Table 19 Smart Shirt/Jacket Market,By Component, 2014–2022 (USD Million)
Table 20 Headband/Smartcap Market, By Region, 2014–2022 (USD Million)
Table 21 Headband/Smartcap Market Size,By Region, 2014–2022 (Thousand Units)
Table 22 Headband/Smartcap Market,By Component, 2014–2022 (USD Million)
Table 23 Others Market, By Region,2014–2022 (USD Million)
Table 24 Others Market Size, By Region,2014–2022 (Thousand Units)
Table 25 Others Market, By Component,2014–2022 (USD Million)
Table 26 Market, By Product Category,2014–2022 (USD Million)
Table 27 Market Size, By Product Category,2014–2022 (Thousand Units)
Table 28 Handwear Wearable Fitness Technology Market, By Product,2014–2022 (USD Million)
Table 29 Handwear Market Size, By Product, 2014–2022 (Thousand Units)
Table 30 Torsowear Market, By Product,2014–2022 (USD Million)
Table 31 Torsowear Market Size, By Product, 2014–2022 (Thousand Units)
Table 32 Legwear Wearable Fitness Technology Market, By Product,2014–2022 (USD Million)
Table 33 Legwear Market Size, By Product,2014–2022 (Thousand Units)
Table 34 Headwear Market, By Product,2014–2022 (USD Million)
Table 35 Headwear Market Size, By Product, 2014–2022 (Thousand Units)
Table 36 Other Market, By Product Category , 2014–2022 (USD Million)
Table 37 Other Market Size, By Product Category, 2014–2022 (Thousand Units)
Table 38 Market, By Component,2014–2022 (USD Million)
Table 39 Display in Market, By Product,2014–2022 (USD Million)
Table 40 Processor in Market, By Product,2014–2022 (USD Million)
Table 41 Memory Chip in Market, By Product, 2014–2022 (USD Million)
Table 42 Power Management Components in Market, By Product, 2014–2022 (USD Million)
Table 43 Networking Components in Market,By Product, 2014–2022 (USD Million)
Table 44 User Interface Components in Market, By Product, 2014–2022 (USD Million)
Table 45 Sensors in Wearable Fitness Technology Market, By Product,2014–2022 (USD Million)
Table 46 Mechanical Components in Market,By Product, 2014–2022 (USD Million)
Table 47 Other Components in Market,By Product, 2014–2022 (USD Million)
Table 48 Market, By Region,2014–2022 (USD Million)
Table 49 Market, By Region,2014–2022 (Thousand Units)
Table 50 Market in the Americas , By Country, 2014–2022 (USD Million)
Table 51 Market in the Americas, By Country, 2014–2022 (Thousand Units)
Table 52 Market in the Americas, By Product, 2014–2022 (USD Million)
Table 53 Market Size in the Americas, By Product, 2014–2022 (Thousand Units)
Table 54 Wearable Fitness Technology Market in Europe, By Country,2014–2022 (USD Million)
Table 55 Market in Europe, By Country,2014–2022 (Thousand Units)
Table 56 Market in Europe, By Product,2014–2022 (USD Million)
Table 57 Market in Europe, By Product,2014–2022 (Thousand Units)
Table 58 Market in APAC, By Country,2014–2022 (USD Million)
Table 59 Market in APAC, By Country,2014–2022 (Thousand Units)
Table 60 Market in APAC, By Product,2014–2022 (USD Million)
Table 61 Market in APAC, By Product,2014–2022 (Thousand Units)
Table 62 Wearable Fitness Technology Market in RoW, By Region,2014–2022 (USD Million)
Table 63 Market in RoW, By Region,2014–2022 (Thousand Units)
Table 64 Market in RoW, By Product,2014–2022 (USD Million)
Table 65 Market in RoW, By Product,2014–2022 (Thousand Units)
Table 66 New Product Launches, 2012–2015
Table 67 Agreements, Collaborations, Contracts, & Partnerships, 2012–2015
Table 68 Acquisitions, 2012–2015
Table 69 Expansions and Investments, 2012–2015
List of Figures (59 Figures)
Figure 1 Wearable Fitness Technology Market: Research Design
Figure 2 Global Smartphone Shipments in Million Units, 2013–2018
Figure 3 Bottom-Up Approach
Figure 4 Top-Down Approach
Figure 5 Data Triangulation Methodology
Figure 6 Market for Smartwatches Expected to Grow at the Highest CAGR(2016 vs. 2022)
Figure 7 Market for Displays for Wearable Fitness Technology Would be the Largest During the Forecast Period
Figure 8 Handwear Market Expected to Grow at the Highest CAGR DuringThe Forecast Period
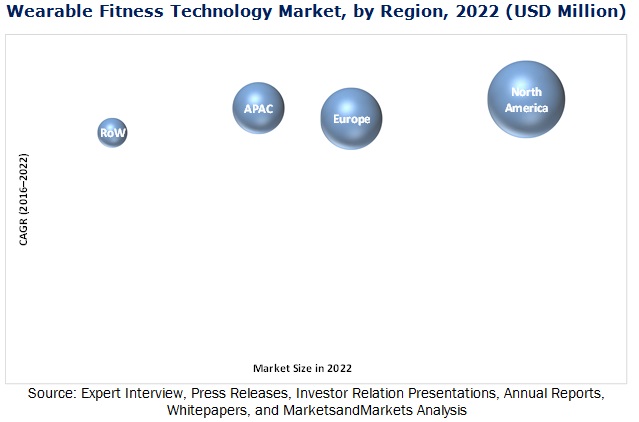
Figure 9 Americas Accounted for the Largest Market Share, 2015
Figure 10 Market to Exhibit Lucrative Growth Opportunities
Figure 11 Handwear Accounted for the Largest Market Share in 2015
Figure 12 Market in the Americas to Grow at the Highest Rate DuringThe Forecast Period
Figure 13 Displays to Exhibit Highest Growth During the Forecast Period
Figure 14 Americas Expected to Witness Highest Growth DuringThe Forecast Period
Figure 15 Events in the Market Till 2000
Figure 16 Wearable 2.0 and Future Technology
Figure 17 Market Dynamics: Overview
Figure 18 Smartwatch Shipments By Company, 2014
Figure 19 U.S.: Percentage of Wearable Device Users in Medical and Healthcare in 2014
Figure 20 Per Capita Income in India and China (USD) (2013 and 2014)
Figure 21 Smartphone Apps and Advanced Data Analysis are the Major Trends In Market
Figure 22 Life Cycle of Wearable Products, 2015
Figure 23 Wearable Fitness Technology Market: Supply Chain
Figure 24 Value Chain Analysis (2015): Major Value is Added During AssemblyAnd Distribution Phases
Figure 25 The Porter’s Five Forces Analysis (2015):
Figure 26 Market: Porter’s Five Forces Analysis, 2015
Figure 27 Intensity of Competitive Rivalry: High Competition in the Market DueTo New Product Launches and Innovations
Figure 28 Threat of Substitutes Would Be High Due to the AvailabilityOf Substitute Products
Figure 29 Bargaining Power of Buyers: as the Adoption Rate of Buyers is High, They Would Have A High Bargaining Power
Figure 30 Bargaining Power of Suppliers: Technological Advancements in Wearables Would Drive the Market for Suppliers During the Forecast Period
Figure 31 Threat of New Entrants: With Innovative Product Developments, New Entrants Likely to Enter This Market
Figure 32 Wearable Fitness Technology Market, By Product
Figure 33 Market, By Product Category
Figure 34 Wearable Technology Market, By Component
Figure 35 Market, By Technology
Figure 36 Wearable Fitness Technology, By Activity Tracking
Figure 37 Market, By Software and Services
Figure 38 Geographic Snapshot: Wearable Fitness Technology Market
Figure 39 Americas: Market Snapshot
Figure 40 Europe: Market Snapshot
Figure 41 Asia-Pacific: Market Snapshot
Figure 42 RoW: Market Snapshot
Figure 43 Companies Adopted New Product Launches as the Key Growth Strategy Over the Last Four Years (2012–2015)
Figure 44 Geographic Revenue Mix of Major Market Players
Figure 45 Fitbit Inc.: SWOT Analysis
Figure 46 Apple Inc.: Company Snapshot
Figure 47 Apple Inc.: SWOT Analysis
Figure 48 Xiaomi Technology Co. Ltd.: SWOT Analysis
Figure 49 Garmin Ltd.: Company Snapshot
Figure 50 Garmin Ltd.: SWOT Analysis
Figure 51 Samsung Electronics Co. Ltd.: Company Snapshot
Figure 52 Samsung Electronics Co. Ltd.: SWOT Analysis
Figure 53 Adidas AG: Company Snapshot
Figure 54 LG Electronics Inc.: Company Snapshot
Figure 55 Nike Inc.: Company Snapshot
Figure 56 Qualcomm Inc.: Company Snapshot
Figure 57 Sony Corp.: Company Snapshot
Figure 58 MarketsandMarkets Knowledge Store Snapshot
Figure 59 MarketsandMarkets Knowledge Store: Semiconductor & Electronics Industry Snapshot
Methodology
The research methodology used to estimate and forecast the wearable fitness technology market begins with obtaining data through secondary research such as corporate filings (such as annual reports, investor presentations, and financial statements); The World Economic Forum; white papers; journals and certified publications related to wearable fitness technology; articles from recognized authors; gold and silver standard websites; directories; and databases. Key offerings of wearable fitness technology solution providers have also been taken into consideration to determine the market segmentation. Bottom-up procedure has been employed to arrive at the overall size of the wearable fitness technology market from the revenues of key players. After arriving at the overall market size, the total market has been split into several segments and subsegments, which then has been verified through primary research by conducting extensive interviews with officials holding key positions in the industry, such as CEOs, VPs, directors, and executives. Market breakdown and data triangulation procedures have been employed to complete the overall market engineering process and arrive at exact statistics for all segments and subsegments. The breakdown of the profiles of primaries has been depicted in the following figure.
Critical questions which the report answers
- What new application areas in wearable fitness technology companies exploring?
- Which are the key players in the market and how intense is the competition?
Target Audience of the Report:
- Companies in the wearable fitness technology market
- Government and financial institutions as well as investment community
- Analysts and strategic business planners
- End users who want to know more about the wearable fitness technology and the latest technological developments in this industry
- Healthcare providers
- Research and consulting firms
- Venture capitalists
Scope of the Report:
This research report categorizes the overall wearable fitness technology market based on component, product, product category, and geography.
Wearable fitness technology Market, by Component
- Displays
- Processors
- Memory Chips
- Power Management Components
- Networking Components
- User Interface Components
- Sensors
- Mechanical Components
- Others
Wearable fitness technology Market, by Product
- Smartwatch
- Wristband
- Smartshoe
- Smart Shirt/Jacket
- Headband/Smartcap
- Others
Wearable fitness technology Market, by Product Category
- Handwear
- Torsowear
- Legwear
- Headwear
- Others
Wearable fitness technology Market, by Geography
- Americas
- Europe
- Asia-Pacific
- Rest of the World
Available Customizations:
With the given market data, MarketsandMarkets offers customizations according to companies’ specific needs. The following customization options are available for the report:
Geographic Analysis
- Further breakdown of the Americas market into the North and South American wearable technology market
Company Information
- Detailed analysis and profiling of additional market players based on various blocks of the value chain


Growth opportunities and latent adjacency in Wearable Fitness Technology Market
This report is almost 3 years old now. Are there any plans to refresh?