Global Smartphone Security Market by Operating Systems, Ownership & Features (2011 � 2016)


The advancements in technology have made available a variety of features that were earlier accessible through personal computers to be easily accessed through mobile phones; for instance, web browsing, emailing, and others. Popularity of applications such as Facebook, Twitter, and others has increased the usage of mobile phones in order to update the status messages instantly on the move.
As the usage of smartphone is increasing; their vulnerability to viruses, spams and malwares floating on the web is also on the rise. Smartphones are also required to be made safe and secure as we do for personal computers. This has necessitated and boosted the growth of smartphone security market. Though PC viruses have been in existence for over 25 years, mobile viruses� have very recently started to enter in the market from about 2004 onwards.
MarketsandMarkets expects the global smartphone security market to grow from 387.15 million in 2010 to $2964.89 million by 2016 at a CAGR of 43.97% from 2011 to 2016. Key issue in the industry today is battery overdrain and mobile handset and security software incompatibility.
The overall smartphone security market is segmented on the basis of mobile operating systems, ownership, and features. Mobile operating systems consist of following operating systems: Symbian, Android, Windows Mobile, Blackberry, iOS, and Other OS. The market by ownership is segmented into individual and business segment. The market by features is segmented into anti-virus, anti-theft, anti-phishing, encryption, anti-spam, and others. Others include anti-malware, privacy audit, and parental control.
The global smartphone security market is segmented into four geographies: North America, Europe, Asia Pacific and Japan, and ROW (Rest of the world). Europe forms the largest segment with about 32% of the overall market, followed by North America whereas; APJ is the fastest growing region with a CAGR of 48.58%.
Scope of the report
The report provides extensive analysis of �global smartphone security market segmented on the basis of mobile operating systems, ownership, and features including current market trends, industry drivers, and challenges for better understanding of the market. This report covers the strategies followed by �global smartphone security� players.
Market overview
This section discusses the market definition of �global smartphone security market�. It also discusses the way market is segmented and the methodology and assumptions considered for forecasting the revenue. The winning imperatives, along with the burning issues in the market are covered as well. Drivers, restraints, and opportunities for �global smartphone security market" has also been covered in this section.
Market segmentation
This research report categorizes the global smartphone security market for forecasting the revenue and analyzing the trends in each of the following submarkets:
On the basis of operating systems
- Symbian
- Blackberry
- Android
- Windows
- iPhone OS
- Others (Bada, Palm, Linux, and Java OS)
On the basis of type of users
- Individual
- Business
On the basis of security features
- Anti-virus
- Anti-theft
- Data encryption
- Others (Anti-malware, anti-spyware, anti-spam, privacy audit, and parental control)
On the basis of geography
- North America
- Europe
- Asia-Pacific & Japan (APJ)
- ROW (Rest of the World)
Geographic analysis
This section provides a brief overview of all the geographies pertaining to global smartphone security market segmented on the basis of mobile operating systems, ownership, and features, it covers the trends prevailing in each geography and the factors which are impacting the overall market in that particular geography.
Company profiles
This section provides the company profiles of major companies participating in the �global smartphone security market by operating system ownership & features�. Company profiles include a brief overview of the company, primary business, financial overview, strategies followed by developments.
Global Smartphone Security Market by Operating Systems, Ownership & Features (2011 � 2016)
The global smartphone security market is expected to grow from $387.15 million in 2010 to $2964.89 million by 2016 with a CAGR of 43.97% from 2011 to 2016. Europe leads the overall smartphone security market in terms of absolute dollar value followed by North America due to increasing number of smartphone internet users. Asia-Pacific & Japan have a smaller market in terms of revenue; however, with increasing penetration of smartphones; the market is expected to grow at the highest CAGR of 48.58% from 2011 to 2016.
Players in this market can gain competitive advantage by shifting their focus from catering to individual services than bundling of services. The competitive landscape for the smartphone security market is focused on new product launches being adopted by major players from 2008 to 2011. Following figure depicts the competitive developments from January 2008 to August 2011. Large players are making investments in R&D to gain a competitive edge over the others. Some of the prominent players in the market include Kaspersky Lab, Symantec, F-Secure, Trend Micro, and ESET.
COMPETITIVE DEVELOPMENTS, JANUARY 2008 - AUGUST 2011 (%)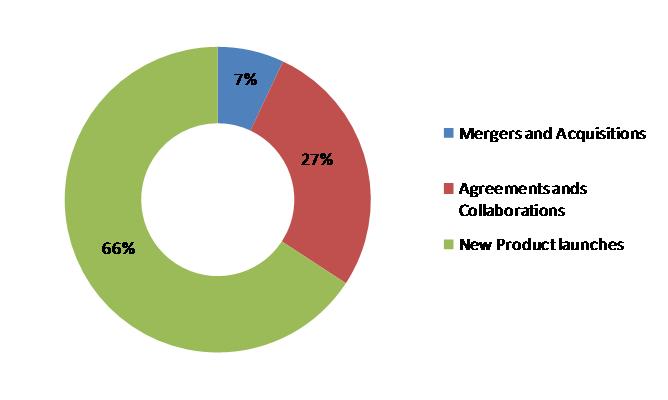
Source: MarketsandMarkets
 Exclusive indicates content/data unique to MarketsandMarkets and not available with any competitors.
TABLE OF CONTENTS
1 INTRODUCTION
1.1 KEY TAKE-AWAYS
1.2 REPORT DESCRIPTION
1.3 MARKETS COVERED
1.4 STAKEHOLDERS
1.5 RESEARCH METHODOLOGY
1.5.1 MARKET SIZE
1.5.2 KEY DATA POINTS FROM SECONDARY SOURCES
1.5.3 KEY DATA POINTS FROM PRIMARY SOURCES
1.5.4 ASSUMPTIONS MADE FOR THE REPORT
1.5.5 LIST OF COMPANIES COVERED DURING PRIMARIES
2 EXECUTIVE SUMMARY
3 MARKET OVERVIEW
3.1 INTRODUCTION
3.2 DEFINITION
3.3 MARKET SIZE
3.4 WINNING IMPERATIVE
3.4.1 BUNDLING OF SERVICES HELPS GAIN AN EDGE OVER COMPETITORS
3.5 BURNING ISSUES
3.5.1 BATTERY OVERDRAIN DUE TO MULTIPLE APPLICATIONS & SECURITY TOOLS
3.5.2 MOBILE HANDSET & ANTI-VIRUS SOFTWARE INCOMPATIBILITY
3.6 MARKET DYNAMICS
3.6.1 DRIVERS
3.6.1.1 Increase in cyber attacks
3.6.1.2 Increase in smartphone Internet users
3.6.1.3 Increase in number of online applications
3.6.1.4 Decreasing prices of smartphones
3.6.2 RESTRAINT
3.6.2.1 Lack of awareness about smartphone security
3.6.3 OPPORTUNITIES
3.6.3.1 Sophistication of cyber attacks
3.6.3.2 Creating awareness among security software distributors & end-users
3.7 IMPACT ANALYSIS ON THE SMARTPHONE SECURITY MARKET
3.8 VENDOR SHARE ANALYSIS
3.9 PATENT ANALYSIS
4 SMARTPHONE SECURITY MARKET, BY SEGMENTS
4.1 OVERVIEW
4.2 SMARTPHONE SECURITY MARKET, BY OPERATING SYSTEMS
4.2.1 SYMBIAN
4.2.1.1 Market size & forecast, by unit shipments
4.2.1.2 Market size & forecast, by revenue
4.2.2 BLACKBERRY
4.2.2.1 Market size & forecast, by unit shipments
4.2.2.2 Market size & forecast, by revenue
4.2.3 ANDROID
4.2.3.1 Market size & forecast, by unit shipments
4.2.3.2 Market size & forecast, by revenue
4.2.4 WINDOWS MOBILE
4.2.4.1 Market size & forecast, by unit shipments
4.2.4.2 Market size & forecast, by revenue
4.2.5 IPHONE OS
4.2.5.1 Market size & forecast, by unit shipments
4.2.5.2 Market size & forecast, by revenue
4.2.6 OTHERS
4.2.6.1 Market size & forecast, by unit shipments
4.2.6.2 Market size & forecast, by revenue
4.3 SMARTPHONE SECURITY MARKET, BY OWNERSHIP
4.3.1 MARKET SIZE & FORECAST, BY UNIT SHIPMENTS
4.3.2 MARKET SIZE & FORECAST, BY REVENUE
4.3.3 ENTERPRISE
4.3.4 CONSUMER
4.4 SMARTPHONE SECURITY MARKET, BY FEATURES
4.4.1 ANTI-VIRUS
4.4.2 ANTI-THEFT
4.4.3 DATA ENCRYPTION
4.4.4 OTHERS
5 GEOGRAPHICAL ANALYSIS
5.1 OVERVIEW
5.1.1 MARKET SIZE & FORECAST, BY UNIT SHIPMENTS
5.1.2 MARKET SIZE & FORECAST, BY REVENUE
5.2 NORTH AMERICA
5.2.1 OVERVIEW
5.2.2 MARKET SIZE & FORECAST, BY UNIT SHIPMENTS
5.2.3 MARKET SIZE & FORECAST, BY REVENUE
5.3 EUROPE
5.3.1 OVERVIEW
5.3.2 MARKET SIZE & FORECAST, BY UNIT SHIPMENTS
5.3.3 MARKET SIZE & FORECAST, BY REVENUE
5.4 ASIA-PACIFIC & JAPAN (APJ)
5.4.1 OVERVIEW
5.4.2 MARKET SIZE & FORECAST, BY UNIT SHIPMENTS
5.4.3 MARKET SIZE & FORECAST, BY REVENUE
5.5 ROW
5.5.1 OVERVIEW
5.5.2 MARKET SIZE & FORECAST, BY UNIT SHIPMENTS
5.5.3 MARKET SIZE & FORECAST, BY REVENUE
6 COMPETITIVE LANDSCAPE
7 COMPANY PROFILES
7.1 AHNLAB INC
7.1.1 OVERVIEW
7.1.2 PRODUCTS & SERVICES
7.1.3 FINANCIALS
7.1.4 STRATEGY
7.1.5 DEVELOPMENTS
7.2 AVAST SOFTWARE A.S.
7.2.1 OVERVIEW
7.2.2 PRODUCTS & SERVICES
7.2.3 FINANCIALS
7.2.4 STRATEGY
7.2.5 DEVELOPMENTS
7.3 BITDEFENDER LLC
7.3.1 OVERVIEW
7.3.2 PRODUCTS & SERVICES
7.3.3 FINANCIALS
7.3.4 STRATEGY
7.3.5 DEVELOPMENTS
7.4 BULLGUARD LTD
7.4.1 OVERVIEW
7.4.2 PRODUCTS & SERVICES
7.4.3 FINANCIALS
7.4.4 STRATEGY
7.4.5 DEVELOPMENTS
7.5 CERTICOM CORPORATION
7.5.1 OVERVIEW
7.5.2 PRODUCTS & SERVICES
7.5.3 FINANCIALS
7.5.4 STRATEGY
7.5.5 DEVELOPMENTS
7.6 COLUMBITECH AB
7.6.1 OVERVIEW
7.6.2 PRODUCTS & SERVICES
7.6.3 FINANCIALS
7.6.4 STRATEGY
7.6.5 DEVELOPMENTS
7.7 ESET, SPOL. S.R.O.
7.7.1 OVERVIEW
7.7.2 PRODUCTS & SERVICES
7.7.3 FINANCIALS
7.7.4 STRATEGY
7.7.5 DEVELOPMENTS
7.8 F-SECURE CORPORATION
7.8.1 OVERVIEW
7.8.2 PRODUCTS & SERVICES
7.8.3 FINANCIALS
7.8.4 STRATEGY
7.8.5 DEVELOPMENTS
7.9 HAURI INC
7.9.1 OVERVIEW
7.9.2 PRODUCTS & SERVICES
7.9.3 FINANCIALS
7.9.4 STRATEGY
7.9.5 DEVELOPMENTS
7.10 JUNIPER NETWORKS INC
7.10.1 OVERVIEW
7.10.2 PRODUCTS & SERVICES
7.10.3 FINANCIALS
7.10.4 STRATEGY
7.10.5 DEVELOPMENTS
7.11 KASPERSKY LAB
7.11.1 OVERVIEW
7.11.2 PRODUCTS & SERVICES
7.11.3 FINANCIALS
7.11.4 STRATEGY
7.11.5 DEVELOPMENTS
7.12 LOOKOUT INC
7.12.1 OVERVIEW
7.12.2 PRODUCTS & SERVICES
7.12.3 FINANCIALS
7.12.4 STRATEGY
7.12.5 DEVELOPMENTS
7.13 MCAFEE INC
7.13.1 OVERVIEW
7.13.2 PRODUCTS & SERVICES
7.13.3 FINANCIALS
7.13.4 STRATEGY
7.13.5 DEVELOPMENTS
7.14 NETQIN MOBILE INC
7.14.1 OVERVIEW
7.14.2 PRODUCTS & SERVICES
7.14.3 FINANCIALS
7.14.4 STRATEGY
7.14.5 DEVELOPMENTS
7.15 PANDA SECURITY S.L.
7.15.1 OVERVIEW
7.15.2 PRODUCTS & SERVICES
7.15.3 FINANCIALS
7.15.4 STRATEGY
7.15.5 DEVELOPMENTS
7.16 QUICK HEAL TECHNOLOGIES (P) LTD
7.16.1 OVERVIEW
7.16.2 PRODUCTS & SERVICES
7.16.3 FINANCIALS
7.16.4 STRATEGY
7.16.5 DEVELOPMENTS
7.17 SOPHOS LTD
7.17.1 OVERVIEW
7.17.2 PRODUCTS & SERVICES
7.17.3 FINANCIALS
7.17.4 STRATEGY
7.17.5 DEVELOPMENTS
7.18 SYBASE INC
7.18.1 OVERVIEW
7.18.2 PRODUCTS & SERVICES
7.18.3 FINANCIALS
7.18.4 STRATEGY
7.18.5 DEVELOPMENTS
7.19 SYMANTEC
7.19.1 OVERVIEW
7.19.2 PRODUCTS & SERVICES
7.19.3 FINANCIALS
7.19.4 STRATEGY
7.19.5 DEVELOPMENTS
7.20 TREND MICRO INC
7.20.1 OVERVIEW
7.20.2 PRODUCTS & SERVICES
7.20.3 FINANCIALS
7.20.4 STRATEGY
7.20.5 DEVELOPMENTS
7.21 OTHERS
7.21.1 AVIRA GMBH
7.21.1.1 Overview
7.21.1.2 Products & Services
7.21.1.3 Financials
7.21.1.4 Strategy
7.21.1.5 Developments
7.21.2 DOCTOR WEB
7.21.2.1 Overview
7.21.2.2 Products & Services
7.21.2.3 Financials
7.21.2.4 Strategy
7.21.2.5 Developments
7.21.3 GOOD TECHNOLOGY INC
7.21.3.1 Overview
7.21.3.2 Products & Services
7.21.3.3 Financials
7.21.3.4 Strategy
7.21.3.5 Developments
APPENDIX
U.S. PATENTS
EUROPE PATENTS
JAPAN PATENTS
LIST OF TABLES
TABLE 1 SMARTPHONE SECURITY MARKET REVENUE, BY OPERATING SYSTEMS, 2010 - 2016 ($MILLION)
TABLE 2 SMARTPHONE SECURITY MARKET REVENUE, BY OPERATING SYSTEMS, 2011 - 2016 (Y-O-Y GROWTH %)
TABLE 3 SMARTPHONE SECURITY MARKET UNIT SHIPMENTS, BY OPERATING SYSTEMS, 2010 - 2016 (MILLION)
TABLE 4 SMARTPHONE SECURITY MARKET UNIT SHIPMENTS, BY OPERATING SYSTEMS, 2011 - 2016 (Y-O-Y GROWTH %)
TABLE 5 SECURITY FEATURES & OPERATING SYSTEMS
TABLE 6 IMPACT ANALYSIS OF VARIOUS FACTORS ON SMARTPHONE SECURITY MARKET
TABLE 7 SMARTPHONE SECURITY MARKET UNIT SHIPMENTS OF SYMBIAN OS, BY GEOGRAPHY, 2010 - 2016 (MILLION)
TABLE 8 SMARTPHONE SECURITY MARKET UNIT SHIPMENTS OF SYMBIAN OS, BY GEOGRAPHY, 2011 - 2016 (Y-O-Y GROWTH %)
TABLE 9 SMARTPHONE SECURITY MARKET REVENUE OF SYMBIAN OS, BY GEOGRAPHY, 2010 - 2016 ($MILLION)
TABLE 10 SMARTPHONE SECURITY MARKET REVENUE OF SYMBIAN OS, BY GEOGRAPHY, 2011 - 2016 (Y-O-Y GROWTH %)
TABLE 11 SMARTPHONE SECURITY MARKET UNIT SHIPMENTS OF BLACKBERRY OS, BY GEOGRAPHY, 2010 - 2016 (MILLION)
TABLE 12 SMARTPHONE SECURITY MARKET UNIT SHIPMENTS OF BLACKBERRY OS, BY GEOGRAPHY, 2011 - 2016 (Y-O-Y GROWTH %)
TABLE 13 SMARTPHONE SECURITY MARKET REVENUE OF BLACKBERRY OS, BY GEOGRAPHY, 2010 - 2016 ($MILLION)
TABLE 14 SMARTPHONE SECURITY MARKET REVENUE OF BLACKBERRY OS, BY GEOGRAPHY, 2011 - 2016 (Y-O-Y GROWTH %)
TABLE 15 SMARTPHONE SECURITY MARKET UNIT SHIPMENTS OF ANDROID OS, BY GEOGRAPHY, 2010 � 2016 (MILLION)
TABLE 16 SMARTPHONE SECURITY MARKET UNIT SHIPMENTS OF ANDROID OS, BY GEOGRAPHY, 2011 - 2016 (Y-O-Y GROWTH %)
TABLE 17 SMARTPHONE SECURITY MARKET REVENUE OF ANDROID OS, BY GEOGRAPHY, 2010 - 2016 ($MILLION)
TABLE 18 SMARTPHONE SECURITY MARKET REVENUE OF ANDROID OS, BY GEOGRAPHY, 2011 - 2016 (Y-O-Y GROWTH %)
TABLE 19 SMARTPHONE SECURITY MARKET UNIT SHIPMENTS OF WINDOWS MOBILE OS, BY GEOGRAPHY, 2010 - 2016 (MILLION)
TABLE 20 SMARTPHONE SECURITY MARKET UNIT SHIPMENTS OF WINDOWS MOBILE OS, BY GEOGRAPHY, 2011 - 2016 (Y-O-Y GROWTH %)
TABLE 21 SMARTPHONE SECURITY MARKET REVENUE OF WINDOWS MOBILE OS, BY GEOGRAPHY, 2010 - 2016 ($MILLION)
TABLE 22 SMARTPHONE SECURITY MARKET REVENUE OF WINDOWS MOBILE OS, BY GEOGRAPHY, 2011 - 2016 (Y-O-Y GROWTH %)
TABLE 23 SMARTPHONE SECURITY MARKET UNIT SHIPMENTS OF IPHONE OS, BY GEOGRAPHY, 2010 - 2016 (MILLION)
TABLE 24 SMARTPHONE SECURITY MARKET UNIT SHIPMENTS OF IPHONE OS, BY GEOGRAPHY, 2011 - 2016 (Y-O-Y GROWTH %)
TABLE 25 SMARTPHONE SECURITY MARKET REVENUE OF IPHONE OS, BY GEOGRAPHY, 2010 - 2016 ($MILLION)
TABLE 26 SMARTPHONE SECURITY MARKET REVENUE OF IPHONE OS, BY GEOGRAPHY, 2011 - 2016 (Y-O-Y GROWTH %)
TABLE 27 SMARTPHONE SECURITY MARKET UNIT SHIPMENTS OF OTHER OS, BY GEOGRAPHY, 2010 - 2016 (MILLION)
TABLE 28 SMARTPHONE SECURITY MARKET UNIT SHIPMENTS OF OTHER OS, BY GEOGRAPHY, 2011 - 2016 (Y-O-Y GROWTH %)
TABLE 29 SMARTPHONE SECURITY MARKET REVENUE OF OTHER OS, BY GEOGRAPHY, 2010 - 2016 ($MILLION)
TABLE 30 SMARTPHONE SECURITY MARKET REVENUE OF OTHER OS, BY GEOGRAPHY, 2011 - 2016 (Y-O-Y GROWTH %)
TABLE 31 SMARTPHONE SECURITY MARKET UNIT SHIPMENTS, BY OWNERSHIP, 2010 - 2016 (MILLION)
TABLE 32 SMARTPHONE SECURITY MARKET UNIT SHIPMENTS, BY OWNERSHIP, 2011 - 2016 (Y-O-Y GROWTH %)
TABLE 33 SMARTPHONE SECURITY MARKET REVENUE, BY OWNERSHIP, 2010 - 2016 ($MILLION)
TABLE 34 SMARTPHONE SECURITY MARKET REVENUE, BY OWNERSHIP, 2011 - 2016 (Y-O-Y GROWTH %)
TABLE 35 SMARTPHONE SECURITY FEATURES & THEIR USER DEMAND, BY PRIORITY
TABLE 36 OPERATING SYSTEM & VIRUS
TABLE 37 SMARTPHONE SECURITY MARKET UNIT SHIPMENTS, BY GEOGRAPHY, 2010 - 2016 (MILLION)
TABLE 38 SMARTPHONE SECURITY MARKET UNIT SHIPMENTS, BY GEOGRAPHY, 2011 - 2016 (Y-O-Y GROWTH %)
TABLE 39 SMARTPHONE SECURITY MARKET REVENUE, BY GEOGRAPHY, 2010 - 2016 ($MILLION)
TABLE 40 SMARTPHONE SECURITY MARKET REVENUE, BY GEOGRAPHY, 2011 - 2016 (Y-O-Y GROWTH %)
TABLE 41 NORTH AMERICA: SMARTPHONE SECURITY MARKET UNIT SHIPMENTS, BY OPERATING SYSTEMS, 2010 - 2016 (MILLION)
TABLE 42 NORTH AMERICA: SMARTPHONE SECURITY MARKET UNIT SHIPMENTS, BY OPERATING SYSTEMS, 2011 - 2016 (Y-O-Y GROWTH %)
TABLE 43 NORTH AMERICA: SMARTPHONE SECURITY MARKET REVENUE, BY OPERATING SYSTEMS, 2010 - 2016 ($MILLION)
TABLE 44 NORTH AMERICA: SMARTPHONE SECURITY MARKET REVENUE, BY OPERATING SYSTEMS, 2011 - 2016 (Y-O-Y GROWTH %)
TABLE 45 EUROPE: SMARTPHONE SECURITY MARKET UNIT SHIPMENTS, BY OPERATING SYSTEMS, 2010 - 2016 (MILLION)
TABLE 46 EUROPE: SMARTPHONE SECURITY MARKET UNIT SHIPMENTS, BY OPERATING SYSTEMS, 2011 - 2016 (Y-O-Y GROWTH %)
TABLE 47 EUROPE: SMARTPHONE SECURITY MARKET REVENUE, BY OPERATING SYSTEMS, 2010 - 2016 ($MILLION)
TABLE 48 EUROPE: SMARTPHONE SECURITY MARKET REVENUE, BY OPERATING SYSTEMS, 2011 - 2016 (Y-O-Y GROWTH %)
TABLE 49 APJ: SMARTPHONE SECURITY MARKET UNIT SHIPMENTS, BY OPERATING SYSTEMS, 2010 - 2016 (MILLION)
TABLE 50 APJ: SMARTPHONE SECURITY MARKET UNIT SHIPMENTS, BY OPERATING SYSTEMS, 2011 - 2016 (Y-O-Y GROWTH %)
TABLE 51 APJ: SMARTPHONE SECURITY MARKET REVENUE, BY OPERATING SYSTEMS, 2010 - 2016 ($MILLION)
TABLE 52 APJ: SMARTPHONE SECURITY MARKET REVENUE, BY OPERATING SYSTEMS, 2011 - 2016 (Y-O-Y GROWTH %)
TABLE 53 ROW: SMARTPHONE SECURITY MARKET UNIT SHIPMENTS, BY OPERATING SYSTEMS, 2010 - 2016 (MILLION)
TABLE 54 ROW: SMARTPHONE SECURITY MARKET UNIT SHIPMENTS, BY OPERATING SYSTEMS, 2011 - 2016 (Y-O-Y GROWTH %)
TABLE 55 ROW: SMARTPHONE SECURITY MARKET REVENUE, BY OPERATING SYSTEMS, 2010 - 2016 ($MILLION)
TABLE 56 ROW: SMARTPHONE SECURITY MARKET REVENUE, BY OPERATING SYSTEMS, 2011 - 2016 (Y-O-Y GROWTH %)
TABLE 57 MERGERS & ACQUISITIONS, 2008 � 2011
TABLE 58 AGREEMENTS & COLLABORATIONS, 2008 � 2011
TABLE 59 NEW PRODUCT LAUNCHES, 2008 - 2011
TABLE 60 F-SECURE: MARKET REVENUE, BY SEGMENTS, 2009 - 2010 ($MILLION)
TABLE 61 F-SECURE: MARKET REVENUE, BY GEOGRAPHY, 2009 - 2010 ($MILLION)
TABLE 62 JUNIPER NETWORKS INC: MARKET REVENUE, BY SEGMENTS, 2009 - 2010 ($MILLION)
TABLE 63 JUNIPER NETWORKS INC: MARKET REVENUE, BY GEOGRAPHY, 2009 - 2010 ($MILLION)
TABLE 64 KASPERSKY LAB: MARKET REVENUE, BY GEOGRAPHY, 2009 � 2010 ($MILLION)
TABLE 65 MCAFEE: MARKET REVENUE, BY SEGMENTS, 2009 � 2010 ($MILLION)
TABLE 66 MCAFEE: MARKET REVENUE, BY GEOGRAPHY, 2009 � 2010 ($MILLION)
TABLE 67 SYBASE: MARKET REVENUE, BY SEGMENTS, 2008 - 2009 ($MILLION)
TABLE 68 SYBASE: MARKET REVENUE, BY GEOGRAPHY, 2008 � 2009 ($MILLION)
TABLE 69 SYMANTEC: MARKET REVENUE, BY SEGMENTS, 2010 � 2011 ($MILLION)
TABLE 70 SYMANTEC: MARKET REVENUE, BY GEOGRAPHY, 2010 � 2011 ($MILLION)
TABLE 71 TREND MICRO: MARKET REVENUE, BY GEOGRAPHY, 2009 � 2010 ($MILLION)
LIST OF FIGURES
FIGURE 1 MOBILE (SMARTPHONE) INTERNET USERS, 2010 - 2015
FIGURE 2 SMARTPHONE USER�S INTERNET ACCESS TREND, 2010 (%)
FIGURE 3 INCREASING SMARTPHONE SALES, 2010 � 2015 (MILLION)
FIGURE 4 VENDOR SHARE ANALYSIS
FIGURE 5 SMARTPHONE SECURITY MARKET PATENTS, BY GEOGRAPHY, MAY 2005 � AUGUST 2011
FIGURE 6 TYPICAL CONSUMER & ENTERPRISE ENVIRONMENT
FIGURE 7 COMPETITIVE DEVELOPMENTS, JANUARY 2008 - AUGUST 2011


Growth opportunities and latent adjacency in Global Smartphone Security Market