Zero Trust Architecture Market

Zero Trust Architecture Market by Offering (Solutions and Services), Organization Size (SMEs and Large Enterprises), Deployment Mode (Cloud and On-Premises), Vertical (BFSI, IT & ITeS, Healthcare) and Region - Global Forecast to 2028

Report Code: TC 8852 Nov, 2023, by marketsandmarkets.com

Updated on : March 21, 2024

The Zero Trust Architecture Market is anticipated to increase at a Compound Annual Growth Rate (CAGR) of 17.3% over the course of the forecast period, from USD 17.3 billion in 2023 to USD 38.5 billion by 2028. The zero trust architecture market is expanding due to the imperative of meeting regulatory compliance requirements, such as GDPR and HIPAA, highlighting the importance of stringent control over network access. Furthermore, the market is propelled by the evolving cybersecurity landscape characterized by increasingly sophisticated threats like self-propagating malware and ransomware, necessitating advanced security measures. Additionally, the proliferation of digital transformation and cloud adoption has broadened the attack surface, making the “never trust, always verify” zero trust approach a vital component of modern cybersecurity strategies.

Zero Trust Architecture Market

To know about the assumptions considered for the study, Request for Free Sample Report

Zero Trust Architecture Market

To know about the assumptions considered for the study, download the pdf brochure

Zero Trust Architecture Market Dynamics

Driver: Growing need for zero trust architecture fueled by digital transformation and cloud integration

The combination of digital transformation and the widespread use of cloud environments is driving the shift to a zero trust architecture. Digital transformation involves integrating digital technologies into all business operations, creating a highly interconnected IT landscape. This expanded landscape increases the potential attack surface as organizations incorporate IoT devices, cloud apps, and connected systems. Additionally, the growing use of multi-cloud environments highlights the need for a security framework to protect data and apps across various cloud platforms. Zero trust architecture is gaining prominence because it adheres to the principle of “never trust, always verify.” Every user, device, and application request undergoes continuous authentication and authorization, even within the internal network. This approach ensures that only legitimate entities gain access to critical resources and data, reducing the risk of unauthorized access and lateral movement of threats. Consequently, digital transformation and cloud adoption convergence underscore the demand for zero trust architecture as a robust security solution to protect critical data and minimize potential losses in complex, interconnected IT environments.

Restraint: Challenges and costs of transitioning to zero trust architecture

Transitioning to a zero trust architecture is complex and costly, especially for organizations with extensive networks. This security model requires a deep understanding and can lead to vulnerabilities if implemented incorrectly. It involves significant expenses for new hardware and software and IT staff training. Adapting existing IT systems and policies is time-consuming and resource-intensive. Integrating large multinational corporations with legacy systems across multiple locations into a zero trust architecture is a significant investment and a barrier to complete adoption.

Opportunity: Growing prospects in zero trust solutions and services

The increasing need for zero trust architecture presents exciting prospects for creating new products and services that adhere to this security philosophy. Conventional security methods are increasingly seen as inadequate, prompting organizations to seek innovative solutions. This growing demand has led to specialized offerings like Zero Trust Identity and Access Management (IAM) solutions, which enhance identity verification through multi-factor authentication and behavioral analysis. Supporting these efforts, security analytics and monitoring tools are vital for continuously assessing user and network activity, enabling swift detection and response to anomalies and threats. Additionally, there’s a rising demand for zero trust endpoint security solutions, ensuring secure access based on a device’s security status. With the ongoing growth of cloud adoption, there’s an opportunity to develop zero trust cloud architecture solutions that enforce strict access controls and protect data. Alongside product development, service providers can offer implementation, customized solutions, security audits, and educational programs to facilitate the seamless adoption of zero trust architecture measures. Eventually, businesses can play a pivotal role in enhancing cybersecurity postures and addressing evolving security challenges.

Challenge: Declining traditional security model boundaries

The traditional security model relied on trust within organizational perimeters, but evolving factors like cloud computing and remote work blur these boundaries. Zero trust architecture’s fundamental principle is “never trust, always verify,” requiring authentications for all users and devices, regardless of location. To extend zero trust principles to remote employees and personal devices, robust Identity and Access Management (IAM) solutions are crucial. It ensures only authorized individuals access sensitive data, regardless of the physical location, addressing a significant challenge in the zero trust architecture.

Zero Trust Architecture Market Ecosystem

Zero Trust Architecture Market

By vertical, the Retail and eCommerce segment will grow at the highest CAGR during the forecast period.

Due to several compelling factors, the retail and eCommerce sector is witnessing a significant surge in adopting Zero Trust Architecture. These include the sector’s management of high-value data and assets, such as sensitive customer information and product data, which are prime targets for cyberattacks. Furthermore, as retail and eCommerce organizations increasingly embrace digital technologies like cloud computing, mobile commerce, and IoT, they face heightened security risks, making it a valuable defense strategy. Additionally, strict compliance requirements, such as PCI DSS and GDPR, compel these organizations to implement comprehensive security measures, with zero trust offering a robust framework. Moreover, there is a growing awareness among retail and eCommerce entities about the benefits of safeguarding the data and systems driving its adoption.

By organization size, the SMEs will grow at the highest CAGR during the forecast period.

SMEs are experiencing explosive growth in the zero trust architecture market, driven by increasing cyber threats targeting them due to their perceived vulnerability compared to larger enterprises. It offers a comprehensive security framework, addressing these concerns by providing enhanced protection. Moreover, there is a growing awareness among SMEs about the benefits, with more businesses recognizing the necessity of a holistic security approach to safeguard the data and systems. The affordability of solutions is on the rise, making this advanced security technology more accessible to smaller enterprises. Additionally, simplified deployment and management of solutions make them increasingly appealing to SMEs with limited IT resources, further fueling the adoption in this market segment.

By region, North America accounts for the highest market size during the forecast period.

The zero trust architecture market in North America is thriving due to the presence of major players like Cisco, Palo Alto Networks, and Zscaler. These leading companies provide North American organizations with early access to cutting-edge solutions and technologies. Moreover, North America boasts highly cybersecurity-aware organizations that recognize the importance of comprehensive security strategies like zero trust to safeguard the data and systems from cyber threats. The region also enforces stringent cybersecurity regulations, compelling businesses to implement robust security measures, with zero trust aiding compliance. Additionally, North America’s early embrace of cloud computing presents both opportunities and security challenges, and zero trust plays a crucial role in enabling secure access to and utilization of cloud services.

Zero Trust Architecture Market Size, and Share

Key Market Playes

Palo Alto Networks (US), VMware (US), Zscaler (US), Akamai (US), Microsoft (US), Cisco (US), IBM (US), Citrix (US), Check Point (US), Trellix (US), Forcepoint (US), CrowdStrike (US), Cloudflare (US), Fortinet (US), Google (US), Netskope (US), Perimeter 81 (US), Twingate (US), Appgate (US), Zero Networks (Israel), Versa Networks (US), Axis Security (US), Ivanti (US), NordLayer (US), and GoodAccess (Czech Republic) are the key players and other players in the zero-trust architecture market.

Get online access to the report on the World's First Market Intelligence Cloud

  • Easy to Download Historical Data & Forecast Numbers
  • Company Analysis Dashboard for high growth potential opportunities
  • Research Analyst Access for customization & queries
  • Competitor Analysis with Interactive dashboard
  • Latest News, Updates & Trend analysis
Request Sample

Scope of the Report

Report Metrics

Details

Market size available for years

  • 2017-2028

Base year considered

  • 2022

Forecast period

  • 2023–2028

Forecast units

  • Value (USD Million/USD Billion) 

Segments Covered

  • Offering, Organization Size, Deployment Mode, Vertical, And Region

Geographies covered

  • North America, Europe, Asia Pacific, Middle East & Africa, and Latin America

Companies covered

  • Major vendors in the global Zero trust architecture market include Palo Alto Networks (US), VMware (US), Zscaler (US), Akamai (US), Microsoft (US), Cisco (US), IBM (US), Citrix (US), Check Point (US), Trellix (US), Forcepoint (US), CrowdStrike (US), Cloudflare (US), Fortinet (US), Google (US), Netskope (US), Perimeter 81 (US), Twingate (US), Appgate (US), Zero Networks (Israel), Versa Networks (US), Axis Security (US), Ivanti (US), NordLayer (US), and GoodAccess (Czech Republic).   

The study categorizes the zero trust architecture market by segments - offering, organization size, deployment mode, vertical, and region.

By Offering:
  • Solution
  • Services
By Organization Size:
  • Small and Medium-Sized Enterprises (SMEs)
  • Large Enterprises
By Deployment Mode:
  • Cloud
  • On-Premises
Vertical:
  • Banking, Financial Services, and Insurance (BFSI)
  • Government and Defense
  • IT & ITeS
  • Healthcare
  • Retail and ECommerce
  • Energy and Utilities
  • Other Verticals
By Region:
  • North America
  • Europe
  • Asia Pacific
  • Middle East & Africa
  • Latin America

Recent Developments

  1. In April 2023, Palo Alto Networks and Accenture joined forces to bolster cyber resilience with integrated Prisma SASE solutions. This partnership streamlines zero trust network access, effectively addressing security concerns for remote workforces.
  2. In April 2023, Cisco and Microsoft unveiled a collaborative Secure Access Service Edge (SASE) cloud architecture, merging networking and security with a zero-trust approach. This strategic alliance optimizes Microsoft application performance, reinforces security, and bolsters extended detection and response capabilities.
  3. In May 2023, Zscaler forged a strategic partnership with the Center for Internet Security (CIS) to bolster cybersecurity for state, local, tribal, and territorial governments by leveraging the CIS CyberMarket. Through this partnership, Zscaler’s Zero Trust Exchange brings forth budget-friendly, cutting-edge zero trust solutions to safeguard against the ever-evolving landscape of cyber threats.
  4. In June 2022, VMware partnered with NIST’s NCCoE to streamline zero trust architecture deployment, offering practical insights and use cases for diverse business needs, ultimately simplifying the design process.
  5. In May 2022, Fujitsu and Akamai formed a strategic alliance to bolster cybersecurity measures for Australian companies, safeguarding critical infrastructure and digital assets. This partnership aimed to provide cutting-edge defense against ransomware and cyber threats.

Frequently Asked Questions (FAQ):

To speak to our analyst for a discussion on the above findings, click Speak to Analyst

TABLE OF CONTENTS
 
1 INTRODUCTION (Page No. - 30)
    1.1 STUDY OBJECTIVES 
    1.2 MARKET DEFINITION 
           1.2.1 INCLUSIONS & EXCLUSIONS
                    TABLE 1 ZERO TRUST ARCHITECTURE VS. ZERO TRUST SECURITY
    1.3 STUDY SCOPE 
           1.3.1 MARKET SEGMENTATION
           1.3.2 REGIONS COVERED
    1.4 YEARS CONSIDERED 
    1.5 CURRENCY CONSIDERED 
           TABLE 2 USD EXCHANGE RATES, 2018–2022
    1.6 STAKEHOLDERS 
    1.7 RECESSION IMPACT 
 
2 RESEARCH METHODOLOGY (Page No. - 36)
    2.1 RESEARCH DATA 
           FIGURE 1 ZERO TRUST ARCHITECTURE MARKET: RESEARCH DESIGN
           2.1.1 SECONDARY DATA
           2.1.2 PRIMARY DATA
                    2.1.2.1 Breakup of primaries
                               FIGURE 2 BREAKDOWN OF PRIMARY INTERVIEWS, BY COMPANY TYPE, DESIGNATION,  AND REGION
                    2.1.2.2 Key industry insights
    2.2 DATA TRIANGULATION 
    2.3 MARKET SIZE ESTIMATION 
           FIGURE 3 MARKET ESTIMATION: RESEARCH FLOW
           2.3.1 TOP-DOWN APPROACH
           FIGURE 4 APPROACH 1 (SUPPLY SIDE): REVENUE FROM SOFTWARE/SERVICES OF ZERO TRUST ARCHITECTURE VENDORS
           FIGURE 5 APPROACH 1 (SUPPLY-SIDE ANALYSIS)
           2.3.2 BOTTOM-UP APPROACH
                    FIGURE 6 MARKET SIZE ESTIMATION METHODOLOGY (APPROACH 2): BOTTOM-UP (DEMAND SIDE) — PRODUCTS/SOLUTIONS/SERVICES
    2.4 MARKET FORECAST 
           TABLE 3 FACTOR ANALYSIS
    2.5 RESEARCH ASSUMPTIONS 
    2.6 LIMITATIONS AND RISK ASSESSMENT 
    2.7 RECESSION IMPACT ANALYSIS 
 
3 EXECUTIVE SUMMARY (Page No. - 46)
    TABLE 4 ZERO TRUST ARCHITECTURE MARKET GROWTH, 2017–2022 (USD MILLION) 
    TABLE 5 MARKET GROWTH, 2023–2028 (USD MILLION) 
    FIGURE 7 NORTH AMERICA TO ACCOUNT FOR LARGEST MARKET IN 2023 
 
4 PREMIUM INSIGHTS (Page No. - 49)
    4.1 ATTRACTIVE OPPORTUNITIES FOR PLAYERS IN ZERO TRUST ARCHITECTURE MARKET 
           FIGURE 8 INCREASING INSTANCES OF SOPHISTICATED CYBERATTACKS AND NEED FOR ADHERENCE TO REGULATORY COMPLIANCE TO DRIVE MARKET GROWTH
    4.2 MARKET, BY OFFERING 
           FIGURE 9 SERVICES SEGMENT TO GROW AT HIGHER CAGR DURING FORECAST PERIOD
    4.3 MARKET, BY ORGANIZATION SIZE 
           FIGURE 10 LARGE ENTERPRISES SEGMENT TO GROW AT HIGHER CAGR DURING  FORECAST PERIOD
    4.4 MARKET, BY DEPLOYMENT MODE 
           FIGURE 11 CLOUD TO GROW AT HIGHER CAGR DURING FORECAST PERIOD
    4.5 MARKET: TOP 3 VERTICALS  AND REGION 
           FIGURE 12 IT & ITES SEGMENT AND NORTH AMERICA TO ACCOUNT FOR LARGEST MARKET DURING FORECAST PERIOD
    4.6 MARKET INVESTMENT SCENARIO 
           FIGURE 13 ASIA PACIFIC TO EMERGE AS LUCRATIVE MARKET FOR INVESTMENTS  IN NEXT FIVE YEARS
 
5 MARKET OVERVIEW AND INDUSTRY TRENDS (Page No. - 52)
    5.1 INTRODUCTION 
    5.2 MARKET DYNAMICS 
           FIGURE 14 DRIVERS, RESTRAINTS, OPPORTUNITIES, AND CHALLENGES: ZERO TRUST ARCHITECTURE MARKET
           5.2.1 DRIVERS
                    5.2.1.1 Evolution of cyber threats spurs growth of robust network segmentation
                    5.2.1.2 Digital transformation and cloud adoption drive zero trust architecture demand
                    5.2.1.3 Rising emphasis on regulatory compliance driving adoption of zero trust architecture
                    5.2.1.4 Shift from perimeter security to embrace zero trust architecture drives market
           5.2.2 RESTRAINTS
                    5.2.2.1 Legacy systems impact zero trust adoption
                    5.2.2.2 Complexity and cost of implementation
           5.2.3 OPPORTUNITIES
                    5.2.3.1 Growth in IoT adoption creates opportunities for zero trust architecture
                    5.2.3.2 Expanding opportunities in zero trust architecture and services
                    5.2.3.3 MSS demand drives zero trust architecture growth opportunity
           5.2.4 CHALLENGES
                    5.2.4.1 Diminishing strength of conventional security models
                    5.2.4.2 Fragmented security operations in zero trust architecture
    5.3 CASE STUDY ANALYSIS 
           5.3.1 DELOITTE’S CUSTOMIZED SOLUTION HELPED A MAJOR INDUSTRIAL ORGANIZATION IN ACHIEVING ZERO TRUST ARCHITECTURE
           5.3.2 OPTIV EMPOWERED NATIONAL LAW FIRM TO ACHIEVE ZERO TRUST SUCCESS
           5.3.3 CHILDREN’S HOSPITAL ENHANCED RESILIENCE WITH COLORTOKENS’ ZERO-TRUST SOLUTION
    5.4 VALUE CHAIN ANALYSIS 
           FIGURE 15 VALUE CHAIN: ZERO TRUST ARCHITECTURE MARKET
           5.4.1 COMPONENT
           5.4.2 PLANNING AND DESIGNING
           5.4.3 INTEGRATION & DEPLOYMENT
           5.4.4 COMPLIANCE AND AUDITING
           5.4.5 END USERS
    5.5 ECOSYSTEM 
           TABLE 6 ECOSYSTEM ANALYSIS: MARKET
           FIGURE 16 ECOSYSTEM: MARKET
    5.6 PORTER’S FIVE FORCES ANALYSIS 
           FIGURE 17 PORTER’S FIVE FORCES ANALYSIS: ZERO TRUST ARCHITECTURE MARKET
           TABLE 7 PORTER’S FIVE FORCES MODEL: IMPACT ANALYSIS
           5.6.1 THREAT OF NEW ENTRANTS
           5.6.2 BARGAINING POWER OF SUPPLIERS
           5.6.3 BARGAINING POWER OF BUYERS
           5.6.4 THREAT OF SUBSTITUTES
           5.6.5 INTENSITY OF COMPETITIVE RIVALRY
    5.7 PRICING ANALYSIS 
           5.7.1 AVERAGE SELLING PRICE TREND OF KEY PLAYER, BY OFFERING
                    FIGURE 18 AVERAGE SELLING PRICE TREND OF KEY PLAYERS: TOP 3 OFFERINGS
                    TABLE 8 AVERAGE SELLING PRICE TREND OF KEY PLAYERS, BY OFFERING
           5.7.2 INDICATIVE PRICING ANALYSIS, BY OFFERING
                    TABLE 9 CLOUDFLARE: INDICATIVE PRICING ANALYSIS
                    TABLE 10 INSTASAFE: INDICATIVE PRICING ANALYSIS
    5.8 TECHNOLOGY ANALYSIS 
           5.8.1 ARTIFICIAL INTELLIGENCE (AI) AND MACHINE LEARNING (ML)
           5.8.2 IAM
           5.8.3 CLOUD-NATIVE ZERO TRUST
           5.8.4 NETWORK SEGMENTATION
    5.9 PATENT ANALYSIS 
           FIGURE 19 ZERO TRUST ARCHITECTURE MARKET: PATENT ANALYSIS
           FIGURE 20 REGIONAL ANALYSIS OF PATENTS FOR MARKET, 2022
           TABLE 11 LIST OF FEW PATENTS IN ZERO TRUST ARCHITECTURE, 2022–23
    5.10 TRENDS AND DISRUPTIONS IMPACTING CUSTOMERS’ BUSINESSES 
           FIGURE 21 ZERO TRUST ARCHITECTURE MARKET: TRENDS AND DISRUPTIONS IMPACTING CUSTOMERS’ BUSINESSES
    5.11 BUSINESS MODEL 
                    TABLE 12 BUSINESS MODEL
    5.12 REGULATORY LANDSCAPE 
           5.12.1 PAYMENT CARD INDUSTRY DATA SECURITY STANDARD (PCI-DSS)
           5.12.2 GENERAL DATA PROTECTION REGULATION (GDPR)
           5.12.3 CALIFORNIA CONSUMER PRIVACY ACT (CCPA)
           5.12.4 GRAMM-LEACH-BLILEY ACT OF 1999 (GLBA)
           5.12.5 PERSONAL INFORMATION PROTECTION AND ELECTRONIC DOCUMENTS ACT (PIPEDA)
           5.12.6 HEALTH INSURANCE PORTABILITY AND ACCOUNTABILITY ACT (HIPAA)
           5.12.7 THE INTERNATIONAL ORGANIZATION FOR STANDARDIZATION (ISO) STANDARD 27001
           5.12.8 REGULATORY BODIES, GOVERNMENT AGENCIES, AND OTHER ORGANIZATIONS
                    TABLE 13 NORTH AMERICA: LIST OF REGULATORY BODIES, GOVERNMENT AGENCIES,  AND OTHER ORGANIZATIONS
                    TABLE 14 EUROPE: LIST OF REGULATORY BODIES, GOVERNMENT AGENCIES,  AND OTHER ORGANIZATIONS
                    TABLE 15 ASIA PACIFIC: LIST OF REGULATORY BODIES, GOVERNMENT AGENCIES,  AND OTHER ORGANIZATIONS
    5.13 KEY STAKEHOLDERS AND BUYING CRITERIA 
           5.13.1 KEY STAKEHOLDERS IN BUYING PROCESS
                    FIGURE 22 INFLUENCE OF STAKEHOLDERS ON BUYING PROCESS (%)
                    TABLE 16 INFLUENCE OF STAKEHOLDERS ON BUYING PROCESS (%)
           5.13.2 BUYING CRITERIA
                    FIGURE 23 KEY BUYING CRITERIA FOR TOP 3 APPLICATIONS
                    TABLE 17 KEY BUYING CRITERIA FOR TOP 3 APPLICATIONS
    5.14 KEY CONFERENCES AND EVENTS, 2023–2024 
                    TABLE 18 CONFERENCES AND EVENTS, 2023–2024
 
6 ZERO TRUST ARCHITECTURE MARKET, BY OFFERING (Page No. - 82)
    6.1 INTRODUCTION 
           6.1.1 OFFERING: MARKET DRIVERS
                    FIGURE 24 SOLUTIONS SEGMENT TO ACCOUNT FOR LARGER MARKET DURING FORECAST PERIOD
                    TABLE 19 MARKET, BY OFFERING, 2017–2022 (USD MILLION)
                    TABLE 20 MARKET, BY OFFERING, 2023–2028 (USD MILLION)
    6.2 SOLUTIONS 
           6.2.1 FOCUS ON OPTIMIZING OPERATIONAL EFFICIENCY WITH ZERO TRUST ARCHITECTURE MODEL TO DRIVE MARKET
                    TABLE 21 SOLUTIONS: MARKET, BY REGION,  2017–2022 (USD MILLION)
                    TABLE 22 SOLUTIONS: MARKET, BY REGION,  2023–2028 (USD MILLION)
           6.2.2 IDENTITY AND ACCESS MANAGEMENT (IAM)
           6.2.3 MICRO-SEGMENTATION
           6.2.4 ZERO TRUST NETWORK ACCESS (ZTNA)
           6.2.5 CONTINUOUS MONITORING
           6.2.6 LEAST PRIVILEGE ACCESS
    6.3 SERVICES 
           6.3.1 COMPREHENSIVE SERVICES TO EMPOWER ZERO TRUST ARCHITECTURE IMPLEMENTATION
                    TABLE 23 SERVICES: MARKET, BY REGION,  2017–2022 (USD MILLION)
                    TABLE 24 SERVICES: MARKET, BY REGION,  2023–2028 (USD MILLION)
 
7 ZERO TRUST ARCHITECTURE MARKET, BY ORGANIZATION SIZE (Page No. - 90)
    7.1 INTRODUCTION 
           7.1.1 ORGANIZATION SIZE: MARKET DRIVERS
                    FIGURE 25 LARGE ENTERPRISES TO DOMINATE DURING FORECAST PERIOD
                    TABLE 25 MARKET, BY ORGANIZATION SIZE,  2017–2022 (USD MILLION)
                    TABLE 26 MARKET, BY ORGANIZATION SIZE,  2023–2028 (USD MILLION)
    7.2 SMALL- AND MEDIUM-SIZED ENTERPRISES 
           7.2.1 SMES’ DIGITAL TRANSFORMATION TO SPUR ZERO TRUST ARCHITECTURE ADOPTION
                    TABLE 27 SMES: MARKET, BY REGION, 2017–2022 (USD MILLION)
                    TABLE 28 SMES: MARKET, BY REGION, 2023–2028 (USD MILLION)
    7.3 LARGE ENTERPRISES 
           7.3.1 TRANSFORMATIVE ADOPTION OF ZERO TRUST ARCHITECTURE IN LARGE ENTERPRISES TO CONTRIBUTE TO GROWTH
                    TABLE 29 LARGE ENTERPRISES: MARKET, BY REGION,  2017–2022 (USD MILLION)
                    TABLE 30 LARGE ENTERPRISES: MARKET, BY REGION,  2023–2028 (USD MILLION)
 
8 ZERO TRUST ARCHITECTURE MARKET, BY DEPLOYMENT MODE (Page No. - 95)
    8.1 INTRODUCTION 
           8.1.1 DEPLOYMENT MODE: MARKET DRIVERS
                    FIGURE 26 CLOUD TO DOMINATE DURING FORECAST PERIOD
                    TABLE 31 MARKET, BY DEPLOYMENT MODE,  2017–2022 (USD MILLION)
                    TABLE 32 MARKET, BY DEPLOYMENT MODE,  2023–2028 (USD MILLION)
    8.2 ON-PREMISES 
           8.2.1 CONTROL AND COMPLIANCE EASILY ACHIEVED THROUGH  ON-PREMISES ZERO TRUST DEPLOYMENT
                    TABLE 33 ON-PREMISES: MARKET, BY REGION,  2017–2022 (USD MILLION)
                    TABLE 34 ON-PREMISES: MARKET, BY REGION,  2023–2028 (USD MILLION)
    8.3 CLOUD 
           8.3.1 EMBRACING CLOUD DEPLOYMENT FOR ZERO TRUST DUE TO ADVANTAGES SUCH AS SECURITY AND SCALABILITY
                    TABLE 35 CLOUD: MARKET, BY REGION, 2017–2022 (USD MILLION)
                    TABLE 36 CLOUD: MARKET, BY REGION, 2023–2028 (USD MILLION)
 
9 ZERO TRUST ARCHITECTURE MARKET, BY VERTICAL (Page No. - 100)
    9.1 INTRODUCTION 
           9.1.1 VERTICAL: MARKET DRIVERS
                    FIGURE 27 RETAIL & ECOMMERCE SEGMENT TO ACHIEVE HIGHEST GROWTH RATE DURING FORECAST PERIOD
                    TABLE 37 MARKET, BY VERTICAL, 2017–2022 (USD MILLION)
                    TABLE 38 MARKET, BY VERTICAL, 2023–2028 (USD MILLION)
    9.2 BANKING, FINANCIAL SERVICES, AND INSURANCE (BFSI) 
           9.2.1 INCREASING DEMAND TO ADOPT ADVANCED SOLUTIONS AMID RISING CYBER THREATS TO DRIVE DEMAND FOR ZTA SOLUTIONS
                    TABLE 39 BFSI: MARKET, BY REGION, 2017–2022 (USD MILLION)
                    TABLE 40 BFSI: MARKET, BY REGION, 2023–2028 (USD MILLION)
    9.3 GOVERNMENT & DEFENSE 
           9.3.1 ZERO TRUST ARCHITECTURE TO ENHANCE CYBERSECURITY RESILIENCE IN GOVERNMENT & DEFENSE VERTICAL
                    TABLE 41 GOVERNMENT & DEFENSE: MARKET, BY REGION,  2017–2022 (USD MILLION)
                    TABLE 42 GOVERNMENT & DEFENSE: ZERO TRUST ARCHITECTURE MARKET, BY REGION,  2023–2028 (USD MILLION)
    9.4 IT & ITES 
           9.4.1 RISING COMPLEXITIES IN CYBERSECURITY TO PROPEL MARKET
                    TABLE 43 IT & ITES: MARKET, BY REGION, 2017–2022 (USD MILLION)
                    TABLE 44 IT & ITES: MARKET, BY REGION, 2023–2028 (USD MILLION)
    9.5 HEALTHCARE 
           9.5.1 INCREASING CYBER THREATS TO BOOST POPULARITY OF ZERO TRUST FRAMEWORK
                    TABLE 45 HEALTHCARE: MARKET, BY REGION,  2017–2022 (USD MILLION)
                    TABLE 46 HEALTHCARE: MARKET, BY REGION,  2023–2028 (USD MILLION)
    9.6 RETAIL & ECOMMERCE 
           9.6.1 ZERO TRUST ARCHITECTURE TO SECURE RETAIL AND ECOMMERCE IN DIGITAL TRANSFORMATION
                    TABLE 47 RETAIL & ECOMMERCE: MARKET, BY REGION,  2017–2022 (USD MILLION)
                    TABLE 48 RETAIL & ECOMMERCE: MARKET, BY REGION,  2023–2028 (USD MILLION)
    9.7 ENERGY & UTILITIES 
           9.7.1 DEMAND FOR HEIGHTENED CRITICAL INFRASTRUCTURE SECURITY TO FUEL ADOPTION OF ZERO TRUST ARCHITECTURE SOLUTIONS
                    TABLE 49 ENERGY & UTILITIES: MARKET, BY REGION,  2017–2022 (USD MILLION)
                    TABLE 50 ENERGY & UTILITIES: MARKET, BY REGION,  2023–2028 (USD MILLION)
    9.8 OTHER VERTICALS 
           TABLE 51 OTHER VERTICALS: MARKET, BY REGION,  2017–2022 (USD MILLION)
           TABLE 52 OTHER VERTICALS: MARKET, BY REGION,  2023–2028 (USD MILLION)
 
10 ZERO TRUST ARCHITECTURE MARKET, BY REGION (Page No. - 112)
     10.1 INTRODUCTION 
               FIGURE 28 ASIA PACIFIC TO GROW AT HIGHEST CAGR DURING FORECAST PERIOD
               TABLE 53 MARKET, BY REGION, 2017–2022 (USD MILLION)
               TABLE 54 MARKET, BY REGION, 2023–2028 (USD MILLION)
     10.2 NORTH AMERICA 
             10.2.1 NORTH AMERICA: MARKET DRIVERS
             10.2.2 NORTH AMERICA: RECESSION IMPACT
             10.2.3 NORTH AMERICA: REGULATORY LANDSCAPE
                       FIGURE 29 NORTH AMERICA: ZERO TRUST ARCHITECTURE MARKET SNAPSHOT
                       TABLE 55 NORTH AMERICA: MARKET, BY OFFERING,  2017–2022 (USD MILLION)
                       TABLE 56 NORTH AMERICA: MARKET, BY OFFERING,  2023–2028 (USD MILLION)
                       TABLE 57 NORTH AMERICA: MARKET, BY ORGANIZATION SIZE,  2017–2022 (USD MILLION)
                       TABLE 58 NORTH AMERICA: MARKET, BY ORGANIZATION SIZE,  2023–2028 (USD MILLION)
                       TABLE 59 NORTH AMERICA: MARKET, BY DEPLOYMENT MODE,  2017–2022 (USD MILLION)
                       TABLE 60 NORTH AMERICA: MARKET, BY DEPLOYMENT MODE,  2023–2028 (USD MILLION)
                       TABLE 61 NORTH AMERICA: MARKET, BY VERTICAL,  2017–2022 (USD MILLION)
                       TABLE 62 NORTH AMERICA: MARKET, BY VERTICAL,  2023–2028 (USD MILLION)
                       TABLE 63 NORTH AMERICA: MARKET, BY COUNTRY,  2017–2022 (USD MILLION)
                       TABLE 64 NORTH AMERICA: MARKET, BY COUNTRY,  2023–2028 (USD MILLION)
             10.2.4 US
                       10.2.4.1 Rising cybersecurity concerns to prompt US government’s zero trust initiatives
                                   TABLE 65 US: ZERO TRUST ARCHITECTURE MARKET, BY OFFERING, 2017–2022 (USD MILLION)
                                   TABLE 66 US: MARKET, BY OFFERING, 2023–2028 (USD MILLION)
                                   TABLE 67 US: MARKET, BY ORGANIZATION SIZE,  2017–2022 (USD MILLION)
                                   TABLE 68 US: MARKET, BY ORGANIZATION SIZE,  2023–2028 (USD MILLION)
                                   TABLE 69 US: MARKET, BY DEPLOYMENT MODE,  2017–2022 (USD MILLION)
                                   TABLE 70 US: MARKET, BY DEPLOYMENT MODE,  2023–2028 (USD MILLION)
                                   TABLE 71 US: MARKET, BY VERTICAL, 2017–2022 (USD MILLION)
                                   TABLE 72 US: MARKET, BY VERTICAL, 2023–2028 (USD MILLION)
             10.2.5 CANADA
                       10.2.5.1 Initiatives taken by government to drive adoption of zero trust architecture
                                   TABLE 73 CANADA: ZERO TRUST ARCHITECTURE MARKET, BY OFFERING,  2017–2022 (USD MILLION)
                                   TABLE 74 CANADA: MARKET, BY OFFERING,  2023–2028 (USD MILLION)
                                   TABLE 75 CANADA: MARKET, BY ORGANIZATION SIZE,  2017–2022 (USD MILLION)
                                   TABLE 76 CANADA: MARKET, BY ORGANIZATION SIZE,  2023–2028 (USD MILLION)
                                   TABLE 77 CANADA: MARKET, BY DEPLOYMENT MODE,  2017–2022 (USD MILLION)
                                   TABLE 78 CANADA: MARKET, BY DEPLOYMENT MODE,  2023–2028 (USD MILLION)
                                   TABLE 79 CANADA: MARKET, BY VERTICAL,  2017–2022 (USD MILLION)
                                   TABLE 80 CANADA: MARKET, BY VERTICAL,  2023–2028 (USD MILLION)
     10.3 EUROPE 
             10.3.1 EUROPE: MARKET DRIVERS
             10.3.2 EUROPE: RECESSION IMPACT
             10.3.3 EUROPE: REGULATORY LANDSCAPE
                       TABLE 81 EUROPE: ZERO TRUST ARCHITECTURE MARKET, BY OFFERING,  2017–2022 (USD MILLION)
                       TABLE 82 EUROPE: MARKET, BY OFFERING,  2023–2028 (USD MILLION)
                       TABLE 83 EUROPE: MARKET, BY ORGANIZATION SIZE,  2017–2022 (USD MILLION)
                       TABLE 84 EUROPE: MARKET, BY ORGANIZATION SIZE,  2023–2028 (USD MILLION)
                       TABLE 85 EUROPE: MARKET, BY DEPLOYMENT MODE,  2017–2022 (USD MILLION)
                       TABLE 86 EUROPE: MARKET, BY DEPLOYMENT MODE,  2023–2028 (USD MILLION)
                       TABLE 87 EUROPE: MARKET, BY VERTICAL, 2017–2022 (USD MILLION)
                       TABLE 88 EUROPE: MARKET, BY VERTICAL, 2023–2028 (USD MILLION)
                       TABLE 89 EUROPE: MARKET, BY COUNTRY, 2017–2022 (USD MILLION)
                       TABLE 90 EUROPE: MARKET, BY COUNTRY, 2023–2028 (USD MILLION)
             10.3.4 UK
                       10.3.4.1 UK enterprises to embrace zero trust for enhanced cybersecurity
                                   TABLE 91 UK: ZERO TRUST ARCHITECTURE MARKET, BY OFFERING, 2017–2022 (USD MILLION)
                                   TABLE 92 UK: MARKET, BY OFFERING, 2023–2028 (USD MILLION)
                                   TABLE 93 UK: MARKET, BY ORGANIZATION SIZE,  2017–2022 (USD MILLION)
                                   TABLE 94 UK: MARKET, BY ORGANIZATION SIZE,  2023–2028 (USD MILLION)
                                   TABLE 95 UK: MARKET, BY DEPLOYMENT MODE,  2017–2022 (USD MILLION)
                                   TABLE 96 UK: MARKET, BY DEPLOYMENT MODE,  2023–2028 (USD MILLION)
                                   TABLE 97 UK: MARKET, BY VERTICAL, 2017–2022 (USD MILLION)
                                   TABLE 98 UK: MARKET, BY VERTICAL, 2023–2028 (USD MILLION)
             10.3.5 GERMANY
                       10.3.5.1 Germany to accelerate adoption of zero trust amid digital growth
                                   TABLE 99 GERMANY: ZERO TRUST ARCHITECTURE MARKET, BY OFFERING,  2017–2022 (USD MILLION)
                                   TABLE 100 GERMANY: MARKET, BY OFFERING,  2023–2028 (USD MILLION)
                                   TABLE 101 GERMANY: MARKET, BY ORGANIZATION SIZE,  2017–2022 (USD MILLION)
                                   TABLE 102 GERMANY: MARKET, BY ORGANIZATION SIZE,  2023–2028 (USD MILLION)
                                   TABLE 103 GERMANY: MARKET, BY DEPLOYMENT MODE,  2017–2022 (USD MILLION)
                                   TABLE 104 GERMANY: MARKET, BY DEPLOYMENT MODE,  2023–2028 (USD MILLION)
                                   TABLE 105 GERMANY: MARKET, BY VERTICAL,  2017–2022 (USD MILLION)
                                   TABLE 106 GERMANY: MARKET, BY VERTICAL,  2023–2028 (USD MILLION)
             10.3.6 FRANCE
                       10.3.6.1 Need for robust cybersecurity to drive zero trust adoption in France
                                   TABLE 107 FRANCE: ZERO TRUST ARCHITECTURE MARKET, BY OFFERING,  2017–2022 (USD MILLION)
                                   TABLE 108 FRANCE: MARKET, BY OFFERING,  2023–2028 (USD MILLION)
                                   TABLE 109 FRANCE: MARKET, BY ORGANIZATION SIZE,  2017–2022 (USD MILLION)
                                   TABLE 110 FRANCE: MARKET, BY ORGANIZATION SIZE,  2023–2028 (USD MILLION)
                                   TABLE 111 FRANCE: MARKET, BY DEPLOYMENT MODE,  2017–2022 (USD MILLION)
                                   TABLE 112 FRANCE: MARKET, BY DEPLOYMENT MODE,  2023–2028 (USD MILLION)
                                   TABLE 113 FRANCE: MARKET, BY VERTICAL, 2017–2022 (USD MILLION)
                                   TABLE 114 FRANCE: MARKET, BY VERTICAL, 2023–2028 (USD MILLION)
             10.3.7 ITALY
                       10.3.7.1 Zero trust architecture adoption in Italy to soar amid cloud security focus
                                   TABLE 115 ITALY: ZERO TRUST ARCHITECTURE MARKET, BY OFFERING, 2017–2022 (USD MILLION)
                                   TABLE 116 ITALY: MARKET, BY OFFERING, 2023–2028 (USD MILLION)
                                   TABLE 117 ITALY: MARKET, BY ORGANIZATION SIZE,  2017–2022 (USD MILLION)
                                   TABLE 118 ITALY: MARKET, BY ORGANIZATION SIZE,  2023–2028 (USD MILLION)
                                   TABLE 119 ITALY: MARKET, BY DEPLOYMENT MODE,  2017–2022 (USD MILLION)
                                   TABLE 120 ITALY: MARKET, BY DEPLOYMENT MODE,  2023–2028 (USD MILLION)
                                   TABLE 121 ITALY: MARKET, BY VERTICAL, 2017–2022 (USD MILLION)
                                   TABLE 122 ITALY: MARKET, BY VERTICAL, 2023–2028 (USD MILLION)
             10.3.8 REST OF EUROPE
                       TABLE 123 REST OF EUROPE: ZERO TRUST ARCHITECTURE MARKET, BY OFFERING,  2017–2022 (USD MILLION)
                       TABLE 124 REST OF EUROPE: MARKET, BY OFFERING,  2023–2028 (USD MILLION)
                       TABLE 125 REST OF EUROPE: MARKET, BY ORGANIZATION SIZE,  2017–2022 (USD MILLION)
                       TABLE 126 REST OF EUROPE: MARKET, BY ORGANIZATION SIZE,  2023–2028 (USD MILLION)
                       TABLE 127 REST OF EUROPE: MARKET, BY DEPLOYMENT MODE,  2017–2022 (USD MILLION)
                       TABLE 128 REST OF EUROPE: MARKET, BY DEPLOYMENT MODE,  2023–2028 (USD MILLION)
                       TABLE 129 REST OF EUROPE: MARKET, BY VERTICAL,  2017–2022 (USD MILLION)
                       TABLE 130 REST OF EUROPE: MARKET, BY VERTICAL,  2023–2028 (USD MILLION)
     10.4 ASIA PACIFIC 
             10.4.1 ASIA PACIFIC: MARKET DRIVERS
             10.4.2 ASIA PACIFIC: RECESSION IMPACT
             10.4.3 ASIA PACIFIC: REGULATORY LANDSCAPE
                       FIGURE 30 ASIA PACIFIC: ZERO TRUST ARCHITECTURE MARKET SNAPSHOT
                       TABLE 131 ASIA PACIFIC: MARKET, BY OFFERING,  2017–2022 (USD MILLION)
                       TABLE 132 ASIA PACIFIC: MARKET, BY OFFERING,  2023–2028 (USD MILLION)
                       TABLE 133 ASIA PACIFIC: MARKET, BY ORGANIZATION SIZE,  2017–2022 (USD MILLION)
                       TABLE 134 ASIA PACIFIC: MARKET, BY ORGANIZATION SIZE,  2023–2028 (USD MILLION)
                       TABLE 135 ASIA PACIFIC: MARKET, BY DEPLOYMENT MODE,  2017–2022 (USD MILLION)
                       TABLE 136 ASIA PACIFIC: MARKET, BY DEPLOYMENT MODE,  2023–2028 (USD MILLION)
                       TABLE 137 ASIA PACIFIC: MARKET, BY VERTICAL,  2017–2022 (USD MILLION)
                       TABLE 138 ASIA PACIFIC: MARKET, BY VERTICAL,  2023–2028 (USD MILLION)
                       TABLE 139 ASIA PACIFIC: MARKET, BY COUNTRY,  2017–2022 (USD MILLION)
                       TABLE 140 ASIA PACIFIC: MARKET, BY COUNTRY,  2023–2028 (USD MILLION)
             10.4.4 CHINA
                       10.4.4.1 Enhancing mobile security and networking with zero trust to drive market growth
                                   TABLE 141 CHINA: ZERO TRUST ARCHITECTURE MARKET, BY OFFERING, 2017–2022 (USD MILLION)
                                   TABLE 142 CHINA: MARKET, BY OFFERING, 2023–2028 (USD MILLION)
                                   TABLE 143 CHINA: MARKET, BY ORGANIZATION SIZE,  2017–2022 (USD MILLION)
                                   TABLE 144 CHINA: MARKET, BY ORGANIZATION SIZE,  2023–2028 (USD MILLION)
                                   TABLE 145 CHINA: MARKET, BY DEPLOYMENT MODE,  2017–2022 (USD MILLION)
                                   TABLE 146 CHINA: MARKET, BY DEPLOYMENT MODE,  2023–2028 (USD MILLION)
                                   TABLE 147 CHINA: MARKET, BY VERTICAL, 2017–2022 (USD MILLION)
                                   TABLE 148 CHINA: MARKET, BY VERTICAL, 2023–2028 (USD MILLION)
             10.4.5 JAPAN
                       10.4.5.1 Increasing cyberattack threats to drive demand for zero trust
                                   TABLE 149 JAPAN: ZERO TRUST ARCHITECTURE MARKET, BY OFFERING, 2017–2022 (USD MILLION)
                                   TABLE 150 JAPAN: MARKET, BY OFFERING, 2023–2028 (USD MILLION)
                                   TABLE 151 JAPAN: MARKET, BY ORGANIZATION SIZE,  2017–2022 (USD MILLION)
                                   TABLE 152 JAPAN: MARKET, BY ORGANIZATION SIZE,  2023–2028 (USD MILLION)
                                   TABLE 153 JAPAN: MARKET, BY DEPLOYMENT MODE,  2017–2022 (USD MILLION)
                                   TABLE 154 JAPAN: MARKET, BY DEPLOYMENT MODE,  2023–2028 (USD MILLION)
                                   TABLE 155 JAPAN: MARKET, BY VERTICAL, 2017–2022 (USD MILLION)
                                   TABLE 156 JAPAN: MARKET, BY VERTICAL, 2023–2028 (USD MILLION)
             10.4.6 INDIA
                       10.4.6.1 Increasing economic growth and digital advancement to drive adoption of zero trust in India
                                   TABLE 157 INDIA: ZERO TRUST ARCHITECTURE MARKET, BY OFFERING, 2017–2022 (USD MILLION)
                                   TABLE 158 INDIA: MARKET, BY OFFERING, 2023–2028 (USD MILLION)
                                   TABLE 159 INDIA: MARKET, BY ORGANIZATION SIZE,  2017–2022 (USD MILLION)
                                   TABLE 160 INDIA: MARKET, BY ORGANIZATION SIZE,  2023–2028 (USD MILLION)
                                   TABLE 161 INDIA: MARKET, BY DEPLOYMENT MODE,  2017–2022 (USD MILLION)
                                   TABLE 162 INDIA: MARKET, BY DEPLOYMENT MODE,  2023–2028 (USD MILLION)
                                   TABLE 163 INDIA: MARKET, BY VERTICAL, 2017–2022 (USD MILLION)
                                   TABLE 164 INDIA: MARKET, BY VERTICAL, 2023–2028 (USD MILLION)
             10.4.7 REST OF ASIA PACIFIC
                       TABLE 165 REST OF ASIA PACIFIC: ZERO TRUST ARCHITECTURE MARKET, BY OFFERING,  2017–2022 (USD MILLION)
                       TABLE 166 REST OF ASIA PACIFIC: MARKET, BY OFFERING,  2023–2028 (USD MILLION)
                       TABLE 167 REST OF ASIA PACIFIC: MARKET, BY ORGANIZATION SIZE, 2017–2022 (USD MILLION)
                       TABLE 168 REST OF ASIA PACIFIC: MARKET, BY ORGANIZATION SIZE, 2023–2028 (USD MILLION)
                       TABLE 169 REST OF ASIA PACIFIC: MARKET, BY DEPLOYMENT MODE, 2017–2022 (USD MILLION)
                       TABLE 170 REST OF ASIA PACIFIC: MARKET, BY DEPLOYMENT MODE, 2023–2028 (USD MILLION)
                       TABLE 171 REST OF ASIA PACIFIC: MARKET, BY VERTICAL,  2017–2022 (USD MILLION)
                       TABLE 172 REST OF ASIA PACIFIC: MARKET, BY VERTICAL,  2023–2028 (USD MILLION)
     10.5 MIDDLE EAST & AFRICA 
             10.5.1 MIDDLE EAST & AFRICA: MARKET DRIVERS
             10.5.2 MIDDLE EAST & AFRICA: RECESSION IMPACT
             10.5.3 MIDDLE EAST & AFRICA: REGULATORY LANDSCAPE
                       TABLE 173 MIDDLE EAST & AFRICA: ZERO TRUST ARCHITECTURE MARKET, BY OFFERING,  2017–2022 (USD MILLION)
                       TABLE 174 MIDDLE EAST & AFRICA: MARKET, BY OFFERING,  2023–2028 (USD MILLION)
                       TABLE 175 MIDDLE EAST & AFRICA: MARKET, BY ORGANIZATION SIZE, 2017–2022 (USD MILLION)
                       TABLE 176 MIDDLE EAST & AFRICA: MARKET, BY ORGANIZATION SIZE, 2023–2028 (USD MILLION)
                       TABLE 177 MIDDLE EAST & AFRICA: MARKET, BY DEPLOYMENT MODE, 2017–2022 (USD MILLION)
                       TABLE 178 MIDDLE EAST & AFRICA: MARKET, BY DEPLOYMENT MODE, 2023–2028 (USD MILLION)
                       TABLE 179 MIDDLE EAST & AFRICA: MARKET, BY VERTICAL,  2017–2022 (USD MILLION)
                       TABLE 180 MIDDLE EAST & AFRICA: MARKET, BY VERTICAL,  2023–2028 (USD MILLION)
                       TABLE 181 MIDDLE EAST & AFRICA: MARKET, BY REGION,  2017–2022 (USD MILLION)
                       TABLE 182 MIDDLE EAST & AFRICA: MARKET, BY REGION,  2023–2028 (USD MILLION)
             10.5.4 MIDDLE EAST
                       10.5.4.1 Rise in cloud-first strategy to drive adoption of zero trust
                                   TABLE 183 MIDDLE EAST: ZERO TRUST ARCHITECTURE MARKET, BY OFFERING,  2017–2022 (USD MILLION)
                                   TABLE 184 MIDDLE EAST: MARKET, BY OFFERING,  2023–2028 (USD MILLION)
                                   TABLE 185 MIDDLE EAST: MARKET, BY ORGANIZATION SIZE,  2017–2022 (USD MILLION)
                                   TABLE 186 MIDDLE EAST: MARKET, BY ORGANIZATION SIZE,  2023–2028 (USD MILLION)
                                   TABLE 187 MIDDLE EAST: MARKET, BY DEPLOYMENT MODE,  2017–2022 (USD MILLION)
                                   TABLE 188 MIDDLE EAST: MARKET, BY DEPLOYMENT MODE,  2023–2028 (USD MILLION)
                                   TABLE 189 MIDDLE EAST: MARKET, BY VERTICAL,  2017–2022 (USD MILLION)
                                   TABLE 190 MIDDLE EAST: MARKET, BY VERTICAL,  2023–2028 (USD MILLION)
                                   TABLE 191 MIDDLE EAST: MARKET, BY COUNTRY,  2017–2022 (USD MILLION)
                                   TABLE 192 MIDDLE EAST: MARKET, BY COUNTRY,  2023–2028 (USD MILLION)
             10.5.5 GCC
                       10.5.5.1 Evolving digital landscape in GCC to contribute to market growth
                                   TABLE 193 GCC: ZERO TRUST ARCHITECTURE MARKET, BY OFFERING, 2017–2022 (USD MILLION)
                                   TABLE 194 GCC: MARKET, BY OFFERING, 2023–2028 (USD MILLION)
                                   TABLE 195 GCC: MARKET, BY ORGANIZATION SIZE,  2017–2022 (USD MILLION)
                                   TABLE 196 GCC: MARKET, BY ORGANIZATION SIZE,  2023–2028 (USD MILLION)
                                   TABLE 197 GCC: MARKET, BY DEPLOYMENT MODE,  2017–2022 (USD MILLION)
                                   TABLE 198 GCC: MARKET, BY DEPLOYMENT MODE,  2023–2028 (USD MILLION)
                                   TABLE 199 GCC: MARKET, BY VERTICAL, 2017–2022 (USD MILLION)
                                   TABLE 200 GCC: MARKET, BY VERTICAL, 2023–2028 (USD MILLION)
             10.5.6 REST OF MIDDLE EAST
                       TABLE 201 REST OF MIDDLE EAST: ZERO TRUST ARCHITECTURE MARKET, BY OFFERING,  2017–2022 (USD MILLION)
                       TABLE 202 REST OF MIDDLE EAST: MARKET, BY OFFERING,  2023–2028 (USD MILLION)
                       TABLE 203 REST OF MIDDLE EAST: MARKET, BY ORGANIZATION SIZE, 2017–2022 (USD MILLION)
                       TABLE 204 REST OF MIDDLE EAST: MARKET, BY ORGANIZATION SIZE, 2023–2028 (USD MILLION)
                       TABLE 205 REST OF MIDDLE EAST: MARKET, BY DEPLOYMENT MODE, 2017–2022 (USD MILLION)
                       TABLE 206 REST OF MIDDLE EAST: MARKET, BY DEPLOYMENT MODE, 2023–2028 (USD MILLION)
                       TABLE 207 REST OF MIDDLE EAST: MARKET, BY VERTICAL,  2017–2022 (USD MILLION)
                       TABLE 208 REST OF MIDDLE EAST: MARKET, BY VERTICAL,  2023–2028 (USD MILLION)
             10.5.7 AFRICA
                       10.5.7.1 Zero trust architecture to gain momentum in African industries
                                   TABLE 209 AFRICA: ZERO TRUST ARCHITECTURE MARKET, BY OFFERING, 2017–2022 (USD MILLION)
                                   TABLE 210 AFRICA: MARKET, BY OFFERING, 2023–2028 (USD MILLION)
                                   TABLE 211 AFRICA: MARKET, BY ORGANIZATION SIZE,  2017–2022 (USD MILLION)
                                   TABLE 212 AFRICA: MARKET, BY ORGANIZATION SIZE,  2023–2028 (USD MILLION)
                                   TABLE 213 AFRICA: MARKET, BY DEPLOYMENT MODE,  2017–2022 (USD MILLION)
                                   TABLE 214 AFRICA: MARKET, BY DEPLOYMENT MODE,  2023–2028 (USD MILLION)
                                   TABLE 215 AFRICA: MARKET, BY VERTICAL, 2017–2022 (USD MILLION)
                                   TABLE 216 AFRICA: MARKET, BY VERTICAL, 2023–2028 (USD MILLION)
     10.6 LATIN AMERICA 
             10.6.1 LATIN AMERICA: MARKET DRIVERS
             10.6.2 LATIN AMERICA: RECESSION IMPACT
             10.6.3 LATIN AMERICA: REGULATORY LANDSCAPE
                       TABLE 217 LATIN AMERICA: ZERO TRUST ARCHITECTURE MARKET, BY OFFERING,  2017–2022 (USD MILLION)
                       TABLE 218 LATIN AMERICA: MARKET, BY OFFERING,  2023–2028 (USD MILLION)
                       TABLE 219 LATIN AMERICA: MARKET, BY ORGANIZATION SIZE,  2017–2022 (USD MILLION)
                       TABLE 220 LATIN AMERICA: MARKET, BY ORGANIZATION SIZE,  2023–2028 (USD MILLION)
                       TABLE 221 LATIN AMERICA: MARKET, BY DEPLOYMENT MODE,  2017–2022 (USD MILLION)
                       TABLE 222 LATIN AMERICA: MARKET, BY DEPLOYMENT MODE,  2023–2028 (USD MILLION)
                       TABLE 223 LATIN AMERICA: MARKET, BY VERTICAL,  2017–2022 (USD MILLION)
                       TABLE 224 LATIN AMERICA: MARKET, BY VERTICAL,  2023–2028 (USD MILLION)
                       TABLE 225 LATIN AMERICA: MARKET, BY COUNTRY,  2017–2022 (USD MILLION)
                       TABLE 226 LATIN AMERICA: MARKET, BY COUNTRY,  2023–2028 (USD MILLION)
             10.6.4 BRAZIL
                       10.6.4.1 Zero trust adoption to soar in Brazil amid surge in pandemic-driven cyberattacks
                                   TABLE 227 BRAZIL: ZERO TRUST ARCHITECTURE MARKET, BY OFFERING, 2017–2022 (USD MILLION)
                                   TABLE 228 BRAZIL: MARKET, BY OFFERING, 2023–2028 (USD MILLION)
                                   TABLE 229 BRAZIL: MARKET, BY ORGANIZATION SIZE,  2017–2022 (USD MILLION)
                                   TABLE 230 BRAZIL: MARKET, BY ORGANIZATION SIZE,  2023–2028 (USD MILLION)
                                   TABLE 231 BRAZIL: MARKET, BY DEPLOYMENT MODE,  2017–2022 (USD MILLION)
                                   TABLE 232 BRAZIL: MARKET, BY DEPLOYMENT MODE,  2023–2028 (USD MILLION)
                                   TABLE 233 BRAZIL: MARKET, BY VERTICAL, 2017–2022 (USD MILLION)
                                   TABLE 234 BRAZIL: MARKET, BY VERTICAL, 2023–2028 (USD MILLION)
             10.6.5 MEXICO
                       10.6.5.1 Mexico to embrace zero trust and XDR for cybersecurity advancement
                                   TABLE 235 MEXICO: ZERO TRUST ARCHITECTURE MARKET, BY OFFERING,  2017–2022 (USD MILLION)
                                   TABLE 236 MEXICO: MARKET, BY OFFERING,  2023–2028 (USD MILLION)
                                   TABLE 237 MEXICO: MARKET, BY ORGANIZATION SIZE,  2017–2022 (USD MILLION)
                                   TABLE 238 MEXICO: MARKET, BY ORGANIZATION SIZE,  2023–2028 (USD MILLION)
                                   TABLE 239 MEXICO: MARKET, BY DEPLOYMENT MODE,  2017–2022 (USD MILLION)
                                   TABLE 240 MEXICO: MARKET, BY DEPLOYMENT MODE,  2023–2028 (USD MILLION)
                                   TABLE 241 MEXICO: MARKET, BY VERTICAL, 2017–2022 (USD MILLION)
                                   TABLE 242 MEXICO: MARKET, BY VERTICAL, 2023–2028 (USD MILLION)
             10.6.6 REST OF LATIN AMERICA
                       TABLE 243 REST OF LATIN AMERICA: ZERO TRUST ARCHITECTURE MARKET, BY OFFERING,  2017–2022 (USD MILLION)
                       TABLE 244 REST OF LATIN AMERICA: MARKET, BY OFFERING,  2023–2028 (USD MILLION)
                       TABLE 245 REST OF LATIN AMERICA: MARKET, BY ORGANIZATION SIZE, 2017–2022 (USD MILLION)
                       TABLE 246 REST OF LATIN AMERICA: MARKET, BY ORGANIZATION SIZE, 2023–2028 (USD MILLION)
                       TABLE 247 REST OF LATIN AMERICA: MARKET, BY DEPLOYMENT MODE, 2017–2022 (USD MILLION)
                       TABLE 248 REST OF LATIN AMERICA: MARKET, BY DEPLOYMENT MODE, 2023–2028 (USD MILLION)
                       TABLE 249 REST OF LATIN AMERICA: MARKET, BY VERTICAL,  2017–2022 (USD MILLION)
                       TABLE 250 REST OF LATIN AMERICA: MARKET, BY VERTICAL,  2023–2028 (USD MILLION)
 
11 COMPETITIVE LANDSCAPE (Page No. - 185)
     11.1 KEY PLAYER STRATEGIES/RIGHT TO WIN 
     11.2 REVENUE ANALYSIS 
               FIGURE 31 TOP 5 PLAYERS HAVE DOMINATED THE MARKET IN LAST 5 YEARS
     11.3 MARKET SHARE ANALYSIS 
               FIGURE 32 SHARE OF LEADING COMPANIES IN MARKET
               TABLE 251 ZERO TRUST ARCHITECTURE MARKET: DEGREE OF COMPETITION
     11.4 COMPANY EVALUATION MATRIX 
             11.4.1 STARS
             11.4.2 EMERGING LEADERS
             11.4.3 PERVASIVE PLAYERS
             11.4.4 PARTICIPANTS
                       FIGURE 33 MARKET: COMPANY EVALUATION MATRIX, 2022
             11.4.5 COMPANY FOOTPRINT
                       FIGURE 34 PRODUCT FOOTPRINT
                       TABLE 252 VERTICAL FOOTPRINT
                       TABLE 253 REGION FOOTPRINT
                       TABLE 254 COMPANY FOOTPRINT
     11.5 START-UP/SME EVALUATION MATRIX 
             11.5.1 PROGRESSIVE COMPANIES
             11.5.2 RESPONSIVE COMPANIES
             11.5.3 DYNAMIC COMPANIES
             11.5.4 STARTING BLOCKS
                       FIGURE 35 MARKET: START-UP/SME EVALUATION MATRIX, 2022
             11.5.5 COMPETITIVE BENCHMARKING
                       TABLE 255 MARKET: DETAILED LIST OF KEY STARTUPS/SMES
                       TABLE 256 COMPETITIVE BENCHMARKING OF KEY STARTUPS/SMES: VERTICAL FOOTPRINT
                       TABLE 257 COMPETITIVE BENCHMARKING OF KEY STARTUPS/SMES: REGION FOOTPRINT
     11.6 COMPETITIVE SCENARIO AND TRENDS 
             11.6.1 PRODUCT LAUNCHES & ENHANCEMENTS
                       TABLE 258 MARKET: PRODUCT LAUNCHES & ENHANCEMENTS,  2021–2023
             11.6.2 DEALS
                       TABLE 259 ZERO TRUST ARCHITECTURE MARKET: DEALS, 2021–2023
 
12 COMPANY PROFILES (Page No. - 210)
(Business overview, Products/Solutions/Services offered, Recent developments & MnM View)*
     12.1 KEY PLAYERS 
             12.1.1 PALO ALTO NETWORKS
                       TABLE 260 PALO ALTO NETWORKS: BUSINESS OVERVIEW
                       FIGURE 36 PALO ALTO NETWORKS: COMPANY SNAPSHOT
                       TABLE 261 PALO ALTO NETWORKS: PRODUCTS/SOLUTIONS/SERVICES OFFERED
                       TABLE 262 PALO ALTO NETWORKS: PRODUCT LAUNCHES & ENHANCEMENTS
                       TABLE 263 PALO ALTO NETWORKS: DEALS
             12.1.2 VMWARE
                       TABLE 264 VMWARE: BUSINESS OVERVIEW
                       FIGURE 37 VMWARE: COMPANY SNAPSHOT
                       TABLE 265 VMWARE: PRODUCTS/SOLUTIONS/SERVICES OFFERED
                       TABLE 266 VMWARE: PRODUCT LAUNCHES & ENHANCEMENTS
                       TABLE 267 VMWARE: DEALS
             12.1.3 ZSCALER
                       TABLE 268 ZSCALER: BUSINESS OVERVIEW
                       FIGURE 38 ZSCALER: COMPANY SNAPSHOT
                       TABLE 269 ZSCALER: PRODUCTS/SOLUTIONS/SERVICES OFFERED
                       TABLE 270 ZSCALER: PRODUCT LAUNCHES & ENHANCEMENTS
                       TABLE 271 ZSCALER: DEALS
             12.1.4 AKAMAI
                       TABLE 272 AKAMAI: BUSINESS OVERVIEW
                       FIGURE 39 AKAMAI: COMPANY SNAPSHOT
                       TABLE 273 AKAMAI: PRODUCTS/SOLUTIONS/SERVICES OFFERED
                       TABLE 274 AKAMAI: PRODUCT LAUNCHES & ENHANCEMENTS
                       TABLE 275 AKAMAI: DEALS
             12.1.5 MICROSOFT
                       TABLE 276 MICROSOFT: BUSINESS OVERVIEW
                       FIGURE 40 MICROSOFT: COMPANY SNAPSHOT
                       TABLE 277 MICROSOFT: PRODUCTS/SOLUTIONS/SERVICES OFFERED
                       TABLE 278 MICROSOFT: PRODUCT LAUNCHES & ENHANCEMENTS
                       TABLE 279 MICROSOFT: DEALS
             12.1.6 CISCO
                       TABLE 280 CISCO: BUSINESS OVERVIEW
                       FIGURE 41 CISCO: COMPANY SNAPSHOT
                       TABLE 281 CISCO: PRODUCTS/SOLUTIONS/SERVICES OFFERED
                       TABLE 282 CISCO: DEALS
             12.1.7 IBM
                       TABLE 283 IBM: BUSINESS OVERVIEW
                       FIGURE 42 IBM: COMPANY SNAPSHOT
                       TABLE 284 IBM: PRODUCTS/SOLUTIONS/SERVICES OFFERED
                       TABLE 285 IBM: PRODUCT LAUNCHES & ENHANCEMENTS
                       TABLE 286 IBM: DEALS
             12.1.8 CITRIX
                       TABLE 287 CITRIX: BUSINESS OVERVIEW
                       TABLE 288 CITRIX: PRODUCTS/SOLUTIONS/SERVICES OFFERED
                       TABLE 289 CITRIX: PRODUCT LAUNCHES & ENHANCEMENTS
                       TABLE 290 CITRIX: DEALS
             12.1.9 CHECK POINT
                       TABLE 291 CHECK POINT: BUSINESS OVERVIEW
                       FIGURE 43 CHECK POINT: COMPANY SNAPSHOT
                       TABLE 292 CHECK POINT: PRODUCTS/SOLUTIONS/SERVICES OFFERED
                       TABLE 293 CHECK POINT: PRODUCT LAUNCHES & ENHANCEMENTS
                       TABLE 294 CHECK POINT: DEALS
             12.1.10 TRELLIX
                       TABLE 295 TRELLIX: BUSINESS OVERVIEW
                       TABLE 296 TRELLIX: PRODUCTS/SOLUTIONS/SERVICES OFFERED
                       TABLE 297 TRELLIX: PRODUCT LAUNCHES & ENHANCEMENTS
             12.1.11 FORCEPOINT
                       TABLE 298 FORCEPOINT: BUSINESS OVERVIEW
                       TABLE 299 FORCEPOINT: PRODUCTS/SOLUTIONS/SERVICES OFFERED
                       TABLE 300 FORCEPOINT: PRODUCT LAUNCHES & ENHANCEMENTS
                       TABLE 301 FORCEPOINT: DEALS
             12.1.12 CROWDSTRIKE
                       TABLE 302 CROWDSTRIKE: BUSINESS OVERVIEW
                       FIGURE 44 CROWDSTRIKE: COMPANY SNAPSHOT
                       TABLE 303 CROWDSTRIKE: PRODUCTS/SOLUTIONS/SERVICES OFFERED
                       TABLE 304 CROWDSTRIKE: DEALS
             12.1.13 CLOUDFLARE
                       TABLE 305 CLOUDFLARE: BUSINESS OVERVIEW
                       FIGURE 45 CLOUDFLARE: COMPANY SNAPSHOT
                       TABLE 306 CLOUDFLARE: PRODUCTS/SOLUTIONS/SERVICES OFFERED
                       TABLE 307 CLOUDFLARE: PRODUCT LAUNCHES & ENHANCEMENTS
                       TABLE 308 CLOUDFLARE: DEALS
             12.1.14 FORTINET
                       TABLE 309 FORTINET: BUSINESS OVERVIEW
                       FIGURE 46 FORTINET: COMPANY SNAPSHOT
                       TABLE 310 FORTINET: PRODUCTS/SOLUTIONS/SERVICES OFFERED
                       TABLE 311 FORTINET: PRODUCT LAUNCHES & ENHANCEMENTS
                       TABLE 312 FORTINET: DEALS
             12.1.15 GOOGLE
                       TABLE 313 GOOGLE: BUSINESS OVERVIEW
                       FIGURE 47 GOOGLE: COMPANY SNAPSHOT
                       TABLE 314 GOOGLE: PRODUCTS/SOLUTIONS/SERVICES OFFERED
                       TABLE 315 GOOGLE: PRODUCT LAUNCHES & ENHANCEMENTS
                       TABLE 316 GOOGLE: DEALS
*Details on Business overview, Products/Solutions/Services offered, Recent developments & MnM View might not be captured in case of unlisted companies.
     12.2 OTHER KEY PLAYERS 
             12.2.1 NETSKOPE
             12.2.2 PERIMETER 81
             12.2.3 TWINGATE
             12.2.4 APPGATE
             12.2.5 ZERO NETWORKS
             12.2.6 VERSA
             12.2.7 AXIS SECURITY
             12.2.8 IVANTI
             12.2.9 NORDLAYER
             12.2.10 GOODACCESS
 
13 ADJACENT MARKETS (Page No. - 275)
     13.1 INTRODUCTION 
               TABLE 317 ADJACENT MARKETS AND FORECASTS
     13.2 LIMITATIONS 
     13.3 ZERO TRUST ARCHITECTURE ECOSYSTEM AND ADJACENT MARKETS 
     13.4 IDENTITY AND ACCESS MANAGEMENT (IAM) MARKET 
             13.4.1 IDENTITY AND ACCESS MANAGEMENT (IAM) MARKET, BY OFFERING
                       TABLE 318 IDENTITY AND ACCESS MANAGEMENT MARKET, BY OFFERING,  2017–2022 (USD MILLION)
                       TABLE 319 IDENTITY AND ACCESS MANAGEMENT MARKET, BY OFFERING,  2023–2028 (USD MILLION)
                       TABLE 320 SOLUTIONS: IDENTITY AND ACCESS MANAGEMENT MARKET, BY REGION,  2017–2022 (USD MILLION)
                       TABLE 321 SOLUTIONS: IDENTITY AND ACCESS MANAGEMENT MARKET, BY REGION,  2023–2028 (USD MILLION)
                       TABLE 322 SERVICES: IDENTITY AND ACCESS MANAGEMENT MARKET, BY REGION,  2017–2022 (USD MILLION)
                       TABLE 323 SERVICES: IDENTITY AND ACCESS MANAGEMENT MARKET, BY REGION,  2023–2028 (USD MILLION)
     13.5 CYBER SECURITY MARKET 
             13.5.1 CYBER SECURITY MARKET, BY COMPONENT
                       TABLE 324 CYBER SECURITY MARKET, BY COMPONENT, 2016–2021 (USD MILLION)
                       TABLE 325 CYBER SECURITY MARKET, BY COMPONENT, 2022–2027 (USD MILLION)
                       TABLE 326 HARDWARE: CYBER SECURITY MARKET, BY REGION, 2016–2021 (USD MILLION)
                       TABLE 327 HARDWARE: CYBER SECURITY MARKET, BY REGION, 2022–2027 (USD MILLION)
                       TABLE 328 SOFTWARE: CYBER SECURITY MARKET, BY REGION, 2016–2021 (USD MILLION)
                       TABLE 329 SOFTWARE: CYBER SECURITY MARKET, BY REGION, 2022–2027 (USD MILLION)
                       TABLE 330 SERVICES: CYBER SECURITY MARKET, BY REGION, 2016–2021 (USD MILLION)
                       TABLE 331 SERVICES: CYBER SECURITY MARKET, BY REGION, 2022–2027 (USD MILLION)
 
14 APPENDIX (Page No. - 281)
     14.1 DISCUSSION GUIDE 
     14.2 KNOWLEDGESTORE: MARKETSANDMARKETS’  SUBSCRIPTION PORTAL 
     14.3 CUSTOMIZATION OPTIONS 
     14.4 RELATED REPORTS 
     14.5 AUTHOR DETAILS 

The study involved significant estimating of the current zero trust architecture market size. Exhaustive secondary research was done to collect information on the zero trust architecture industry. The next step was to validate these findings, assumptions, and sizing with industry experts across the value chain using primary research. Different approaches, such as top-down and bottom-up, were employed to estimate the total market size. After that, the market breakup and data triangulation procedures were used to estimate the market size of the segments and subsegments of the zero trust architecture market.

Secondary Research

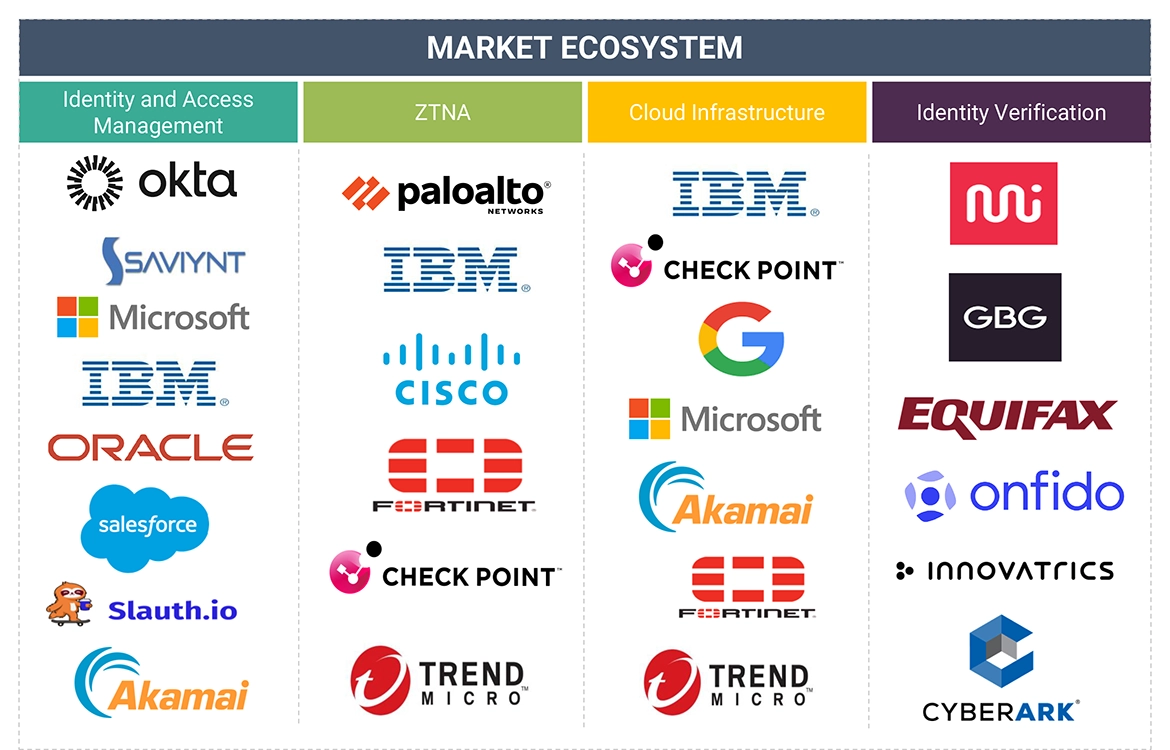
The market for the companies offering zero trust architecture and services is arrived at by secondary data available through paid and unpaid sources, analyzing the product portfolios of the major companies in the ecosystem, and rating the companies by their performance and quality. Various sources were referred to in the secondary research process to identify and collect information for this study. The secondary sources include annual reports, press releases, investor presentations of companies, white papers, journals, certified publications, and articles from recognized authors, directories, and databases.

In the secondary research process, various secondary sources were referred to for identifying and collecting information related to the study. Secondary sources included annual reports, press releases, and investor presentations of zero trust architecture vendors, forums, certified publications, and whitepapers. The secondary research was used to obtain critical information on the industry’s value chain, the total pool of key players, market classification, and segmentation from the market and technology-oriented perspectives.

Primary Research

In the primary research process, various supply and demand sources were interviewed to obtain qualitative and quantitative information for this report. The primary sources from the supply side included industry experts, such as Chief Executive Officers (CEOs), Vice Presidents (VPs), marketing directors, technology and innovation directors, and related key executives from various key companies and organizations operating in the Zero trust architecture market.

After the complete market engineering (calculations for market statistics, market breakdown, market size estimations, market forecasting, and data triangulation), extensive primary research was conducted to gather information and verify and validate the critical numbers arrived at. Primary research was also undertaken to identify the segmentation types, industry trends, competitive landscape of Zero trust architecture solutions offered by various market players, and fundamental market dynamics, such as drivers, restraints, opportunities, challenges, industry trends, and key player strategies.

In the complete market engineering process, the top-down and bottom-up approaches and several data triangulation methods were extensively used to perform the market estimation and market forecasting for the overall market segments and subsegments listed in this report. Extensive qualitative and quantitative analysis was performed on the complete market engineering process to list the key information/insights throughout the report.

Following is the breakup of the primary study:

Zero Trust Architecture Market Size, and Share

To know about the assumptions considered for the study, download the pdf brochure

Market Size Estimation

Top-down and bottom-up approaches were used to estimate and validate the size of the global zero trust architecture market and the size of various dependent sub-segments in the overall Zero trust architecture market. The research methodology used to estimate the market size includes the following details: critical players in the market were identified through secondary research, and their market shares in the respective regions were determined through primary and secondary research. This entire procedure included the study of the annual and financial reports of the top market players, and extensive interviews were conducted for key insights from the industry leaders, such as CEOs, VPs, directors, and marketing executives.

All percentage splits and breakdowns were determined using secondary sources and verified through primary sources. All possible parameters that affect the market covered in this research study have been accounted for, viewed in extensive detail, verified through primary research, and analyzed to get the final quantitative and qualitative data. This data is consolidated and added to detailed inputs and analysis from MarketsandMarkets.

Infographic Depicting Bottom-Up and Top-Down Approaches

Zero Trust Architecture Market Size, and Share

To know about the assumptions considered for the study, Request for Free Sample Report

Zero Trust Architecture Market Size, and Share

Data Triangulation

The market was split into several segments and subsegments after arriving at the overall market size using the market size estimation processes explained above. The data triangulation and market breakup procedures were employed, wherever applicable, to complete the overall market engineering process and arrive at the exact statistics of each market segment and subsegment. The data was triangulated by studying various factors and trends from both the demand and supply sides.

Market Definition

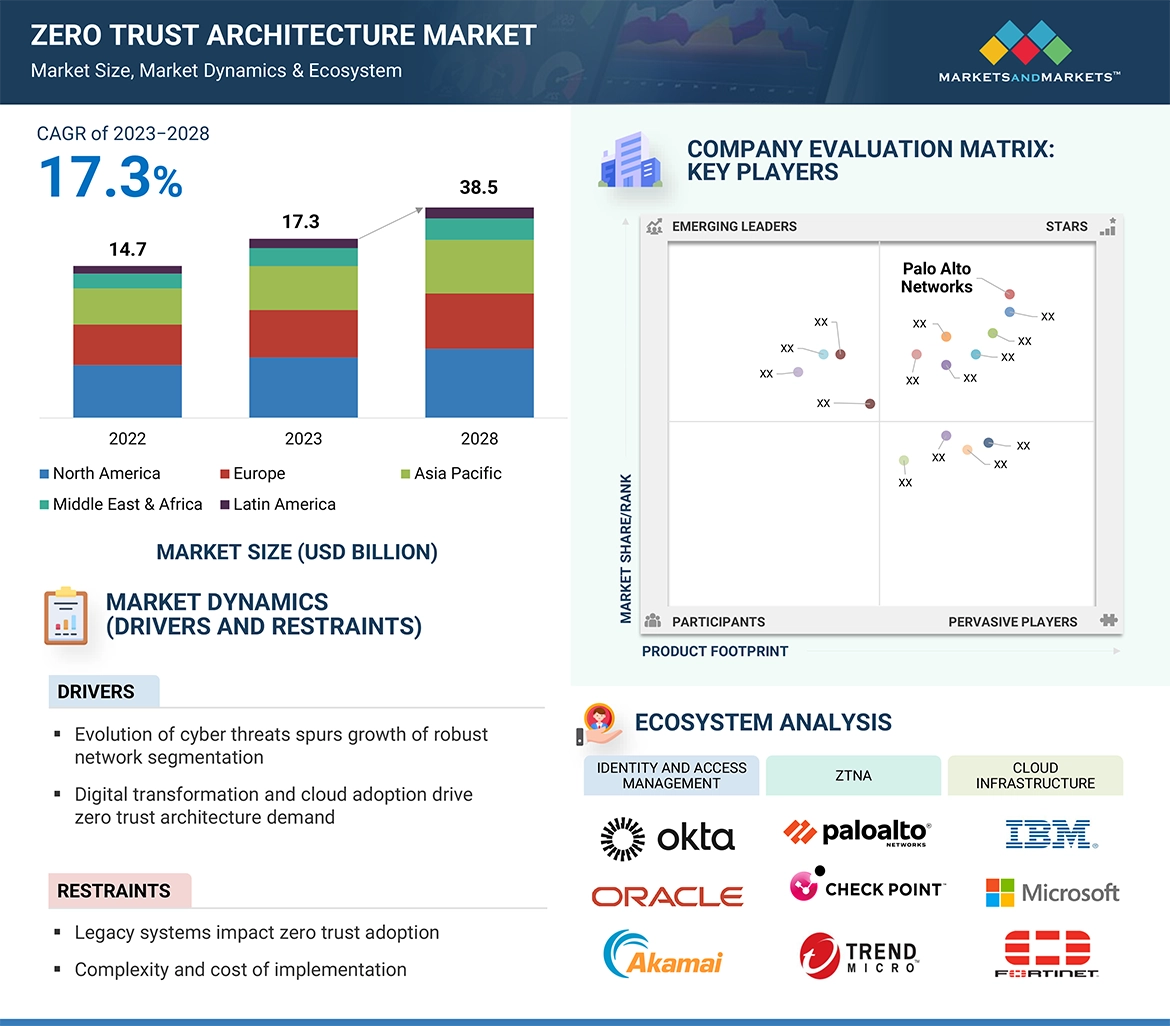
  • Zero Trust Architecture is a cybersecurity framework and approach to network and data security that assumes no implicit trust of any user or system within an organization’s network, even inside the corporate perimeter. It encompasses a set of principles and best practices for securing networks, systems, and data.
  • It focuses on the overall structure and design of an organization’s IT environment, emphasizing the segmentation of networks, identity and access management, continuous monitoring, and least privilege access.
  • The architecture is more about strategically planning and designing security measures to build a robust and resilient security posture.

Key Stakeholders

  • Government agencies
  • Zero trust security solution vendors
  • System integrators
  • Value-Added Resellers (VARs)
  • Information Technology (IT) security agencies
  • Research organizations
  • Distribution partners
  • Privacy specialists

Report Objectives

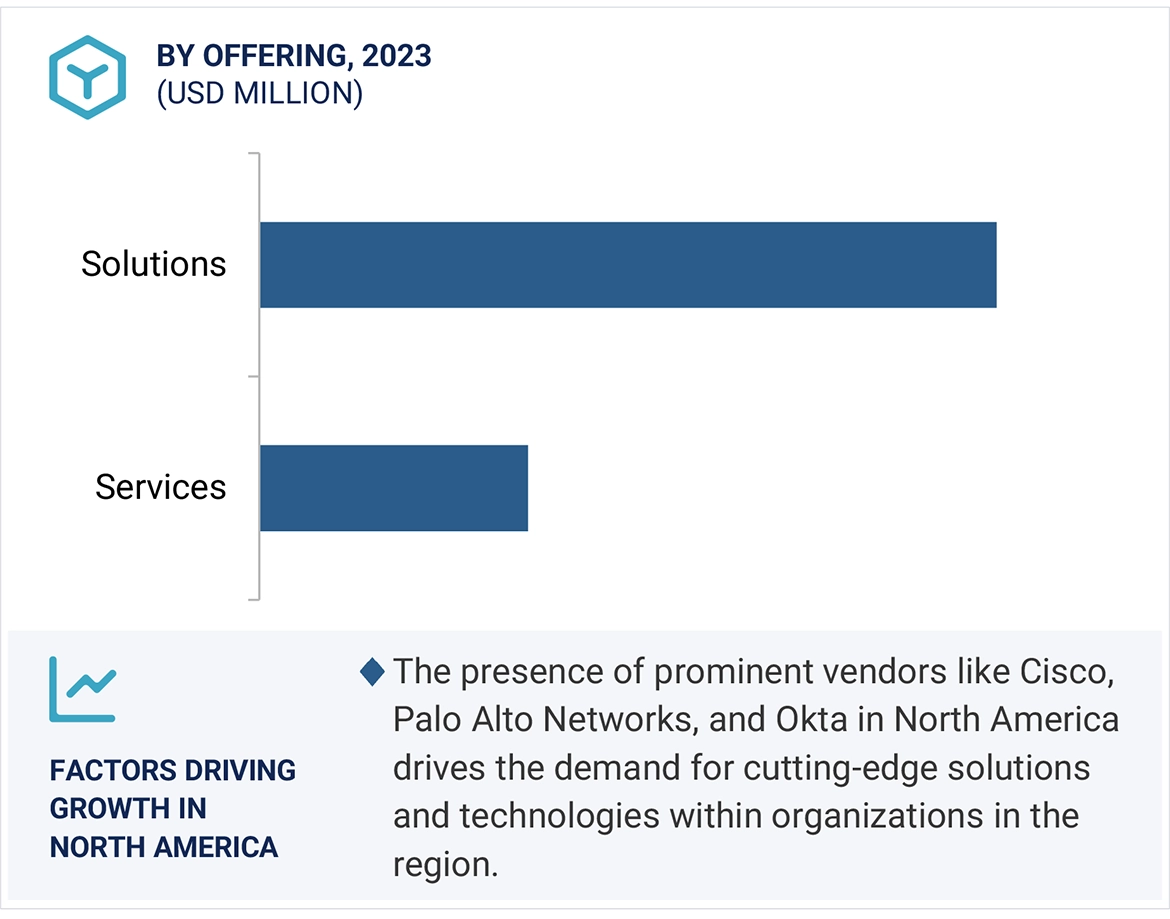
  • To define, describe, and forecast the zero trust architecture market based on - offering, organization size, deployment mode, vertical, and region.
  • To define, describe, and forecast the zero trust architecture market by – offering, organization size, deployment mode, vertical, and region.
  • To forecast the market size of five main regions: North America, Europe, Asia Pacific (APAC), Middle East & Africa (MEA), and Latin America
  • To analyze the subsegments of the market concerning individual growth trends, prospects, and contributions to the overall market
  • To provide detailed information related to the primary factors (drivers, restraints, opportunities, and challenges) influencing the growth of the zero trust architecture market
  • To analyze opportunities in the market for stakeholders by identifying high-growth segments of the zero trust architecture market
  • To profile the key players of the zero trust architecture market and comprehensively analyze their market size and core competencies in the market
  • Track and analyze competitive developments, such as new product launches, mergers and acquisitions, partnerships, agreements, and collaborations in the global zero trust architecture market.

Customization Options

With the given market data, MarketsandMarkets offers customizations based on company-specific needs. The following customization options are available for the report:

Geographic Analysis

  • Further breakup of the Asia Pacific market into countries contributing 75% to the regional market size
  • Further breakup of the North American market into countries contributing 75% to the regional market size
  • Further breakup of the Latin American market into countries contributing 75% to the regional market size
  • Further breakup of the Middle Eastern and African market into countries contributing 75% to the regional market size
  • Further breakup of the European market into countries contributing 75% to the regional market size

Company Information

  • Detailed analysis and profiling of additional market players (up to 5)
Custom Market Research Services

We will customize the research for you, in case the report listed above does not meet with your exact requirements. Our custom research will comprehensively cover the business information you require to help you arrive at strategic and profitable business decisions.

Request Customization
Report Code
TC 8852
Published ON
Nov, 2023
Choose License Type
BUY NOW
  • SHARE
X
Request Customization
Speak to Analyst
Speak to Analyst
OR FACE-TO-FACE MEETING
PERSONALIZE THIS RESEARCH
  • Triangulate with your Own Data
  • Get Data as per your Format and Definition
  • Gain a Deeper Dive on a Specific Application, Geography, Customer or Competitor
  • Any level of Personalization
REQUEST A FREE CUSTOMIZATION
LET US HELP YOU!
  • What are the Known and Unknown Adjacencies Impacting the Zero Trust Architecture Market
  • What will your New Revenue Sources be?
  • Who will be your Top Customer; what will make them switch?
  • Defend your Market Share or Win Competitors
  • Get a Scorecard for Target Partners
CUSTOMIZED WORKSHOP REQUEST
+1-888-600-6441
  • Call Us
  • +1-888-600-6441 (Corporate office hours)
  • +1-888-600-6441 (US/Can toll free)
  • +44-800-368-9399 (UK office hours)
CONNECT WITH US
ABOUT TRUST ONLINE
©2024 MarketsandMarkets Research Private Ltd. All rights reserved
DMCA.com Protection Status Website Feedback