Zero Trust Security Market

Zero Trust Security Market by Offering (Solution and Services), Security Type (Network Security, Application Security, Cloud Security, and Endpoint Security and IoT Security), Authentication Type, Vertical and Region - Global Forecast to 2028

Report Code: TC 7384 Sep, 2023, by marketsandmarkets.com

[319 Pages Report] The global Zero Trust Security market size is projected to grow from USD 31.1 billion in 2023 to USD 67.9 billion by 2028 at a Compound Annual Growth Rate (CAGR) of 16.9% during the forecast period. The rising threat of sophisticated cyberattacks is pushing organizations to seek advanced security measures such as zero trust security. With attackers continually evolving their tactics, the need for robust defenses against self-propagating malware and ransomware has become paramount. Additionally, the rapid adoption of cloud technology and digital transformation is expanding the attack surface, necessitating the adoption of a “never trust, always verify” approach.

Furthermore, stringent regulatory compliance demands are compelling businesses to embrace Zero Trust to ensure data protection and mitigate potential breaches. Finally, the diminishing effectiveness of traditional perimeter security in a mobile and interconnected world is driving the shift toward zero-trust security.
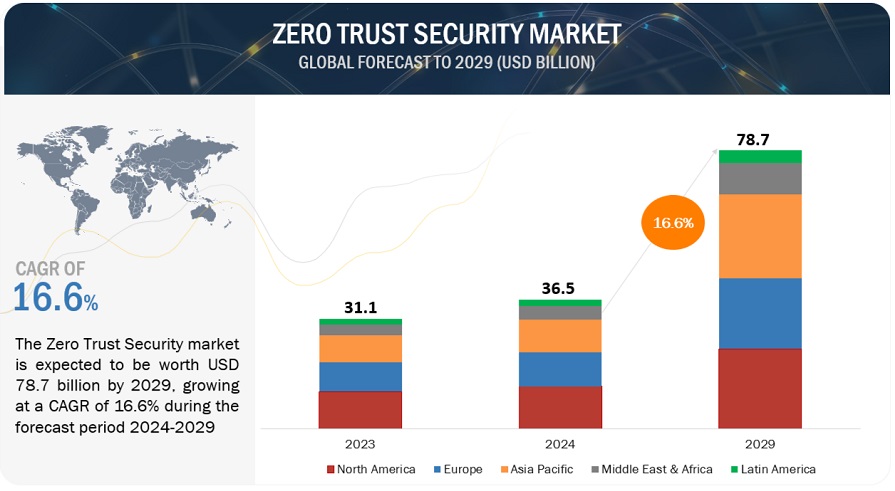
Zero Trust Security Market

To know about the assumptions considered for the study, Request for Free Sample Report
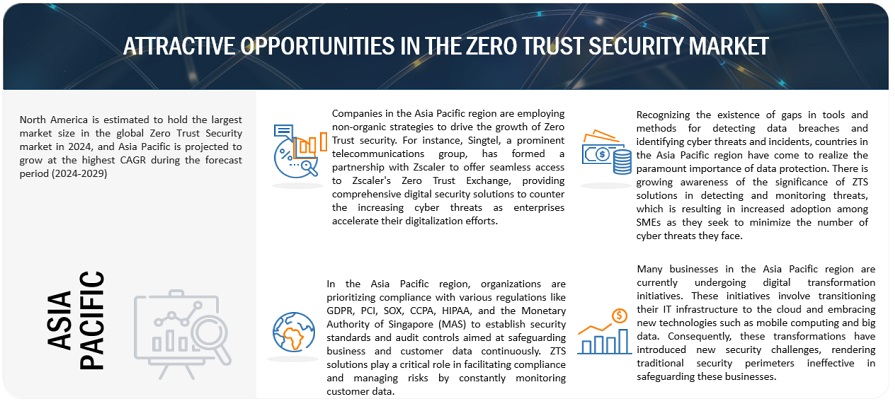
Zero Trust Security Market

To know about the assumptions considered for the study, download the pdf brochure

Zero Trust Security Market Dynamics

Driver: Decline of perimeter security clearing the path for zero trust security

Traditional perimeter-based security is proving insufficient in the face of contemporary workplace dynamics, such as remote work, mobile device usage, and cloud computing. The concept of a well-defined network perimeter is fading as the workforce becomes increasingly mobile and interconnected. In the conventional security model, once users gain network access, they often enjoy broad access to various resources within the perimeter, creating vulnerabilities for lateral movement by attackers. Zero Trust security addresses this challenge by implementing rigorous access controls and authentication processes at every access point, regardless of user location or device. Access is granted on a need-to-know basis, reducing the risk of data breaches. As organizations adapt to evolving cybersecurity threats, the shift from perimeter-based security to Zero Trust is becoming imperative for enhanced protection.

Restraint: Resistance to change within an organization

Adopting zero trust security often encounters resistance within organizations, including pushback from employees and stakeholders. This resistance stems from the need for a fundamental cultural shift from traditional perimeter-based security practices to a continuous verification and authentication approach. Some individuals may be reluctant to depart from the familiar trust-based model within their corporate network. This resistance can impede the organization's efforts to fully implement Zero Trust security. Successful adoption of this security paradigm requires technological changes and a shift in mindset and organizational culture. To overcome resistance, organizations must foster a collaborative approach to security, ensure user-friendly security controls, and communicate the changes effectively, enhancing the chances of successful adoption and overall cybersecurity enhancement.

Opportunity: Expanding opportunities in zero trust solutions for IoT security

The proliferation of IoT devices across various industries is set to amplify IoT traffic, heightening cybersecurity concerns. This trend has prompted a surge in the adoption of the zero-trust security model among organizations dealing with sensitive information. Zero trust enhances visibility into network activities, user access, application usage, and timestamps, which are vital in the face of IoT devices generating a high volume of daily queries. Traditional methods, such as entering data into SIEM systems, prove impractical and lead to a loss of network-level visibility. To counter this, enterprises are turning to zero-trust security solutions to meticulously inspect all network traffic, internal and external, efficiently identifying malicious DNS queries. Key sectors such as banking, IT, retail, healthcare, and government are poised to implement zero trust security, driven by predictive analytics and IoT device monitoring, ushering in growth opportunities for market players amid a heightened need for robust security in the IoT-dominated landscape.

Challenge: Diminishing traditional security boundaries

Traditional security strategies once relied on securing network perimeters and trusting all internal resources and users. However, the modern landscape, shaped by cloud computing and remote work, has blurred these boundaries. In the zero-trust model, the core tenet is to "never trust, always verify." This mandates authentication and verification for every user and device, regardless of location, erasing endpoint or network control assumptions. The challenge is extending this approach to remote and personal device access, highlighting the importance of robust Identity and Access Management (IAM) solutions for securing sensitive data.

Zero Trust Security Market Ecosystem
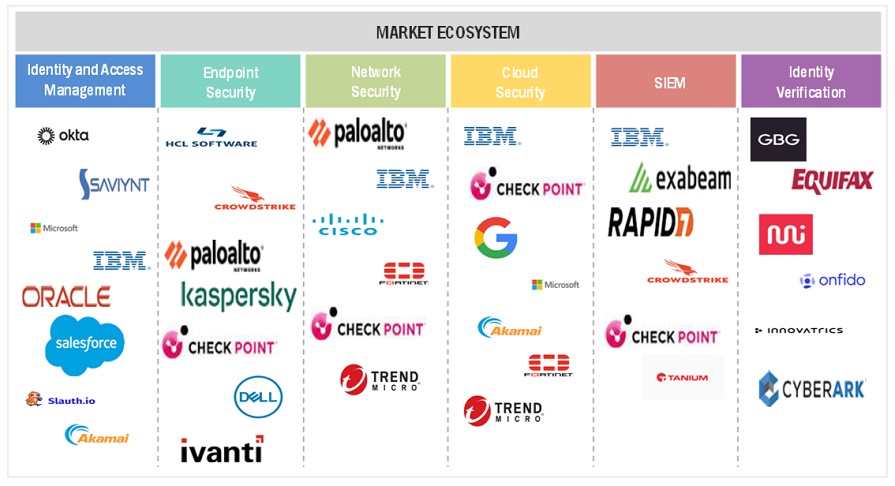
Zero Trust Security Market

By vertical, the Retail and e-commerce segment is to grow at the highest CAGR during the forecast period.

The retail and eCommerce vertical is experiencing remarkable growth in the zero-trust security market due to the sector's extensive online presence, vast customer data storage, and high susceptibility to cyber threats. With the increasing adoption of digital shopping platforms, safeguarding sensitive customer information and transaction data has become paramount. Zero trust security, which focuses on continuous verification and strict access controls, is well-suited to protect these valuable assets. As a result, retail and eCommerce businesses prioritize zero-trust security solutions to fortify their online infrastructure, ensuring customer trust, regulatory compliance, and resilience against evolving cyber threats.

By authentication type, the Multi-factor authentication segment is to grow at the highest CAGR during the forecast period.

Multi-factor authentication is experiencing explosive growth in the zero-trust security market as it addresses critical security concerns. With the heightened awareness of its significance due to prominent data breaches, organizations recognize MFA's pivotal role in safeguarding systems. Government regulations mandating MFA for sensitive transactions further propel its adoption. Within the zero-trust security framework, MFA ensures that only authorized users gain resource access. Additionally, the increasing prevalence of cloud-based applications and mobile devices in workplaces necessitates MFA to fortify security. As cyberattacks become more sophisticated, MFA's multifaceted verification process is a formidable barrier against unauthorized access, rendering it an indispensable element of modern security strategies.

By region, North America accounts for the highest market size during the forecast period.

The zero-trust security market in North America is experiencing rapid growth. The rapid growth is attributed to high cybersecurity awareness as organizations prioritize comprehensive protection. The presence of major market players, including Cisco, Palo Alto Networks, and Okta, gives North American firms early access to cutting-edge zero-trust solutions. Strict regulatory requirements, such as GDPR and CCPA, compel organizations to adopt zero trust for compliance. Additionally, North America's early embrace of cloud computing drives the need for robust security measures in the cloud.
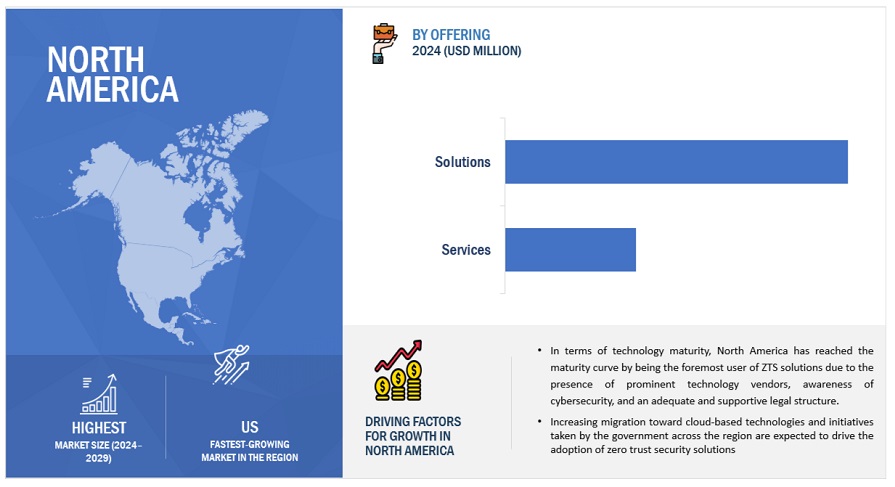
Zero Trust Security Market Size, and Share

Get online access to the report on the World's First Market Intelligence Cloud

  • Easy to Download Historical Data & Forecast Numbers
  • Company Analysis Dashboard for high growth potential opportunities
  • Research Analyst Access for customization & queries
  • Competitor Analysis with Interactive dashboard
  • Latest News, Updates & Trend analysis
Request Sample

Scope of the Report

Report Metrics

Details

Market size available for years

  • 2017-2028

Base year considered

  • 2022

Forecast period

  • 2023–2028

Forecast units

  • Value (USD Million/USD Billion) 

Segments Covered

  • Offering, Security Type, Authentication Type, Vertical, and Region

Geographies covered

  • North America, Europe, Asia Pacific, Middle East & Africa, and Latin America

Companies covered

  • Major vendors in the global Zero Trust Security market include Palo Alto Networks (US), VMware (US), Zscaler (US), Akamai (US), Microsoft (US), Cisco (US), IBM (US), Citrix (US), Check Point (US), Trellix (US), Forcepoint (US), CrowdStrike (US), Cloudflare (US), Fortinet (US), Google (US), Qnext (Canada), Illumio (US), ON2IT (Netherlands), Perimeter 81 (US), ThreatLocker (US), Twingate (US), Appgate (US), Zero Networks (Israel), Zentera (US), Xage (US), and Skyhigh Security (US).   

The study categorizes the Zero Trust Security market by segments - offering, software type, deployment mode, application, vertical, and region.

By Offering:
  • Solution
  • Services
By Security Type:
  • Network Security
  • Application Security
  • Cloud Security
  • Endpoint Security and IoT Security
By Authentication Type:
  • Single-Factor Authentication
  • Multi-Factor Authentication
Vertical:
  • Banking, Financial Services, and Insurance (BFSI)
  • Government and Defense
  • IT & ITeS
  • Healthcare
  • Retail and ECommerce
  • Energy and Utilities
  • Other Verticals
By Region:
  • North America
  • Europe
  • Asia Pacific
  • Middle East & Africa
  • Latin America

Recent Developments

  1. In August 2023, Secureworks and Akamai partnered to fortify modern workplace cybersecurity, combining Akamai's zero trust and web security with Secureworks' Taegis XDR for seamless access management and threat response.
  2. In July 2023, Samsung and Microsoft partnered to bolster mobile device security for enterprises. This partnership enables hardware-backed device attestation via Microsoft Intune on Samsung Galaxy devices, fortifying Zero Trust security and supporting BYOD initiatives.
  3. In May 2023, Zscaler forged a strategic partnership with the Center for Internet Security (CIS) to bolster cybersecurity for state, local, tribal, and territorial governments by leveraging the CIS CyberMarket. Through this partnership, Zscaler's Zero Trust Exchange brings forth budget-friendly, cutting-edge zero trust solutions aimed at safeguarding against the ever-evolving landscape of cyber threats.
  4. In April 2023, Palo Alto Networks and Accenture partnered to bolster cyber resilience with integrated Prisma SASE solutions. This partnership streamlines zero trust network access for enhanced security in distributed work environments.
  5. In September 2022, VMware and Nvidia joined forces to forge an advanced data center platform that seamlessly melds AI capabilities with a robust zero-trust security approach. This strategic collaboration is aimed at elevating the security of workloads by deploying state-of-the-art firewalls on each server, harnessing the power of GPUs for peak performance, and fortifying the zero-trust model.

Frequently Asked Questions (FAQ):

To speak to our analyst for a discussion on the above findings, click Speak to Analyst

TABLE OF CONTENTS
 
1 INTRODUCTION (Page No. - 43)
    1.1 STUDY OBJECTIVES 
    1.2 MARKET DEFINITION 
    1.3 STUDY SCOPE 
           1.3.1 MARKET SEGMENTATION
           1.3.2 INCLUSIONS & EXCLUSIONS
           1.3.3 REGIONS COVERED
    1.4 YEARS CONSIDERED 
    1.5 CURRENCY CONSIDERED 
           TABLE 1 USD EXCHANGE RATES, 2018–2022
    1.6 STAKEHOLDERS 
    1.7 RECESSION IMPACT 
    1.8 SUMMARY OF CHANGES 
 
2 RESEARCH METHODOLOGY (Page No. - 48)
    2.1 RESEARCH DATA 
           FIGURE 1 ZERO TRUST SECURITY MARKET: RESEARCH DESIGN
           2.1.1 SECONDARY DATA
           2.1.2 PRIMARY DATA
                    2.1.2.1 Breakup of primaries
                               FIGURE 2 BREAKDOWN OF PRIMARY INTERVIEWS: BY COMPANY TYPE, DESIGNATION, AND REGION
                    2.1.2.2 Key industry insights
    2.2 DATA TRIANGULATION 
    2.3 MARKET SIZE ESTIMATION 
           FIGURE 3 ZERO TRUST SECURITY MARKET ESTIMATION: RESEARCH FLOW
           2.3.1 TOP-DOWN APPROACH
                    FIGURE 4 APPROACH 1 (SUPPLY SIDE): REVENUE FROM SOFTWARE/SERVICES OF ZERO TRUST SECURITY VENDORS
                    FIGURE 5 APPROACH 1 (SUPPLY-SIDE ANALYSIS)
           2.3.2 BOTTOM-UP APPROACH
                    FIGURE 6 MARKET SIZE ESTIMATION METHODOLOGY (APPROACH 2): BOTTOM-UP (DEMAND SIDE) — PRODUCTS/SOLUTIONS/SERVICES
    2.4 MARKET FORECAST 
           TABLE 2 FACTOR ANALYSIS
    2.5 RESEARCH ASSUMPTIONS 
    2.6 LIMITATIONS AND RISK ASSESSMENT 
    2.7 RECESSION IMPACT ANALYSIS 
 
3 EXECUTIVE SUMMARY (Page No. - 57)
    TABLE 1 ZERO TRUST SECURITY MARKET AND GROWTH, 2017–2022 (USD MILLION) 
    TABLE 2 ZERO TRUST SECURITY MARKET AND GROWTH, 2023–2028 (USD MILLION) 
    FIGURE 7 NORTH AMERICA TO ACCOUNT FOR LARGEST MARKET IN 2023 
 
4 PREMIUM INSIGHTS (Page No. - 60)
    4.1 ATTRACTIVE OPPORTUNITIES FOR PLAYERS IN ZERO TRUST SECURITY MARKET 
           FIGURE 8 INCREASING INSTANCES OF SOPHISTICATED CYBERATTACKS AND NEED FOR ADHERENCE TO REGULATORY COMPLIANCE TO DRIVE MARKET GROWTH
    4.2 ZERO TRUST SECURITY MARKET, BY OFFERING 
           FIGURE 9 SERVICES SEGMENT TO GROW AT HIGHER CAGR DURING FORECAST PERIOD
    4.3 ZERO TRUST SECURITY MARKET, BY SECURITY TYPE 
           FIGURE 10 APPLICATION SECURITY SEGMENT TO GROW AT HIGHEST CAGR DURING FORECAST PERIOD
    4.4 ZERO TRUST SECURITY MARKET, BY AUTHENTICATION TYPE 
           FIGURE 11 MULTI-FACTOR AUTHENTICATION SEGMENT TO GROW AT HIGHER CAGR BY 2028
    4.5 ZERO TRUST SECURITY MARKET, BY VERTICAL 
           FIGURE 12 IT & ITES SEGMENT TO ACCOUNT FOR LARGEST MARKET DURING FORECAST PERIOD
    4.6 MARKET INVESTMENT SCENARIO 
           FIGURE 13 ASIA PACIFIC TO EMERGE AS LUCRATIVE MARKET FOR INVESTMENTS IN NEXT FIVE YEARS
 
5 MARKET OVERVIEW AND INDUSTRY TRENDS (Page No. - 63)
    5.1 INTRODUCTION 
           FIGURE 14 ZERO TRUST SECURITY MODERN ARCHITECTURE
    5.2 EVOLUTION OF ZERO TRUST SECURITY MARKET: COMPREHENSIVE HISTORY AND OUTLOOK 
           FIGURE 15 SEVEN PILLARS OF ZERO TRUST SECURITY MODEL
    5.3 MARKET DYNAMICS 
           FIGURE 16 ZERO TRUST SECURITY MARKET: DRIVERS, RESTRAINTS, OPPORTUNITIES, AND CHALLENGES
           5.3.1 DRIVERS
                    5.3.1.1 Rapid adoption of cloud and surge in digital transformation
                    5.3.1.2 Rising regulatory compliance demands
                    5.3.1.3 Diminishing popularity of perimeter-based security
                    5.3.1.4 Rising threat of sophisticated cyberattacks
           5.3.2 RESTRAINTS
                    5.3.2.1 Complexity and costly implementation
                    5.3.2.2 Presence of legacy systems and compatibility issues
                    5.3.2.3 Organizational resistance to change
           5.3.3 OPPORTUNITIES
                    5.3.3.1 Improved visibility into networks and robust security
                    5.3.3.2 Development of new zero trust security products and services
                    5.3.3.3 Surge in awareness regarding zero trust security
           5.3.4 CHALLENGES
                    5.3.4.1 Weakening of established security perimeters
                    5.3.4.2 Growth of shadow SaaS applications
                    5.3.4.3 Digital supply chain vulnerability
                    5.3.4.4 Fragmented security operations and siloed teams
    5.4 CASE STUDY ANALYSIS 
           5.4.1 DELOITTE’S CUSTOMIZED SOLUTION HELPED MAJOR CHEMICAL INDUSTRIAL ORGANIZATION ACHIEVE ZERO TRUST ARCHITECTURE
           5.4.2 ARRIVAL ENHANCED ITS INTERNAL INFRASTRUCTURE SECURITY WITH CLOUDFLARE’S ZERO TRUST NETWORK ACCESS
           5.4.3 CISCO HELPED VICTORIA UNIVERSITY ENHANCE CAMPUS SECURITY WITH ZERO TRUST SECURITY SOLUTIONS
    5.5 VALUE CHAIN ANALYSIS 
           FIGURE 17 VALUE CHAIN ANALYSIS
           5.5.1 RESEARCH & DEVELOPMENT
           5.5.2 SOLUTION PROVIDERS
           5.5.3 INTEGRATION & DEPLOYMENT
                    5.5.3.1 Managed security service providers
                    5.5.3.2 Training & education providers
           5.5.4 COMPLIANCE & AUDITING
           5.5.5 END USERS
    5.6 ECOSYSTEM ANALYSIS 
           TABLE 3 ECOSYSTEM ANALYSIS
           FIGURE 18 ECOSYSTEM MAP
    5.7 PORTER’S FIVE FORCES ANALYSIS 
           FIGURE 19 PORTER’S FIVE FORCES ANALYSIS
           TABLE 4 PORTER’S FIVE FORCES MODEL: IMPACT ANALYSIS
           5.7.1 THREAT OF NEW ENTRANTS
           5.7.2 BARGAINING POWER OF SUPPLIERS
           5.7.3 BARGAINING POWER OF BUYERS
           5.7.4 THREAT OF SUBSTITUTES
           5.7.5 INTENSITY OF COMPETITIVE RIVALRY
    5.8 INDICATIVE PRICING ANALYSIS 
           TABLE 5 CLOUDFLARE: PRICING ANALYSIS
           TABLE 6 PERIMETER 81: PRICING ANALYSIS
           TABLE 7 OKTA: PRICING ANALYSIS
           TABLE 8 ILLUMIO: PRICING ANALYSIS
    5.9 TECHNOLOGY ANALYSIS 
           5.9.1 ARTIFICIAL INTELLIGENCE
           5.9.2 BLOCKCHAIN
           5.9.3 INTERNET OF THINGS
    5.10 PATENT ANALYSIS 
           FIGURE 20 PATENTS PUBLISHED, 2012–2023
           TABLE 9 LIST OF PATENTS IN ZERO TRUST SECURITY MARKET, 2022–2023
    5.11 TRENDS AND DISRUPTIONS IMPACTING CUSTOMERS’ BUSINESSES 
                    FIGURE 21 TRENDS AND DISRUPTIONS IMPACTING CUSTOMERS’ BUSINESSES
    5.12 TECHNOLOGY ROADMAP 
                    TABLE 10 TECHNOLOGY ROADMAP
    5.13 ZERO TRUST SECURITY MARKET: BUSINESS MODELS 
                    TABLE 11 ZERO TRUST SECURITY MARKET: BUSINESS MODELS
    5.14 TARIFF AND REGULATORY LANDSCAPE 
           5.14.1 PAYMENT CARD INDUSTRY DATA SECURITY STANDARD (PCI–DSS)
           5.14.2 GENERAL DATA PROTECTION REGULATION (GDPR)
           5.14.3 CALIFORNIA CONSUMER PRIVACY ACT (CCPA)
           5.14.4 GRAMM—LEACH—BLILEY ACT OF 1999 (GLBA)
           5.14.5 PERSONAL INFORMATION PROTECTION AND ELECTRONIC DOCUMENTS ACT (PIPEDA)
           5.14.6 HEALTH INSURANCE PORTABILITY AND ACCOUNTABILITY ACT (HIPAA)
           5.14.7 INTERNATIONAL ORGANIZATION FOR STANDARDIZATION (ISO) STANDARD 27001
           5.14.8 REGULATORY BODIES, GOVERNMENT AGENCIES, AND OTHER ORGANIZATIONS
                    TABLE 12 NORTH AMERICA: LIST OF REGULATORY BODIES, GOVERNMENT AGENCIES, AND OTHER ORGANIZATIONS
                    TABLE 13 EUROPE: LIST OF REGULATORY BODIES, GOVERNMENT AGENCIES, AND OTHER ORGANIZATIONS
                    TABLE 14 ASIA PACIFIC: LIST OF REGULATORY BODIES, GOVERNMENT AGENCIES, AND OTHER ORGANIZATIONS
    5.15 KEY STAKEHOLDERS AND BUYING CRITERIA 
           5.15.1 KEY STAKEHOLDERS IN BUYING PROCESS
                    FIGURE 22 INFLUENCE OF STAKEHOLDERS ON BUYING PROCESS
                    TABLE 15 INFLUENCE OF STAKEHOLDERS ON BUYING PROCESS
           5.15.2 BUYING CRITERIA
                    FIGURE 23 KEY BUYING CRITERIA FOR TOP THREE APPLICATIONS
                    TABLE 16 KEY BUYING CRITERIA FOR TOP THREE APPLICATIONS
    5.16 KEY CONFERENCES & EVENTS 
                    TABLE 17 KEY CONFERENCES & EVENTS, 2023–2024
 
6 ZERO TRUST SECURITY MARKET, BY OFFERING (Page No. - 102)
    6.1 INTRODUCTION 
           6.1.1 OFFERINGS: ZERO TRUST SECURITY MARKET DRIVERS
                    FIGURE 24 SOLUTIONS SEGMENT TO ACCOUNT FOR LARGER MARKET DURING FORECAST PERIOD
                    TABLE 18 ZERO TRUST SECURITY MARKET, BY OFFERING, 2017–2022 (USD MILLION)
                    TABLE 19 ZERO TRUST SECURITY MARKET, BY OFFERING, 2023–2028 (USD MILLION)
    6.2 SOLUTIONS 
           6.2.1 FOCUS ON OPTIMIZING OPERATIONAL EFFICIENCY WITH ZERO TRUST SECURITY SOLUTIONS
                    TABLE 20 SOLUTIONS: ZERO TRUST SECURITY MARKET, BY REGION, 2017–2022 (USD MILLION)
                    TABLE 21 SOLUTIONS: ZERO TRUST SECURITY MARKET, BY REGION, 2023–2028 (USD MILLION)
    6.3 SERVICES 
           6.3.1 NEED FOR PROACTIVE EXPERTISE AND CONTINUOUS PROTECTION SERVICES TO DRIVE MARKET FOR ZERO TRUST SECURITY SOLUTIONS
                    TABLE 22 SERVICES: ZERO TRUST SECURITY MARKET, BY REGION, 2017–2022 (USD MILLION)
                    TABLE 23 SERVICES: ZERO TRUST SECURITY MARKET, BY REGION, 2023–2028 (USD MILLION)
           6.3.2 PROFESSIONAL SERVICES
                    6.3.2.1 Design, deployment, integration, and consulting
                    6.3.2.2 Training & education
                    6.3.2.3 Support & maintenance
           6.3.3 MANAGED SERVICES
 
7 ZERO TRUST SECURITY MARKET, BY SOLUTION (Page No. - 108)
    7.1 INTRODUCTION 
           7.1.1 SOLUTIONS: ZERO TRUST SECURITY MARKET DRIVERS
    7.2 IDENTITY AND ACCESS MANAGEMENT (IAM) 
    7.3 MICRO-SEGMENTATION 
    7.4 ZERO TRUST NETWORK ACCESS (ZTNA) 
    7.5 SECURITY INFORMATION AND EVENT MANAGEMENT (SIEM) 
    7.6 USER AND ENTITY BEHAVIOR ANALYTICS (UEBA) 
    7.7 POLICY MANAGEMENT 
    7.8 OTHER SOLUTIONS 
 
8 ZERO TRUST SECURITY MARKET, BY SECURITY TYPE (Page No. - 113)
    8.1 INTRODUCTION 
           8.1.1 SECURITY TYPES: ZERO TRUST SECURITY MARKET DRIVERS
                    FIGURE 25 CLOUD SECURITY SEGMENT TO ACCOUNT FOR LARGEST MARKET DURING FORECAST PERIOD
                    TABLE 24 ZERO TRUST SECURITY MARKET, BY SECURITY TYPE, 2017–2022 (USD MILLION)
                    TABLE 25 ZERO TRUST SECURITY MARKET, BY SECURITY TYPE, 2023–2028 (USD MILLION)
    8.2 NETWORK SECURITY 
           8.2.1 ZERO TRUST SECURITY SOLUTIONS TO BOLSTER NETWORK SECURITY AGAINST EVOLVING THREATS
                    TABLE 26 NETWORK SECURITY: ZERO TRUST SECURITY MARKET, BY REGION, 2017–2022 (USD MILLION)
                    TABLE 27 NETWORK SECURITY: ZERO TRUST SECURITY MARKET, BY REGION, 2023–2028 (USD MILLION)
    8.3 APPLICATION SECURITY 
           8.3.1 NEED FOR CONTINUOUS MONITORING AND ACCESS CONTROL IN ZERO TRUST APPLICATION SECURITY TO BOOST GROWTH
                    TABLE 28 APPLICATION SECURITY: ZERO TRUST SECURITY MARKET, BY REGION, 2017–2022 (USD MILLION)
                    TABLE 29 APPLICATION SECURITY: ZERO TRUST SECURITY MARKET, BY REGION, 2023–2028 (USD MILLION)
    8.4 CLOUD SECURITY 
           8.4.1 EMPHASIS ON STRENGTHENING CLOUD SECURITY WITH CASBS, CSPM, AND CWPPS IN ZERO TRUST SECURITY ENVIRONMENT TO DRIVE DEMAND
                    TABLE 30 CLOUD SECURITY: ZERO TRUST SECURITY MARKET, BY REGION, 2017–2022 (USD MILLION)
                    TABLE 31 CLOUD SECURITY: ZERO TRUST SECURITY MARKET, BY REGION, 2023–2028 (USD MILLION)
    8.5 ENDPOINT SECURITY & IOT SECURITY 
           8.5.1 RISING COMPLEXITIES IN ENDPOINT AND IOT SECURITY TO ENCOURAGE ADOPTION OF ZERO TRUST SECURITY SOLUTIONS
                    TABLE 32 ENDPOINT SECURITY & IOT SECURITY: ZERO TRUST SECURITY MARKET, BY REGION, 2017–2022 (USD MILLION)
                    TABLE 33 ENDPOINT SECURITY & IOT SECURITY: ZERO TRUST SECURITY MARKET, BY REGION, 2023–2028 (USD MILLION)
 
9 ZERO TRUST SECURITY MARKET, BY AUTHENTICATION TYPE (Page No. - 121)
    9.1 INTRODUCTION 
           9.1.1 AUTHENTICATION TYPES: ZERO TRUST SECURITY MARKET DRIVERS
                    FIGURE 26 MULTI-FACTOR AUTHENTICATION SEGMENT TO LEAD MARKET DURING FORECAST PERIOD
                    TABLE 34 ZERO TRUST SECURITY MARKET, BY AUTHENTICATION TYPE, 2017–2022 (USD MILLION)
                    TABLE 35 ZERO TRUST SECURITY MARKET, BY AUTHENTICATION TYPE, 2023–2028 (USD MILLION)
    9.2 SINGLE-FACTOR AUTHENTICATION 
           9.2.1 GROWING DEMAND FOR ZERO TRUST PRINCIPLES AND SSO TO BOOST MARKET EXPANSION
                    TABLE 36 SINGLE-FACTOR AUTHENTICATION: ZERO TRUST SECURITY MARKET, BY REGION, 2017–2022 (USD MILLION)
                    TABLE 37 SINGLE-FACTOR AUTHENTICATION: ZERO TRUST SECURITY MARKET, BY REGION, 2023–2028 (USD MILLION)
    9.3 MULTI-FACTOR AUTHENTICATION 
           9.3.1 DEMAND FOR ENHANCED AUTHENTICATION AND IDENTIFICATION ACROSS INDUSTRIES TO DRIVE MARKET
                    TABLE 38 MULTI-FACTOR AUTHENTICATION: ZERO TRUST SECURITY MARKET, BY REGION, 2017–2022 (USD MILLION)
                    TABLE 39 MULTI-FACTOR AUTHENTICATION: ZERO TRUST SECURITY MARKET, BY REGION, 2023–2028 (USD MILLION)
 
10 ZERO TRUST SECURITY MARKET, BY VERTICAL (Page No. - 126)
     10.1 INTRODUCTION 
             10.1.1 VERTICALS: ZERO TRUST SECURITY MARKET DRIVERS
                       FIGURE 27 IT & ITES SEGMENT TO ACHIEVE HIGHEST GROWTH DURING FORECAST PERIOD
                       TABLE 40 ZERO TRUST SECURITY MARKET, BY VERTICAL, 2017–2022 (USD MILLION)
                       TABLE 41 ZERO TRUST SECURITY MARKET, BY VERTICAL, 2023–2028 (USD MILLION)
     10.2 BANKING, FINANCIAL SERVICES, AND INSURANCE (BFSI) 
             10.2.1 NEED FOR BFSI SECTOR TO ADOPT ADVANCED SECURITY SOLUTIONS AMID RISING CYBER THREATS TO DRIVE MARKET
                       TABLE 42 BFSI: ZERO TRUST SECURITY MARKET, BY REGION, 2017–2022 (USD MILLION)
                       TABLE 43 BFSI: ZERO TRUST SECURITY MARKET, BY REGION, 2023–2028 (USD MILLION)
     10.3 GOVERNMENT & DEFENSE 
             10.3.1 ZERO TRUST SECURITY SOLUTIONS STRENGTHEN CYBERSECURITY RESILIENCE IN GOVERNMENT AND DEFENSE SECTORS
                       TABLE 44 GOVERNMENT & DEFENSE: ZERO TRUST SECURITY MARKET, BY REGION, 2017–2022 (USD MILLION)
                       TABLE 45 GOVERNMENT & DEFENSE: ZERO TRUST SECURITY MARKET, BY REGION, 2023–2028 (USD MILLION)
     10.4 IT & ITES 
             10.4.1 GROWING COMPLEXITIES IN CYBERSECURITY AND STRINGENT REGULATORY REQUIREMENTS TO PROPEL MARKET
                       TABLE 46 IT & ITES: ZERO TRUST SECURITY MARKET, BY REGION, 2017–2022 (USD MILLION)
                       TABLE 47 IT & ITES: ZERO TRUST SECURITY MARKET, BY REGION, 2023–2028 (USD MILLION)
     10.5 HEALTHCARE 
             10.5.1 ESCALATING CYBER THREATS TO BOOST POPULARITY OF ZERO TRUST SECURITY SOLUTIONS
                       TABLE 48 HEALTHCARE: ZERO TRUST SECURITY MARKET, BY REGION, 2017–2022 (USD MILLION)
                       TABLE 49 HEALTHCARE: ZERO TRUST SECURITY MARKET, BY REGION, 2023–2028 (USD MILLION)
     10.6 RETAIL & ECOMMERCE 
             10.6.1 ZERO TRUST SECURITY SOLUTIONS SAFEGUARD RETAIL & ECOMMERCE SECTOR AMID DIGITAL EVOLUTION
                       TABLE 50 RETAIL & ECOMMERCE: ZERO TRUST SECURITY MARKET, BY REGION, 2017–2022 (USD MILLION)
                       TABLE 51 RETAIL & ECOMMERCE: ZERO TRUST SECURITY MARKET, BY REGION, 2023–2028 (USD MILLION)
     10.7 ENERGY & UTILITIES 
             10.7.1 NEED FOR ENHANCED CRITICAL INFRASTRUCTURE SECURITY TO DRIVE ADOPTION OF ZERO TRUST SECURITY SOLUTIONS
                       TABLE 52 ENERGY & UTILITIES: ZERO TRUST SECURITY MARKET, BY REGION, 2017–2022 (USD MILLION)
                       TABLE 53 ENERGY & UTILITIES: ZERO TRUST SECURITY MARKET, BY REGION, 2023–2028 (USD MILLION)
     10.8 OTHER VERTICALS 
               TABLE 54 OTHER VERTICALS: ZERO TRUST SECURITY MARKET, BY REGION, 2017–2022 (USD MILLION)
               TABLE 55 OTHER VERTICALS: ZERO TRUST SECURITY MARKET, BY REGION, 2023–2028 (USD MILLION)
 
11 ZERO TRUST SECURITY MARKET, BY REGION (Page No. - 139)
     11.1 INTRODUCTION 
               FIGURE 28 ASIA PACIFIC TO GROW AT HIGHEST CAGR DURING FORECAST PERIOD
               TABLE 56 ZERO TRUST SECURITY MARKET, BY REGION, 2017–2022 (USD MILLION)
               TABLE 57 ZERO TRUST SECURITY MARKET, BY REGION, 2023–2028 (USD MILLION)
     11.2 NORTH AMERICA 
             11.2.1 NORTH AMERICA: ZERO TRUST SECURITY MARKET DRIVERS
             11.2.2 NORTH AMERICA: RECESSION IMPACT
             11.2.3 NORTH AMERICA: REGULATORY LANDSCAPE
                       FIGURE 29 NORTH AMERICA: MARKET SNAPSHOT
                       TABLE 58 NORTH AMERICA: ZERO TRUST SECURITY MARKET, BY OFFERING, 2017–2022 (USD MILLION)
                       TABLE 59 NORTH AMERICA: ZERO TRUST SECURITY MARKET, BY OFFERING, 2023–2028 (USD MILLION)
                       TABLE 60 NORTH AMERICA: ZERO TRUST SECURITY MARKET, BY SECURITY TYPE, 2017–2022 (USD MILLION)
                       TABLE 61 NORTH AMERICA: ZERO TRUST SECURITY MARKET, BY SECURITY TYPE, 2023–2028 (USD MILLION)
                       TABLE 62 NORTH AMERICA: ZERO TRUST SECURITY MARKET, BY AUTHENTICATION TYPE, 2017–2022 (USD MILLION)
                       TABLE 63 NORTH AMERICA: ZERO TRUST SECURITY MARKET, BY AUTHENTICATION TYPE, 2023–2028 (USD MILLION)
                       TABLE 64 NORTH AMERICA: ZERO TRUST SECURITY MARKET, BY VERTICAL, 2017–2022 (USD MILLION)
                       TABLE 65 NORTH AMERICA: ZERO TRUST SECURITY MARKET, BY VERTICAL, 2023–2028 (USD MILLION)
                       TABLE 66 NORTH AMERICA: ZERO TRUST SECURITY MARKET, BY COUNTRY, 2017–2022 (USD MILLION)
                       TABLE 67 NORTH AMERICA: ZERO TRUST SECURITY MARKET, BY COUNTRY, 2023–2028 (USD MILLION)
             11.2.4 US
                       11.2.4.1 Weak password hygiene and increased concerns regarding cybersecurity to fuel demand for zero trust security solutions
                                   TABLE 68 US: ZERO TRUST SECURITY MARKET, BY OFFERING, 2017–2022 (USD MILLION)
                                   TABLE 69 US: ZERO TRUST SECURITY MARKET, BY OFFERING, 2023–2028 (USD MILLION)
                                   TABLE 70 US: ZERO TRUST SECURITY MARKET, BY SECURITY TYPE, 2017–2022 (USD MILLION)
                                   TABLE 71 US: ZERO TRUST SECURITY MARKET, BY SECURITY TYPE, 2023–2028 (USD MILLION)
                                   TABLE 72 US: ZERO TRUST SECURITY MARKET, BY AUTHENTICATION TYPE, 2017–2022 (USD MILLION)
                                   TABLE 73 US: ZERO TRUST SECURITY MARKET, BY AUTHENTICATION TYPE, 2023–2028 (USD MILLION)
                                   TABLE 74 US: ZERO TRUST SECURITY MARKET, BY VERTICAL, 2017–2022 (USD MILLION)
                                   TABLE 75 US: ZERO TRUST SECURITY MARKET, BY VERTICAL, 2023–2028 (USD MILLION)
             11.2.5 CANADA
                       11.2.5.1 Rising bot attacks and ransomware and increasing government initiatives to bolster cybersecurity to drive market
                                   TABLE 76 CANADA: ZERO TRUST SECURITY MARKET, BY OFFERING, 2017–2022 (USD MILLION)
                                   TABLE 77 CANADA: ZERO TRUST SECURITY MARKET, BY OFFERING, 2023–2028 (USD MILLION)
                                   TABLE 78 CANADA: ZERO TRUST SECURITY MARKET, BY SECURITY TYPE, 2017–2022 (USD MILLION)
                                   TABLE 79 CANADA: ZERO TRUST SECURITY MARKET, BY SECURITY TYPE, 2023–2028 (USD MILLION)
                                   TABLE 80 CANADA: ZERO TRUST SECURITY MARKET, BY AUTHENTICATION TYPE, 2017–2022 (USD MILLION)
                                   TABLE 81 CANADA: ZERO TRUST SECURITY MARKET, BY AUTHENTICATION TYPE, 2023–2028 (USD MILLION)
                                   TABLE 82 CANADA: ZERO TRUST SECURITY MARKET, BY VERTICAL, 2017–2022 (USD MILLION)
                                   TABLE 83 CANADA: ZERO TRUST SECURITY MARKET, BY VERTICAL, 2023–2028 (USD MILLION)
     11.3 EUROPE 
             11.3.1 EUROPE: ZERO TRUST SECURITY MARKET DRIVERS
             11.3.2 EUROPE: RECESSION IMPACT
             11.3.3 EUROPE: REGULATORY LANDSCAPE
                       TABLE 84 EUROPE: ZERO TRUST SECURITY MARKET, BY OFFERING, 2017–2022 (USD MILLION)
                       TABLE 85 EUROPE: ZERO TRUST SECURITY MARKET, BY OFFERING, 2023–2028 (USD MILLION)
                       TABLE 86 EUROPE: ZERO TRUST SECURITY MARKET, BY SECURITY TYPE, 2017–2022 (USD MILLION)
                       TABLE 87 EUROPE: ZERO TRUST SECURITY MARKET, BY SECURITY TYPE, 2023–2028 (USD MILLION)
                       TABLE 88 EUROPE: ZERO TRUST SECURITY MARKET, BY AUTHENTICATION TYPE, 2017–2022 (USD MILLION)
                       TABLE 89 EUROPE: ZERO TRUST SECURITY MARKET, BY AUTHENTICATION TYPE, 2023–2028 (USD MILLION)
                       TABLE 90 EUROPE: ZERO TRUST SECURITY MARKET, BY VERTICAL, 2017–2022 (USD MILLION)
                       TABLE 91 EUROPE: ZERO TRUST SECURITY MARKET, BY VERTICAL, 2023–2028 (USD MILLION)
                       TABLE 92 EUROPE: ZERO TRUST SECURITY MARKET, BY COUNTRY, 2017–2022 (USD MILLION)
                       TABLE 93 EUROPE: ZERO TRUST SECURITY MARKET, BY COUNTRY, 2023–2028 (USD MILLION)
             11.3.4 UK
                       11.3.4.1 Increased collaboration with forces to develop robust security solutions to drive market
                                   TABLE 94 UK: ZERO TRUST SECURITY MARKET, BY OFFERING, 2017–2022 (USD MILLION)
                                   TABLE 95 UK: ZERO TRUST SECURITY MARKET, BY OFFERING, 2023–2028 (USD MILLION)
                                   TABLE 96 UK: ZERO TRUST SECURITY MARKET, BY SECURITY TYPE, 2017–2022 (USD MILLION)
                                   TABLE 97 UK: ZERO TRUST SECURITY MARKET, BY SECURITY TYPE, 2023–2028 (USD MILLION)
                                   TABLE 98 UK: ZERO TRUST SECURITY MARKET, BY AUTHENTICATION TYPE, 2017–2022 (USD MILLION)
                                   TABLE 99 UK: ZERO TRUST SECURITY MARKET, BY AUTHENTICATION TYPE, 2023–2028 (USD MILLION)
                                   TABLE 100 UK: ZERO TRUST SECURITY MARKET, BY VERTICAL, 2017–2022 (USD MILLION)
                                   TABLE 101 UK: ZERO TRUST SECURITY MARKET, BY VERTICAL, 2023–2028 (USD MILLION)
             11.3.5 GERMANY
                       11.3.5.1 Rising cyberattacks on critical government websites and early adoption of cutting-edge technologies to drive market
                                   TABLE 102 GERMANY: ZERO TRUST SECURITY MARKET, BY OFFERING, 2017–2022 (USD MILLION)
                                   TABLE 103 GERMANY: ZERO TRUST SECURITY MARKET, BY OFFERING, 2023–2028 (USD MILLION)
                                   TABLE 104 GERMANY: ZERO TRUST SECURITY MARKET, BY SECURITY TYPE, 2017–2022 (USD MILLION)
                                   TABLE 105 GERMANY: ZERO TRUST SECURITY MARKET, BY SECURITY TYPE, 2023–2028 (USD MILLION)
                                   TABLE 106 GERMANY: ZERO TRUST SECURITY MARKET, BY AUTHENTICATION TYPE, 2017–2022 (USD MILLION)
                                   TABLE 107 GERMANY: ZERO TRUST SECURITY MARKET, BY AUTHENTICATION TYPE, 2023–2028 (USD MILLION)
                                   TABLE 108 GERMANY: ZERO TRUST SECURITY MARKET, BY VERTICAL, 2017–2022 (USD MILLION)
                                   TABLE 109 GERMANY: ZERO TRUST SECURITY MARKET, BY VERTICAL, 2023–2028 (USD MILLION)
             11.3.6 FRANCE
                       11.3.6.1 Increased internet use and need to safeguard sensitive data to boost demand for zero trust security solutions
                                   TABLE 110 FRANCE: ZERO TRUST SECURITY MARKET, BY OFFERING, 2017–2022 (USD MILLION)
                                   TABLE 111 FRANCE: ZERO TRUST SECURITY MARKET, BY OFFERING, 2023–2028 (USD MILLION)
                                   TABLE 112 FRANCE: ZERO TRUST SECURITY MARKET, BY SECURITY TYPE, 2017–2022 (USD MILLION)
                                   TABLE 113 FRANCE: ZERO TRUST SECURITY MARKET, BY SECURITY TYPE, 2023–2028 (USD MILLION)
                                   TABLE 114 FRANCE: ZERO TRUST SECURITY MARKET, BY AUTHENTICATION TYPE, 2017–2022 (USD MILLION)
                                   TABLE 115 FRANCE: ZERO TRUST SECURITY MARKET, BY AUTHENTICATION TYPE, 2023–2028 (USD MILLION)
                                   TABLE 116 FRANCE: ZERO TRUST SECURITY MARKET, BY VERTICAL, 2017–2022 (USD MILLION)
                                   TABLE 117 FRANCE: ZERO TRUST SECURITY MARKET, BY VERTICAL, 2023–2028 (USD MILLION)
             11.3.7 REST OF EUROPE
                       TABLE 118 REST OF EUROPE: ZERO TRUST SECURITY MARKET, BY OFFERING, 2017–2022 (USD MILLION)
                       TABLE 119 REST OF EUROPE: ZERO TRUST SECURITY MARKET, BY OFFERING, 2023–2028 (USD MILLION)
                       TABLE 120 REST OF EUROPE: ZERO TRUST SECURITY MARKET, BY SECURITY TYPE, 2017–2022 (USD MILLION)
                       TABLE 121 REST OF EUROPE: ZERO TRUST SECURITY MARKET, BY SECURITY TYPE, 2023–2028 (USD MILLION)
                       TABLE 122 REST OF EUROPE: ZERO TRUST SECURITY MARKET, BY AUTHENTICATION TYPE, 2017–2022 (USD MILLION)
                       TABLE 123 REST OF EUROPE: ZERO TRUST SECURITY MARKET, BY AUTHENTICATION TYPE, 2023–2028 (USD MILLION)
                       TABLE 124 REST OF EUROPE: ZERO TRUST SECURITY MARKET, BY VERTICAL, 2017–2022 (USD MILLION)
                       TABLE 125 REST OF EUROPE: ZERO TRUST SECURITY MARKET, BY VERTICAL, 2023–2028 (USD MILLION)
     11.4 ASIA PACIFIC 
             11.4.1 ASIA PACIFIC: ZERO TRUST SECURITY MARKET DRIVERS
             11.4.2 ASIA PACIFIC: RECESSION IMPACT
             11.4.3 ASIA PACIFIC: REGULATORY LANDSCAPE
                       FIGURE 30 ASIA PACIFIC: MARKET SNAPSHOT
                       TABLE 126 ASIA PACIFIC: ZERO TRUST SECURITY MARKET, BY OFFERING, 2017–2022 (USD MILLION)
                       TABLE 127 ASIA PACIFIC: ZERO TRUST SECURITY MARKET, BY OFFERING, 2023–2028 (USD MILLION)
                       TABLE 128 ASIA PACIFIC: ZERO TRUST SECURITY MARKET, BY SECURITY TYPE, 2017–2022 (USD MILLION)
                       TABLE 129 ASIA PACIFIC: ZERO TRUST SECURITY MARKET, BY SECURITY TYPE, 2023–2028 (USD MILLION)
                       TABLE 130 ASIA PACIFIC: ZERO TRUST SECURITY MARKET, BY AUTHENTICATION TYPE, 2017–2022 (USD MILLION)
                       TABLE 131 ASIA PACIFIC: ZERO TRUST SECURITY MARKET, BY AUTHENTICATION TYPE, 2023–2028 (USD MILLION)
                       TABLE 132 ASIA PACIFIC: ZERO TRUST SECURITY MARKET, BY VERTICAL, 2017–2022 (USD MILLION)
                       TABLE 133 ASIA PACIFIC: ZERO TRUST SECURITY MARKET, BY VERTICAL, 2023–2028 (USD MILLION)
                       TABLE 134 ASIA PACIFIC: ZERO TRUST SECURITY MARKET, BY COUNTRY, 2017–2022 (USD MILLION)
                       TABLE 135 ASIA PACIFIC: ZERO TRUST SECURITY MARKET, BY COUNTRY, 2023–2028 (USD MILLION)
             11.4.4 CHINA
                       11.4.4.1 Booming mobile internet services and increasing importance of online payment security to drive market
                                   TABLE 136 CHINA: ZERO TRUST SECURITY MARKET, BY OFFERING, 2017–2022 (USD MILLION)
                                   TABLE 137 CHINA: ZERO TRUST SECURITY MARKET, BY OFFERING, 2023–2028 (USD MILLION)
                                   TABLE 138 CHINA: ZERO TRUST SECURITY MARKET, BY SECURITY TYPE, 2017–2022 (USD MILLION)
                                   TABLE 139 CHINA: ZERO TRUST SECURITY MARKET, BY SECURITY TYPE, 2023–2028 (USD MILLION)
                                   TABLE 140 CHINA: ZERO TRUST SECURITY MARKET, BY AUTHENTICATION TYPE, 2017–2022 (USD MILLION)
                                   TABLE 141 CHINA: ZERO TRUST SECURITY MARKET, BY AUTHENTICATION TYPE, 2023–2028 (USD MILLION)
                                   TABLE 142 CHINA: ZERO TRUST SECURITY MARKET, BY VERTICAL, 2017–2022 (USD MILLION)
                                   TABLE 143 CHINA: ZERO TRUST SECURITY MARKET, BY VERTICAL, 2023–2028 (USD MILLION)
             11.4.5 JAPAN
                       11.4.5.1 Rising instances of cyberattacks to fuel demand for zero trust security solutions
                                   TABLE 144 JAPAN: ZERO TRUST SECURITY MARKET, BY OFFERING, 2017–2022 (USD MILLION)
                                   TABLE 145 JAPAN: ZERO TRUST SECURITY MARKET, BY OFFERING, 2023–2028 (USD MILLION)
                                   TABLE 146 JAPAN: ZERO TRUST SECURITY MARKET, BY SECURITY TYPE, 2017–2022 (USD MILLION)
                                   TABLE 147 JAPAN: ZERO TRUST SECURITY MARKET, BY SECURITY TYPE, 2023–2028 (USD MILLION)
                                   TABLE 148 JAPAN: ZERO TRUST SECURITY MARKET, BY AUTHENTICATION TYPE, 2017–2022 (USD MILLION)
                                   TABLE 149 JAPAN: ZERO TRUST SECURITY MARKET, BY AUTHENTICATION TYPE, 2023–2028 (USD MILLION)
                                   TABLE 150 JAPAN: ZERO TRUST SECURITY MARKET, BY VERTICAL, 2017–2022 (USD MILLION)
                                   TABLE 151 JAPAN: ZERO TRUST SECURITY MARKET, BY VERTICAL, 2023–2028 (USD MILLION)
             11.4.6 INDIA
                       11.4.6.1 Cultural shifts, budget constraints, and escalating threat of cyberattacks to drive market
                                   TABLE 152 INDIA: ZERO TRUST SECURITY MARKET, BY OFFERING, 2017–2022 (USD MILLION)
                                   TABLE 153 INDIA: ZERO TRUST SECURITY MARKET, BY OFFERING, 2023–2028 (USD MILLION)
                                   TABLE 154 INDIA: ZERO TRUST SECURITY MARKET, BY SECURITY TYPE, 2017–2022 (USD MILLION)
                                   TABLE 155 INDIA: ZERO TRUST SECURITY MARKET, BY SECURITY TYPE, 2023–2028 (USD MILLION)
                                   TABLE 156 INDIA: ZERO TRUST SECURITY MARKET, BY AUTHENTICATION TYPE, 2017–2022 (USD MILLION)
                                   TABLE 157 INDIA: ZERO TRUST SECURITY MARKET, BY AUTHENTICATION TYPE, 2023–2028 (USD MILLION)
                                   TABLE 158 INDIA: ZERO TRUST SECURITY MARKET, BY VERTICAL, 2017–2022 (USD MILLION)
                                   TABLE 159 INDIA: ZERO TRUST SECURITY MARKET, BY VERTICAL, 2023–2028 (USD MILLION)
             11.4.7 SINGAPORE
                       11.4.7.1 Increasing government initiatives to combat cyber threats to drive demand for zero trust security solutions
                                   TABLE 160 SINGAPORE: ZERO TRUST SECURITY MARKET, BY OFFERING, 2017–2022 (USD MILLION)
                                   TABLE 161 SINGAPORE: ZERO TRUST SECURITY MARKET, BY OFFERING, 2023–2028 (USD MILLION)
                                   TABLE 162 SINGAPORE: ZERO TRUST SECURITY MARKET, BY SECURITY TYPE, 2017–2022 (USD MILLION)
                                   TABLE 163 SINGAPORE: ZERO TRUST SECURITY MARKET, BY SECURITY TYPE, 2023–2028 (USD MILLION)
                                   TABLE 164 SINGAPORE: ZERO TRUST SECURITY MARKET, BY AUTHENTICATION TYPE, 2017–2022 (USD MILLION)
                                   TABLE 165 SINGAPORE: ZERO TRUST SECURITY MARKET, BY AUTHENTICATION TYPE, 2023–2028 (USD MILLION)
                                   TABLE 166 SINGAPORE: ZERO TRUST SECURITY MARKET, BY VERTICAL, 2017–2022 (USD MILLION)
                                   TABLE 167 SINGAPORE: ZERO TRUST SECURITY MARKET, BY VERTICAL, 2023–2028 (USD MILLION)
             11.4.8 AUSTRALIA
                       11.4.8.1 Focus of government on adopting robust cybersecurity strategies to drive market
                                   TABLE 168 AUSTRALIA: ZERO TRUST SECURITY MARKET, BY OFFERING, 2017–2022 (USD MILLION)
                                   TABLE 169 AUSTRALIA: ZERO TRUST SECURITY MARKET, BY OFFERING, 2023–2028 (USD MILLION)
                                   TABLE 170 AUSTRALIA: ZERO TRUST SECURITY MARKET, BY SECURITY TYPE, 2017–2022 (USD MILLION)
                                   TABLE 171 AUSTRALIA: ZERO TRUST SECURITY MARKET, BY SECURITY TYPE, 2023–2028 (USD MILLION)
                                   TABLE 172 AUSTRALIA: ZERO TRUST SECURITY MARKET, BY AUTHENTICATION TYPE, 2017–2022 (USD MILLION)
                                   TABLE 173 AUSTRALIA: ZERO TRUST SECURITY MARKET, BY AUTHENTICATION TYPE, 2023–2028 (USD MILLION)
                                   TABLE 174 AUSTRALIA: ZERO TRUST SECURITY MARKET, BY VERTICAL, 2017–2022 (USD MILLION)
                                   TABLE 175 AUSTRALIA: ZERO TRUST SECURITY MARKET, BY VERTICAL, 2023–2028 (USD MILLION)
             11.4.9 REST OF ASIA PACIFIC
                       TABLE 176 REST OF ASIA PACIFIC: ZERO TRUST SECURITY MARKET, BY OFFERING, 2017–2022 (USD MILLION)
                       TABLE 177 REST OF ASIA PACIFIC: ZERO TRUST SECURITY MARKET, BY OFFERING, 2023–2028 (USD MILLION)
                       TABLE 178 REST OF ASIA PACIFIC: ZERO TRUST SECURITY MARKET, BY SECURITY TYPE, 2017–2022 (USD MILLION)
                       TABLE 179 REST OF ASIA PACIFIC: ZERO TRUST SECURITY MARKET, BY SECURITY TYPE, 2023–2028 (USD MILLION)
                       TABLE 180 REST OF ASIA PACIFIC: ZERO TRUST SECURITY MARKET, BY AUTHENTICATION TYPE, 2017–2022 (USD MILLION)
                       TABLE 181 REST OF ASIA PACIFIC: ZERO TRUST SECURITY MARKET, BY AUTHENTICATION TYPE, 2023–2028 (USD MILLION)
                       TABLE 182 REST OF ASIA PACIFIC: ZERO TRUST SECURITY MARKET, BY VERTICAL, 2017–2022 (USD MILLION)
                       TABLE 183 REST OF ASIA PACIFIC: ZERO TRUST SECURITY MARKET, BY VERTICAL, 2023–2028 (USD MILLION)
     11.5 MIDDLE EAST & AFRICA 
             11.5.1 MIDDLE EAST & AFRICA: ZERO TRUST SECURITY MARKET DRIVERS
             11.5.2 MIDDLE EAST & AFRICA: RECESSION IMPACT
             11.5.3 MIDDLE EAST & AFRICA: REGULATORY LANDSCAPE
                       TABLE 184 MIDDLE EAST & AFRICA: ZERO TRUST SECURITY MARKET, BY OFFERING, 2017–2022 (USD MILLION)
                       TABLE 185 MIDDLE EAST & AFRICA: ZERO TRUST SECURITY MARKET, BY OFFERING, 2023–2028 (USD MILLION)
                       TABLE 186 MIDDLE EAST & AFRICA: ZERO TRUST SECURITY MARKET, BY SECURITY TYPE, 2017–2022 (USD MILLION)
                       TABLE 187 MIDDLE EAST & AFRICA: ZERO TRUST SECURITY MARKET, BY SECURITY TYPE, 2023–2028 (USD MILLION)
                       TABLE 188 MIDDLE EAST & AFRICA: ZERO TRUST SECURITY MARKET, BY AUTHENTICATION TYPE, 2017–2022 (USD MILLION)
                       TABLE 189 MIDDLE EAST & AFRICA: ZERO TRUST SECURITY MARKET, BY AUTHENTICATION TYPE, 2023–2028 (USD MILLION)
                       TABLE 190 MIDDLE EAST & AFRICA: ZERO TRUST SECURITY MARKET, BY VERTICAL, 2017–2022 (USD MILLION)
                       TABLE 191 MIDDLE EAST & AFRICA: ZERO TRUST SECURITY MARKET, BY VERTICAL, 2023–2028 (USD MILLION)
                       TABLE 192 MIDDLE EAST & AFRICA: ZERO TRUST SECURITY MARKET, BY COUNTRY, 2017–2022 (USD MILLION)
                       TABLE 193 MIDDLE EAST & AFRICA: ZERO TRUST SECURITY MARKET, BY COUNTRY, 2023–2028 (USD MILLION)
             11.5.4 MIDDLE EAST
                       11.5.4.1 Rapid digital transformation to encourage organizations prioritize implementing effective cybersecurity solutions
                                   TABLE 194 MIDDLE EAST: ZERO TRUST SECURITY MARKET, BY OFFERING, 2017–2022 (USD MILLION)
                                   TABLE 195 MIDDLE EAST: ZERO TRUST SECURITY MARKET, BY OFFERING, 2023–2028 (USD MILLION)
                                   TABLE 196 MIDDLE EAST: ZERO TRUST SECURITY MARKET, BY SECURITY TYPE, 2017–2022 (USD MILLION)
                                   TABLE 197 MIDDLE EAST: ZERO TRUST SECURITY MARKET, BY SECURITY TYPE, 2023–2028 (USD MILLION)
                                   TABLE 198 MIDDLE EAST: ZERO TRUST SECURITY MARKET, BY AUTHENTICATION TYPE, 2017–2022 (USD MILLION)
                                   TABLE 199 MIDDLE EAST: ZERO TRUST SECURITY MARKET, BY AUTHENTICATION TYPE, 2023–2028 (USD MILLION)
                                   TABLE 200 MIDDLE EAST: ZERO TRUST SECURITY MARKET, BY VERTICAL, 2017–2022 (USD MILLION)
                                   TABLE 201 MIDDLE EAST: ZERO TRUST SECURITY MARKET, BY VERTICAL, 2023–2028 (USD MILLION)
             11.5.5 AFRICA
                       11.5.5.1 Increasing awareness of people regarding zero trust security campaigns to drive market
                                   TABLE 202 AFRICA: ZERO TRUST SECURITY MARKET, BY OFFERING, 2017–2022 (USD MILLION)
                                   TABLE 203 AFRICA: ZERO TRUST SECURITY MARKET, BY OFFERING, 2023–2028 (USD MILLION)
                                   TABLE 204 AFRICA: ZERO TRUST SECURITY MARKET, BY SECURITY TYPE, 2017–2022 (USD MILLION)
                                   TABLE 205 AFRICA: ZERO TRUST SECURITY MARKET, BY SECURITY TYPE, 2023–2028 (USD MILLION)
                                   TABLE 206 AFRICA: ZERO TRUST SECURITY MARKET, BY AUTHENTICATION TYPE, 2017–2022 (USD MILLION)
                                   TABLE 207 AFRICA: ZERO TRUST SECURITY MARKET, BY AUTHENTICATION TYPE, 2023–2028 (USD MILLION)
                                   TABLE 208 AFRICA: ZERO TRUST SECURITY MARKET, BY VERTICAL, 2017–2022 (USD MILLION)
                                   TABLE 209 AFRICA: ZERO TRUST SECURITY MARKET, BY VERTICAL, 2023–2028 (USD MILLION)
     11.6 LATIN AMERICA 
             11.6.1 LATIN AMERICA: ZERO TRUST SECURITY MARKET DRIVERS
             11.6.2 LATIN AMERICA: RECESSION IMPACT
             11.6.3 LATIN AMERICA: REGULATORY LANDSCAPE
                       TABLE 210 LATIN AMERICA: ZERO TRUST SECURITY MARKET, BY OFFERING, 2017–2022 (USD MILLION)
                       TABLE 211 LATIN AMERICA: ZERO TRUST SECURITY MARKET, BY OFFERING, 2023–2028 (USD MILLION)
                       TABLE 212 LATIN AMERICA: ZERO TRUST SECURITY MARKET, BY SECURITY TYPE, 2017–2022 (USD MILLION)
                       TABLE 213 LATIN AMERICA: ZERO TRUST SECURITY MARKET, BY SECURITY TYPE, 2023–2028 (USD MILLION)
                       TABLE 214 LATIN AMERICA: ZERO TRUST SECURITY MARKET, BY AUTHENTICATION TYPE, 2017–2022 (USD MILLION)
                       TABLE 215 LATIN AMERICA: ZERO TRUST SECURITY MARKET, BY AUTHENTICATION TYPE, 2023–2028 (USD MILLION)
                       TABLE 216 LATIN AMERICA: ZERO TRUST SECURITY MARKET, BY VERTICAL, 2017–2022 (USD MILLION)
                       TABLE 217 LATIN AMERICA: ZERO TRUST SECURITY MARKET, BY VERTICAL, 2023–2028 (USD MILLION)
                       TABLE 218 LATIN AMERICA: ZERO TRUST SECURITY MARKET, BY COUNTRY, 2017–2022 (USD MILLION)
                       TABLE 219 LATIN AMERICA: ZERO TRUST SECURITY MARKET, BY COUNTRY, 2023–2028 (USD MILLION)
             11.6.4 BRAZIL
                       11.6.4.1 Evolving cybersecurity challenges due to rapid shift to remote work during pandemic to drive market
                                   TABLE 220 BRAZIL: ZERO TRUST SECURITY MARKET, BY OFFERING, 2017–2022 (USD MILLION)
                                   TABLE 221 BRAZIL: ZERO TRUST SECURITY MARKET, BY OFFERING, 2023–2028 (USD MILLION)
                                   TABLE 222 BRAZIL: ZERO TRUST SECURITY MARKET, BY SECURITY TYPE, 2017–2022 (USD MILLION)
                                   TABLE 223 BRAZIL: ZERO TRUST SECURITY MARKET, BY SECURITY TYPE, 2023–2028 (USD MILLION)
                                   TABLE 224 BRAZIL: ZERO TRUST SECURITY MARKET, BY AUTHENTICATION TYPE, 2017–2022 (USD MILLION)
                                   TABLE 225 BRAZIL: ZERO TRUST SECURITY MARKET, BY AUTHENTICATION TYPE, 2023–2028 (USD MILLION)
                                   TABLE 226 BRAZIL: ZERO TRUST SECURITY MARKET, BY VERTICAL, 2017–2022 (USD MILLION)
                                   TABLE 227 BRAZIL: ZERO TRUST SECURITY MARKET, BY VERTICAL, 2023–2028 (USD MILLION)
             11.6.5 MEXICO
                       11.6.5.1 Proliferation of connected devices and integration of XDR capabilities with zero trust principles to drive market
                                   TABLE 228 MEXICO: ZERO TRUST SECURITY MARKET, BY OFFERING, 2017–2022 (USD MILLION)
                                   TABLE 229 MEXICO: ZERO TRUST SECURITY MARKET, BY OFFERING, 2023–2028 (USD MILLION)
                                   TABLE 230 MEXICO: ZERO TRUST SECURITY MARKET, BY SECURITY TYPE, 2017–2022 (USD MILLION)
                                   TABLE 231 MEXICO: ZERO TRUST SECURITY MARKET, BY SECURITY TYPE, 2023–2028 (USD MILLION)
                                   TABLE 232 MEXICO: ZERO TRUST SECURITY MARKET, BY AUTHENTICATION TYPE, 2017–2022 (USD MILLION)
                                   TABLE 233 MEXICO: ZERO TRUST SECURITY MARKET, BY AUTHENTICATION TYPE, 2023–2028 (USD MILLION)
                                   TABLE 234 MEXICO: ZERO TRUST SECURITY MARKET, BY VERTICAL, 2017–2022 (USD MILLION)
                                   TABLE 235 MEXICO: ZERO TRUST SECURITY MARKET, BY VERTICAL, 2023–2028 (USD MILLION)
             11.6.6 REST OF LATIN AMERICA
                       TABLE 236 REST OF LATIN AMERICA: ZERO TRUST SECURITY MARKET, BY OFFERING, 2017–2022 (USD MILLION)
                       TABLE 237 REST OF LATIN AMERICA: ZERO TRUST SECURITY MARKET, BY OFFERING, 2023–2028 (USD MILLION)
                       TABLE 238 REST OF LATIN AMERICA: ZERO TRUST SECURITY MARKET, BY SECURITY TYPE, 2017–2022 (USD MILLION)
                       TABLE 239 REST OF LATIN AMERICA: ZERO TRUST SECURITY MARKET, BY SECURITY TYPE, 2023–2028 (USD MILLION)
                       TABLE 240 REST OF LATIN AMERICA: ZERO TRUST SECURITY MARKET, BY AUTHENTICATION TYPE, 2017–2022 (USD MILLION)
                       TABLE 241 REST OF LATIN AMERICA: ZERO TRUST SECURITY MARKET, BY AUTHENTICATION TYPE, 2023–2028 (USD MILLION)
                       TABLE 242 REST OF LATIN AMERICA: ZERO TRUST SECURITY MARKET, BY VERTICAL, 2017–2022 (USD MILLION)
                       TABLE 243 REST OF LATIN AMERICA: ZERO TRUST SECURITY MARKET, BY VERTICAL, 2023–2028 (USD MILLION)
 
12 COMPETITIVE LANDSCAPE (Page No. - 211)
     12.1 OVERVIEW 
     12.2 REVENUE ANALYSIS 
               FIGURE 31 REVENUE ANALYSIS
               FIGURE 32 HISTORICAL FIVE-YEAR REVENUE ANALYSIS OF KEY PUBLIC SECTOR ZERO TRUST SECURITY PROVIDERS
     12.3 MARKET SHARE ANALYSIS OF TOP MARKET PLAYERS 
               TABLE 244 ZERO TRUST SECURITY MARKET: INTENSITY OF COMPETITIVE RIVALRY
     12.4 RANKING OF TOP PLAYERS 
               FIGURE 33 RANKING OF TOP PLAYERS, 2023
     12.5 COMPANY EVALUATION MATRIX 
             12.5.1 STARS
             12.5.2 EMERGING LEADERS
             12.5.3 PERVASIVE PLAYERS
             12.5.4 PARTICIPANTS
                       FIGURE 34 COMPANY EVALUATION MATRIX, 2023
             12.5.5 COMPANY FOOTPRINT
                       FIGURE 35 OVERALL FOOTPRINT OF COMPANIES
     12.6 START-UP/SME EVALUATION MATRIX 
             12.6.1 PROGRESSIVE COMPANIES
             12.6.2 RESPONSIVE COMPANIES
             12.6.3 DYNAMIC COMPANIES
             12.6.4 STARTING BLOCKS
                       FIGURE 36 START-UP/SME EVALUATION MATRIX, 2023
             12.6.5 COMPETITIVE BENCHMARKING
                       TABLE 245 LIST OF START-UPS
     12.7 COMPETITIVE SCENARIO AND TRENDS 
             12.7.1 PRODUCT LAUNCHES & ENHANCEMENTS
                       TABLE 246 ZERO TRUST SECURITY MARKET: PRODUCT LAUNCHES & ENHANCEMENTS, 2023–2021
             12.7.2 DEALS
                       TABLE 247 ZERO TRUST SECURITY MARKET: DEALS, 2023–2021
 
13 COMPANY PROFILES (Page No. - 233)
(Business Overview, Products/Solutions/Services Offered, Recent Developments, MnM view (Key strengths/Right to win, Strategic choices made, Weakness/competitive threats)*
     13.1 KEY PLAYERS 
             13.1.1 PALO ALTO NETWORKS
                       TABLE 248 PALO ALTO NETWORKS: BUSINESS OVERVIEW
                       FIGURE 37 PALO ALTO NETWORKS: COMPANY SNAPSHOT
                       TABLE 249 PALO ALTO NETWORKS: PRODUCTS/SOLUTIONS/SERVICES OFFERED
                       TABLE 250 PALO ALTO NETWORKS: PRODUCT LAUNCHES & ENHANCEMENTS
                       TABLE 251 PALO ALTO NETWORKS: DEALS
             13.1.2 VMWARE
                       TABLE 252 VMWARE: BUSINESS OVERVIEW
                       FIGURE 38 VMWARE: COMPANY SNAPSHOT
                       TABLE 253 VMWARE: PRODUCTS/SOLUTIONS/SERVICES OFFERED
                       TABLE 254 VMWARE: PRODUCT LAUNCHES & ENHANCEMENTS
                       TABLE 255 VMWARE: DEALS
             13.1.3 ZSCALER
                       TABLE 256 ZSCALER: BUSINESS OVERVIEW
                       FIGURE 39 ZSCALER: COMPANY SNAPSHOT
                       TABLE 257 ZSCALER: PRODUCTS/SOLUTIONS/SERVICES OFFERED
                       TABLE 258 ZSCALER: PRODUCT LAUNCHES & ENHANCEMENTS
                       TABLE 259 ZSCALER: DEALS
             13.1.4 AKAMAI
                       TABLE 260 AKAMAI: BUSINESS OVERVIEW
                       FIGURE 40 AKAMAI: COMPANY SNAPSHOT
                       TABLE 261 AKAMAI: PRODUCTS/SOLUTIONS/SERVICES OFFERED
                       TABLE 262 AKAMAI: PRODUCT LAUNCHES & ENHANCEMENTS
                       TABLE 263 AKAMAI: DEALS
             13.1.5 MICROSOFT
                       TABLE 264 MICROSOFT: BUSINESS OVERVIEW
                       FIGURE 41 MICROSOFT: COMPANY SNAPSHOT
                       TABLE 265 MICROSOFT: PRODUCTS/SOLUTIONS/SERVICES OFFERED
                       TABLE 266 MICROSOFT: PRODUCT LAUNCHES & ENHANCEMENTS
                       TABLE 267 MICROSOFT: DEALS
             13.1.6 CISCO
                       TABLE 268 CISCO: BUSINESS OVERVIEW
                       FIGURE 42 CISCO: COMPANY SNAPSHOT
                       TABLE 269 CISCO: PRODUCTS/SOLUTIONS/SERVICES OFFERED
                       TABLE 270 CISCO: PRODUCT LAUNCHES & ENHANCEMENTS
                       TABLE 271 CISCO: DEALS
             13.1.7 IBM
                       TABLE 272 IBM: BUSINESS OVERVIEW
                       FIGURE 43 IBM: COMPANY SNAPSHOT
                       TABLE 273 IBM: PRODUCTS/SOLUTIONS/SERVICES OFFERED
                       TABLE 274 IBM: PRODUCT LAUNCHES & ENHANCEMENTS
                       TABLE 275 IBM: DEALS
             13.1.8 CITRIX
                       TABLE 276 CITRIX: BUSINESS OVERVIEW
                       TABLE 277 CITRIX: PRODUCTS/SOLUTIONS/SERVICES OFFERED
                       TABLE 278 CITRIX: PRODUCT LAUNCHES & ENHANCEMENTS
                       TABLE 279 CITRIX: DEALS
             13.1.9 CHECK POINT
                       TABLE 280 CHECK POINT: BUSINESS OVERVIEW
                       FIGURE 44 CHECK POINT: COMPANY SNAPSHOT
                       TABLE 281 CHECK POINT: PRODUCTS/SOLUTIONS/SERVICES OFFERED
                       TABLE 282 CHECK POINT: PRODUCT LAUNCHES & ENHANCEMENTS
                       TABLE 283 CHECK POINT: DEALS
             13.1.10 TRELLIX
                       TABLE 284 TRELLIX: BUSINESS OVERVIEW
                       TABLE 285 TRELLIX: PRODUCTS/SOLUTIONS/SERVICES OFFERED
                       TABLE 286 TRELLIX: PRODUCT LAUNCHES & ENHANCEMENTS
             13.1.11 FORCEPOINT
                       TABLE 287 FORCEPOINT: BUSINESS OVERVIEW
                       TABLE 288 FORCEPOINT: PRODUCTS/SOLUTIONS/SERVICES OFFERED
                       TABLE 289 FORCEPOINT: PRODUCT LAUNCHES & ENHANCEMENTS
                       TABLE 290 FORCEPOINT: DEALS
             13.1.12 CROWDSTRIKE
                       TABLE 291 CROWDSTRIKE: BUSINESS OVERVIEW
                       FIGURE 45 CROWDSTRIKE: COMPANY SNAPSHOT
                       TABLE 292 CROWDSTRIKE: PRODUCTS/SOLUTIONS/SERVICES OFFERED
                       TABLE 293 CROWDSTRIKE: PRODUCT LAUNCHES & ENHANCEMENTS
                       TABLE 294 CROWDSTRIKE: DEALS
             13.1.13 CLOUDFLARE
                       TABLE 295 CLOUDFLARE: BUSINESS OVERVIEW
                       FIGURE 46 CLOUDFLARE: COMPANY SNAPSHOT
                       TABLE 296 CLOUDFLARE: PRODUCTS/SOLUTIONS/SERVICES OFFERED
                       TABLE 297 CLOUDFLARE: PRODUCT LAUNCHES & ENHANCEMENTS
                       TABLE 298 CLOUDFLARE: DEALS
             13.1.14 FORTINET
                       TABLE 299 FORTINET: BUSINESS OVERVIEW
                       FIGURE 47 FORTINET: COMPANY SNAPSHOT
                       TABLE 300 FORTINET: PRODUCTS/SOLUTIONS/SERVICES OFFERED
                       TABLE 301 FORTINET: PRODUCT LAUNCHES & ENHANCEMENTS
                       TABLE 302 FORTINET: DEALS
             13.1.15 GOOGLE
                       TABLE 303 GOOGLE: BUSINESS OVERVIEW
                       FIGURE 48 GOOGLE: COMPANY SNAPSHOT
                       TABLE 304 GOOGLE: PRODUCTS/SOLUTIONS/SERVICES OFFERED
                       TABLE 305 GOOGLE: PRODUCT LAUNCHES & ENHANCEMENTS
                       TABLE 306 GOOGLE: DEALS
             13.1.16 QNEXT
                       TABLE 307 QNEXT: BUSINESS OVERVIEW
                       TABLE 308 QNEXT: PRODUCTS/SOLUTIONS/SERVICES OFFERED
                       TABLE 309 QNEXT: PRODUCT LAUNCHES & ENHANCEMENTS
                       TABLE 310 QNEXT: DEALS
     13.2 OTHER KEY PLAYERS 
             13.2.1 ILLUMIO
             13.2.2 ON2IT
             13.2.3 PERIMETER 81
             13.2.4 THREATLOCKER
             13.2.5 TWINGATE
             13.2.6 APPGATE
             13.2.7 ZERO NETWORKS
             13.2.8 ZENTERA
             13.2.9 XAGE
             13.2.10 SKYHIGH SECURITY
*Details on Business Overview, Products/Solutions/Services Offered, Recent Developments, MnM view (Key strengths/Right to win, Strategic choices made, Weakness/competitive threats)* might not be captured in case of unlisted companies.
 
14 ADJACENT MARKETS (Page No. - 307)
     14.1 INTRODUCTION 
               TABLE 311 ADJACENT MARKETS AND FORECASTS
     14.2 LIMITATIONS 
     14.3 IDENTITY AND ACCESS MANAGEMENT (IAM) MARKET 
             14.3.1 IDENTITY AND ACCESS MANAGEMENT MARKET, BY OFFERING
                       TABLE 312 IDENTITY AND ACCESS MANAGEMENT MARKET, BY OFFERING, 2017–2022 (USD MILLION)
                       TABLE 313 IDENTITY AND ACCESS MANAGEMENT MARKET, BY OFFERING, 2023–2028 (USD MILLION)
                       TABLE 314 SOLUTIONS: IDENTITY AND ACCESS MANAGEMENT MARKET, BY REGION, 2017–2022 (USD MILLION)
                       TABLE 315 SOLUTIONS: IDENTITY AND ACCESS MANAGEMENT MARKET, BY REGION, 2023–2028 (USD MILLION)
                       TABLE 316 SERVICES: IDENTITY AND ACCESS MANAGEMENT MARKET, BY REGION, 2017–2022 (USD MILLION)
                       TABLE 317 SERVICES: IDENTITY AND ACCESS MANAGEMENT MARKET, BY REGION, 2023–2028 (USD MILLION)
     14.4 CYBERSECURITY MARKET 
             14.4.1 CYBERSECURITY MARKET, BY COMPONENT
                       TABLE 318 CYBERSECURITY MARKET, BY COMPONENT, 2016–2021 (USD MILLION)
                       TABLE 319 CYBERSECURITY MARKET, BY COMPONENT, 2022–2027 (USD MILLION)
                       TABLE 320 HARDWARE MARKET, BY REGION, 2016–2021 (USD MILLION)
                       TABLE 321 HARDWARE MARKET, BY REGION, 2022–2027 (USD MILLION)
                       TABLE 322 SOFTWARE MARKET, BY REGION, 2016–2021 (USD MILLION)
                       TABLE 323 SOFTWARE MARKET, BY REGION, 2022–2027 (USD MILLION)
                       TABLE 324 SERVICES MARKET, BY REGION, 2016–2021 (USD MILLION)
                       TABLE 325 SERVICES MARKET, BY REGION, 2022–2027 (USD MILLION)
 
15 APPENDIX (Page No. - 313)
     15.1 DISCUSSION GUIDE 
     15.2 KNOWLEDGESTORE: MARKETSANDMARKETS’ SUBSCRIPTION PORTAL 
     15.3 CUSTOMIZATION OPTIONS 
     15.4 RELATED REPORTS 
     15.5 AUTHOR DETAILS 

The study involved major activities in estimating the current market size for the Zero Trust Security market. Exhaustive secondary research was done to collect information on the Zero Trust Security industry. The next step was to validate these findings, assumptions, and sizing with industry experts across the value chain using primary research. Different approaches, such as top-down and bottom-up, were employed to estimate the total market size. After that, the market breakup and data triangulation procedures were used to estimate the market size of the segments and subsegments of the Zero Trust Security market.

Secondary Research

The market for the companies offering Zero Trust Security and services is arrived at by secondary data available through paid and unpaid sources, analyzing the product portfolios of the major companies in the ecosystem, and rating the companies by their performance and quality. Various sources were referred to in the secondary research process to identify and collect information for this study. The secondary sources include annual reports, press releases, investor presentations of companies, white papers, journals, and certified publications and articles from recognized authors, directories, and databases.

In the secondary research process, various secondary sources were referred to for identifying and collecting information related to the study. Secondary sources included annual reports, press releases, and investor presentations of Zero Trust Security vendors, forums, certified publications, and whitepapers. The secondary research was used to obtain critical information on the industry’s value chain, the total pool of key players, market classification, and segmentation from the market and technology-oriented perspectives.

Primary Research

In the primary research process, various primary sources from both the supply and demand sides were interviewed to obtain qualitative and quantitative information for this report. The primary sources from the supply side included industry experts, such as Chief Executive Officers (CEOs), Vice Presidents (VPs), marketing directors, technology and innovation directors, and related key executives from various key companies and organizations operating in the Zero Trust Security market.

After the complete market engineering (calculations for market statistics, market breakdown, market size estimations, market forecasting, and data triangulation), extensive primary research was conducted to gather information and verify and validate the critical numbers arrived at. Primary research was also conducted to identify the segmentation types, industry trends, competitive landscape of Zero Trust Security solutions offered by various market players, and key market dynamics, such as drivers, restraints, opportunities, challenges, industry trends, and key player strategies.

In the complete market engineering process, the top-down and bottom-up approaches were extensively used, along with several data triangulation methods, to perform the market estimation and market forecasting for the overall market segments and subsegments listed in this report. Extensive qualitative and quantitative analysis was performed on the complete market engineering process to list the key information/insights throughout the report.

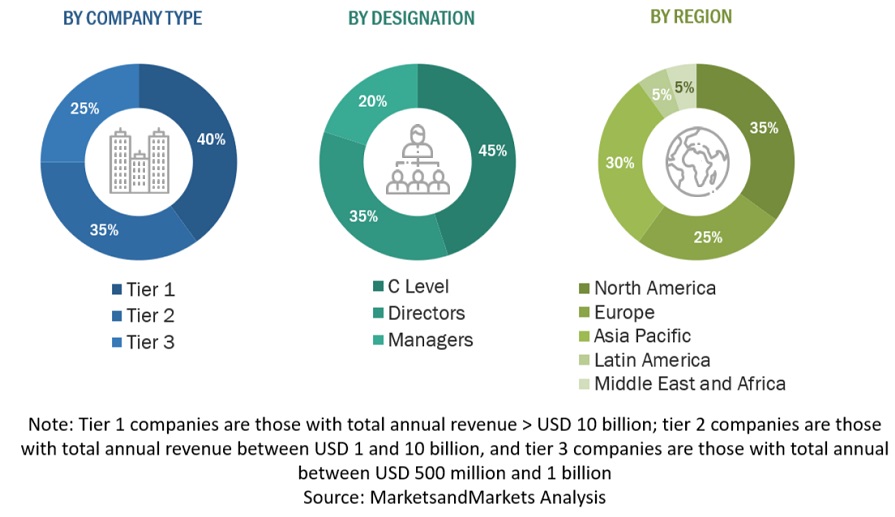
Following is the breakup of the primary study:
Zero Trust Security Market Size, and Share

To know about the assumptions considered for the study, download the pdf brochure

Market Size Estimation

Top-down and bottom-up approaches were used to estimate and validate the size of the global Zero Trust Security market and estimate the size of various other dependent sub-segments in the overall Zero Trust Security market. The research methodology used to estimate the market size includes the following details: key players in the market were identified through secondary research, and their market shares in the respective regions were determined through primary and secondary research. This entire procedure included the study of the annual and financial reports of the top market players, and extensive interviews were conducted for key insights from the industry leaders, such as CEOs, VPs, directors, and marketing executives.

All percentage splits and breakdowns were determined using secondary sources and verified through primary sources. All possible parameters that affect the market covered in this research study have been accounted for, viewed in extensive detail, verified through primary research, and analyzed to get the final quantitative and qualitative data. This data is consolidated and added to detailed inputs and analysis from MarketsandMarkets.

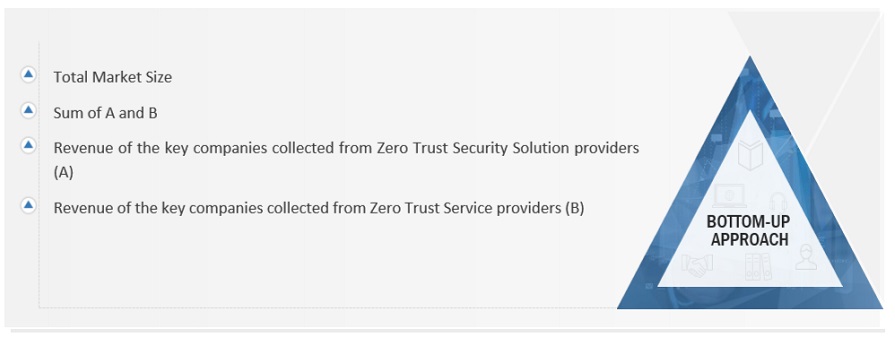
Infographic Depicting Bottom-Up and Top-Down Approaches
Zero Trust Security Market Size, and Share

To know about the assumptions considered for the study, Request for Free Sample Report

Zero Trust Security Market Size, and Share

Data Triangulation

After arriving at the overall market size using the market size estimation processes explained above, the market was split into several segments and subsegments. The data triangulation and market breakup procedures were employed, wherever applicable, to complete the overall market engineering process and arrive at the exact statistics of each market segment and subsegment. The data was triangulated by studying various factors and trends from both the demand and supply sides.

Market Definition

The US National Institute of Standards and Technology (NIST), in its current draft of standards for zero trust architecture, defines zero trust in the following manner: “Zero trust is a cybersecurity paradigm focused on resource protection and the premise that trust is never granted implicitly but must be continually evaluated.” Zero trust security is, therefore, not only a product or an approach--it’s a web of connected policies, practices, software, and hardware that create an entire zero-trust ecosystem.

Key Stakeholders

  • Government agencies
  • Zero trust security solution vendors
  • System integrators
  • Value-Added Resellers (VARs)
  • Information Technology (IT) security agencies
  • Research organizations
  • Distribution partners
  • Privacy specialists

Report Objectives

  • To define, describe, and forecast the Zero Trust Security market based on - offering, security type, authentication type, vertical, and region.
  • To define, describe, and forecast the market by - offering, security type, authentication type, vertical, and region.
  • To forecast the market size of five main regions: North America, Europe, Asia Pacific (APAC), Middle East & Africa (MEA), and Latin America
  • To analyze the subsegments of the market concerning individual growth trends, prospects, and contributions to the overall market
  • To provide detailed information related to the major factors (drivers, restraints, opportunities, and challenges) influencing the growth of the market
  • To analyze opportunities in the market for stakeholders by identifying high-growth segments of the market
  • To profile the key players of the market and comprehensively analyze their market size and core competencies in the market
  • To track and analyze competitive developments, such as new product launches; mergers and acquisitions; and partnerships, agreements, and collaborations in the global Zero Trust Security market.

Customization Options

With the given market data, MarketsandMarkets offers customizations based on company-specific needs. The following customization options are available for the report:

Geographic Analysis

  • Further breakup of the Asia Pacific market into countries contributing 75% to the regional market size
  • Further breakup of the North American market into countries contributing 75% to the regional market size
  • Further breakup of the Latin American market into countries contributing 75% to the regional market size
  • Further breakup of the Middle Eastern and African market into countries contributing 75% to the regional market size
  • Further breakup of the European market into countries contributing 75% to the regional market size

Company Information

  • Detailed analysis and profiling of additional market players (up to 5)
Custom Market Research Services

We will customize the research for you, in case the report listed above does not meet with your exact requirements. Our custom research will comprehensively cover the business information you require to help you arrive at strategic and profitable business decisions.

Request Customization

Instant Answers with GPT - Ask Now!

Ask real questions. Get complete answers !
Report Code
TC 7384
Published ON
Sep, 2023
Choose License Type
BUY NOW
  • SHARE
X
Request Customization
Speak to Analyst
Speak to Analyst
OR FACE-TO-FACE MEETING
PERSONALIZE THIS RESEARCH
  • Triangulate with your Own Data
  • Get Data as per your Format and Definition
  • Gain a Deeper Dive on a Specific Application, Geography, Customer or Competitor
  • Any level of Personalization
REQUEST A FREE CUSTOMIZATION
LET US HELP YOU!
  • What are the Known and Unknown Adjacencies Impacting the Zero Trust Security Market
  • What will your New Revenue Sources be?
  • Who will be your Top Customer; what will make them switch?
  • Defend your Market Share or Win Competitors
  • Get a Scorecard for Target Partners
CUSTOMIZED WORKSHOP REQUEST
+1-888-600-6441
  • Call Us
  • +1-888-600-6441 (Corporate office hours)
  • +1-888-600-6441 (US/Can toll free)
  • +44-800-368-9399 (UK office hours)
CONNECT WITH US
ABOUT TRUST ONLINE
©2024 MarketsandMarkets Research Private Ltd. All rights reserved
DMCA.com Protection Status Website Feedback