Zero Trust Security Market

Report Code TC 7384
Published in Jul, 2024, By MarketsandMarkets™
Download PDF

Choose License Type

Buy Report Now Inquire Before Buying

Zero Trust Security Market Size Share, Growth Analysis, By Offering (Solutions and Services), Application, Security type, Authentication Type, Vertical (Retail & E-commerce, Healthcare, Energy & Utilities) and Region - Global Industry Forecast to 2029

Overview

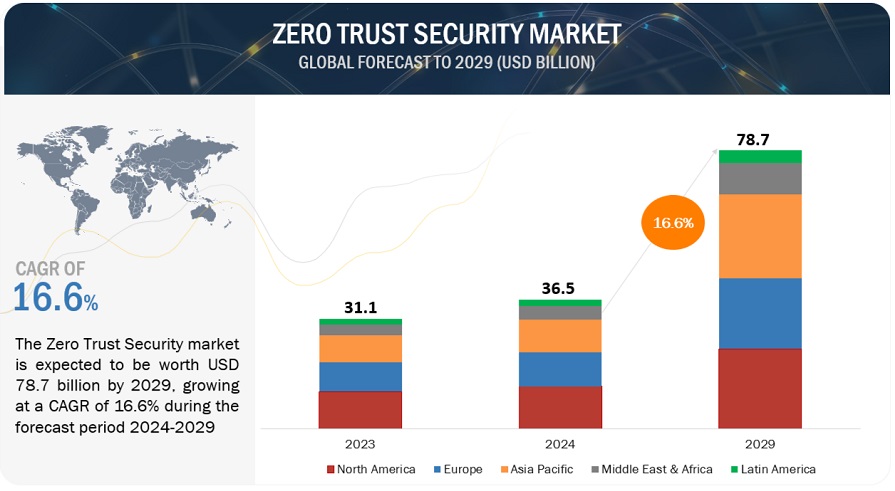
The global Zero Trust Security Market is projected to grow from USD 36.5 billion in 2024 to USD 78.7 billion by 2029 at a compound annual growth rate (CAGR) of 16.6% during the forecast period. The zero trust security market is showing promising growth due to the rising threat of cyberattacks. The zero trust security market is growing fast as cyber threats get more complex and companies move to remote work and cloud systems. Zero trust security’s main idea is never to trust; always check. That means every user and device must prove who they are before they can access anything, no matter where they are from. This approach has fallen in sight because of several reasons: more cyberattacks, more use of cloud tech, more people working from home, and stricter rules about data privacy. They primarily focus on combining zero trust with Secure Access Service Edge (SASE) and using AI and machine learning to boost security. Since hackers are coming up with new tricks, zero trust is becoming a must-have for companies to guard their sensitive info and systems in this digital world.

Attractive Opportunities in the Zero Trust Security Market

ASIA PACIFIC:

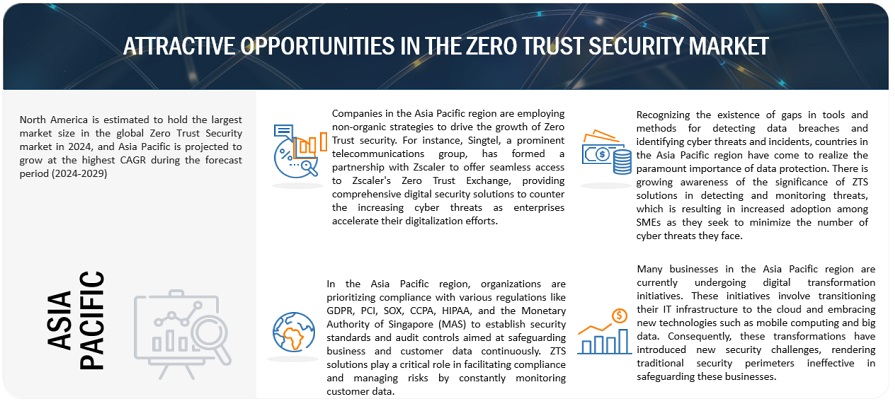
North America is estimated to hold the largest market size of the global Application Security market in 2024, and Asia Pacific is projected to grow at the highest CAGR during the forecast period.

Companies in the Asia Pacific region are employing non-organic strategies to drive the growth of Zero Trust security. For instance, Singtel, a prominent telecommunications group, has formed a partnership with Zscaler to offer seamless access to Zscaler's Zero Trust Exchange, providing comprehensive digital security solutions to counter the increasing cyber threats as enterprises accelerate their digitalization efforts

Recognizing the existence of gaps in tools and methods for detecting data breaches and identifying cyber threats and incidents, countries in the Asia Pacific region have come to realize the paramount importance of data protection. There is growing awareness of the significance of ZTS solutions in detecting and monitoring threats, which is resulting in increased adoption among SMEs as they seek to minimize the number of cyber threats they face.

In the Asia Pacific region, organizations are prioritizing compliance with various regulations like GDPR, PCI, SOX, CCPA, HIPAA, and the Monetary Authority of Singapore (MAS) to establish security standards and audit controls aimed at safeguarding business and customer data continuously. ZTS solutions play a critical role in facilitating compliance and managing risks by constantly monitoring customer data.

Many businesses in the Asia Pacific region are currently undergoing digital transformation initiatives. These initiatives involve transitioning their IT infrastructure to the cloud and embracing new technologies such as mobile computing and big data. Consequently, these transformations have introduced new security challenges, rendering traditional security perimeters ineffective in safeguarding these businesses

Global Zero Trust Security Market Dynamics

DRIVER: Rapid adoption of cloud and surge in digital transformation.

Organizations need advanced security for protection in complex IT environments; therefore, zero trust security becomes very important in protecting relevant data and avoiding losses. Traditional perimeter-based security no longer works in the wake of such aspects as remote work, mobile devices, and cloud computing that give blanket access once into the network. Zero trust security enforces strict access control and continuous authentication at all times so that users' access is thus verified and limited. It avoids the lateral movement of threats and offers better protection of critical data; therefore, its rise as a robust alternative has been witnessed. This means every request, whether user, device, or application request, must be continuously authenticated and allowed within the internal network. It reduces the chance of unauthorized access and the lateral movement of threats by making sure that only authenticated entities have access to important resources and data. As digital transformation and cloud adoption, together, result in enterprises facing a really complicated, networked IT environment for securing data and apps, establishing a strong, very advanced security solution to protect critical data and prevent losses becomes mandatory. As far as this respect is concerned, cloud computing and development in digital transformation have accelerated the demand for zero trust security solutions that reduce unauthorized threats and ensure access of key resources to only authorized persons. The increasing adoption of cloud environments and the current digital transformation act as drivers in the zero-trust security market. The "digital transformation"—that is, the process of integrating digital technologies into all facets of business operations—begets a much more complex and networked IT environment. This in effect means that businesses are rapidly deploying many devices, cloud-based applications, and networked systems that increase the attack surface for cyberattacks. The increased leverage of multi-cloud settings underscores a security plan designed to protect apps and their data across a number of cloud platforms. In that respect, zero trust security is implemented more successfully in businesses. Zero trust security follows the adage, "never trust, always verify".

RESTRAINT: Complexity and costly implementation

The implementation of zero-trust security for any business, particularly for those with expansive and complicated network infrastructures, which can be quite a difficult and expensive procedure. Since it is complex and hard to understand and implement, it can contain potential mistakes in its implementation that may further endanger the security of the organization. It is also an expensive security approach that shall require the installation of new equipment and software and training of IT personnel. This may put certain organizations under a considerable financial burden. Moreover, this approach requires considerable changes in existing IT policies, procedures, and systems, which itself is a time- as well as a resource-consuming process. Furthermore, the upfront cost and continuous maintenance make some firms reluctant to adapt zero trust security solution at all. For instance, imposing zero-trust security creates problems in a multi-national organization with an extensive network architecture. The network is across multiple sites; underpinning it are a number of legacy systems that are very hard to integrate with modern zero-trust solutions. The cost in terms of redesigning the whole network and integration with legacy systems to include zero-trust security has resulted in the adoption process grinding to a halt.


OPPORTUNITY: Surge in awareness regarding zero trust security

The growing awareness regarding zero-trust security is creating huge opportunities for businesses in the cybersecurity sector. The zero-trust security designs its way to become the viable replacement for traditional methods under increasing cyber threats in terms of frequency and inadequacy. More education in this regard means a more potent market for the zero-trust security solution, ultimately leading to growing demands for related goods and services. It builds a very promising market for zero-trust security because now, organizations seek and look to invest in zero-trust security to further beef up the cybersecurity posture.This increased level of awareness has precipitated openings for a good number of support services within the zero-trust security space. Cybersecurity consulting businesses will make hay by offering expert advice on how to correctly install and integrate such solutions for businesses that would like to do so successfully. As corporations crave to have their staff well-versed with the best practices and principles of zero-trust security, there is a corresponding surge in demand for educative material and training courses. The companies are also eying joint ventures and collaborations with other firms, including cloud service providers, toward the building of a uniform and all-inclusive security ecosystem. Hence, businesses are tactically positioning themselves to provide for these companies' changing security needs and benefit from increased demand for reliable and flexible security solutions as the awareness provided by these changing needs expands.

CHALLENGES: Growth of shadow SaaS applications

Business-led IT or Shadow SaaS is what it is called when employees obtain and implement IT services without any sort of notification or approval from the IT Department. It is becoming more common for this phenomenon to happen today. Cloud storage and SaaS apps can be examples among many other IT services. The most important benefits of business-led IT are simplicity and speed of access to apps. Implementation into a zero-trust security framework itself, in the best-case scenario, will take weeks or months, killing the benefits brought about by efficiency and corporate agility. EmployeesThis can often mean that productivity-enhancing SaaS applications get bought directly by the would-be productive, bypassing the formal procurement process and the IT department—a challenge for zero-trust security. This thus implies that these rogue applications are a security threat since they are beyond the institution's security policy control and may uphold different security standards as other apps. An example is that shadow Saas applications may not be encrypted, patched rarely, or audited for vulnerabilities; they hence expose themselves to far greater degrees of cyber-attacks as a result.

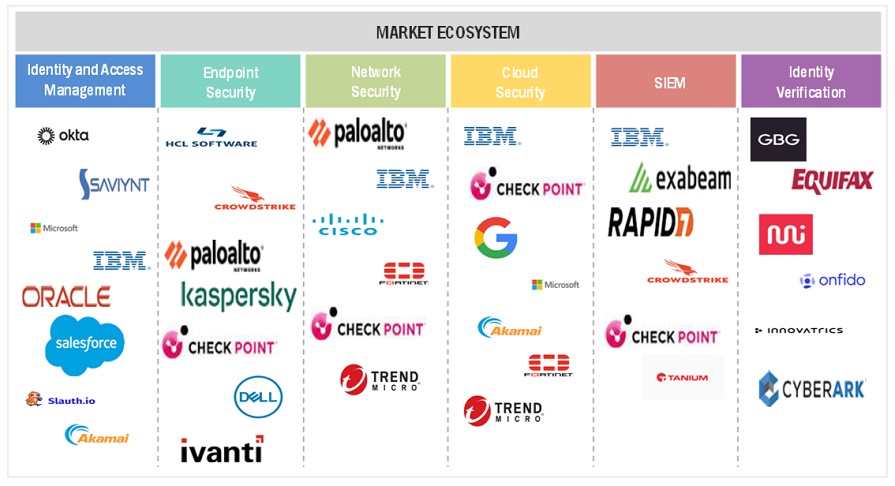
Global Zero Trust Security Market Ecosystem Analysis

By vertical, the IT&ITeS segment is to account for a larger market size during the forecast period. This can be attributed to the massive growth that the information technology and IT-enabled services industries have been registering in North America, Europe, and the Asia Pacific, hence becoming a most preferred target with its rapid growth and volume of sensitive employee and company data. Besides, cloud computing, IoT devices, and BYOD rules only add to the proliferation in the attack surface, which has grown multi-fold. The very critical communication infrastructure remains in the hands of telecom operators, who themselves become a target for sophisticated attacks, including ransomware and DDoS attacks, with an aim to put at risk sensitive data. The two major factors driving this trend are Z regulations and the sophistication of modern-day cyber-attacks. Zero Trust security solutions are protecting the world's infrastructure; it is one of the tools available for IT companies and IT service providers to effectively wage back in the face of growing cyber threats.


By Security Type, the Cloud Security segment is to account for a larger market size during the forecast period

Zero-trust security concepts are of growing importance in a fast-changing cybersecurity environment, particularly in the context of the cloud. Distributed apps and data in the adoption of cloud computing present a problem to organizations wishing to monitor access, usage of data, and security policy compliance. A variety of cloud security solutions have been developed following the paradigm of Zero Trust to help solve these issues. CASBs are mediators that provide close access control and constant monitoring of user activities in cloud applications. The proper and continuous assessment and hardening of cloud configurations are important means through which CSPM tools contribute to the reduction of vulnerabilities and the assurance of good security postures. CWPPs implement a model of workload protection for cloud-native applications that's based on "never trust, always verify.".

By Authentication Type, the Multi-factor Authentication to grow at a higher CAGR during the forecast period

Multi-factor authentication basically combines a few identifiers from people and from computers or software to verify one's identification. These can include passwords or PINs, passports, tokens, access cards, software certificates, biometric data, fingerprints, face recognition, and so on that constitute these identifiers. The development of multi-factor authentication has been the real backbone in identity verification and authentication. Some of the most popular MFA identifiers in use today are user passwords/PINs, cryptographic hardware security tokens, smartcards, software-based certificates, and a large group of techniques using biometric factors like retinal scans, fingerprint scans, facial recognition, and voice recognition. MFA forms a base component of the zero-trust security model since it creates a high-valued barrier to entry that will keep unauthorized users out of the system in case an attacker has managed to compromise one component. Since successful verification normally happens in a single session, MFA can effectively block attacks like persistence and lateral movement.According to the PCI DSS rules, MFA solutions are a must for companies processing sensitive data, more so those within the sphere of payments. One major driving force behind the wide adoption of MFA across industries such as BFSI, government & defense, IT and telecom, healthcare, retail & eCommerce, energy & power, and manufacturing is the growing demand for robust identification and authentication techniques to protect sensitive information. Key players in zero-trust security develop highly advanced multi-factor authentication solutions by integrating state-of-the-art technologies, such as vein detection, thermal image identification, hand geometry, etc., which, in turn, would raise the market's further growth globally.

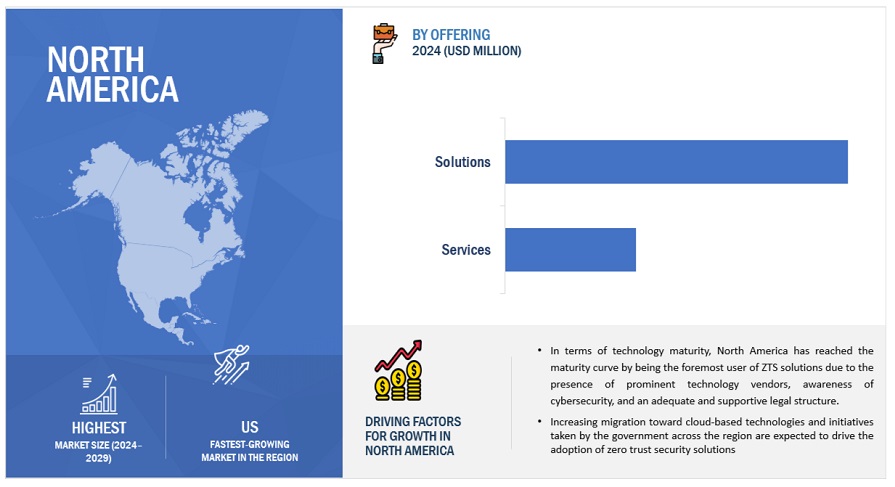
NORTH AMERICA Region Holds the Largest Share of the Zero Trust Security Market.

The North American market, including the US and Canada, is characterized by a high concentration of security vendors and a rise in cyberattacks. This sector may maintain a leading position in the zero trust security market for some time to come because of its early adoption of cutting-edge technologies. The increase in sophisticated cyberattacks is one of the key factors driving businesses to implement zero trust security solutions. The increasing usage of IoT, digital payments, cloud-based apps, and OT, as well as industries including banking, finance, government, and healthcare, the region is now more susceptible to cyberattacks. This was demonstrated in the January MailChimp attack, where hackers gained unauthorized access and affected a significant number of users by using social engineering techniques. These kinds of incidents emphasize how important it is to have a zero-trust policy, which may effectively stop escalations and restrict lateral movement within networks.


Recent Developments of Zero Trust Security Market industry

  • In May 2024, Palo Alto Networks launched Prisma 3.0. Prisma SASE 3.0 extends Zero Trust to unmanaged devices, secures data with AI, and boosts application performance for partners and customers. Prisma SASE continues to deliver industry-leading SLAs for security processing and app performance. Prisma SASE 3.0 and its updated capabilities will be generally available in the coming months. In May 2024, Palo Alto Networks launched a host of new security solutions to help enterprises thwart AI-generated attacks and effectively secure AI-by-design. Leveraging Precision AI, the new proprietary innovation that combines the best of machine learning (ML) and deep learning (DL) with the accessibility of Generative AI (GenAI) for real-time.
  • In October 2021, VMware announced a range of security innovations, including zero trust architecture, ransomware protection, API security, and distributed workforce solutions, providing comprehensive and effective security for modern enterprises. In January 2024, Zscaler Zero Trust SASE, is a single-vendor SASE solution. The new platform is expected to use Zscaler Zero Trust AI to help organisations reduce cost and complexity while implementing Zero Trust security across users, devices, and workloads.

Key Market Players

KEY PLAYERS IN THE Zero Trust Security Market INCLUDE

Want to explore hidden markets that can drive new revenue in Zero Trust Security Market?

Scope of the Report

Report Attribute Details
Market size available for years 2018–2029
Base year considered 2023
Forecast period 2024–2029
Forecast units Value (USD Million/USD Billion)
Segments Covered By Offering, Application, Security Type, Authentication Type, and Vertical.
Geographies covered North America, Europe, Asia Pacific, Middle East Africa, and Latin America.
Major Companies covered Major vendors in the global Zero Trust Security market include Palo Alto Networks (US), VMware (US), Zscaler (US), Akamai (US), Microsoft (US), Cisco (US), IBM (US), Qnext (US), Citrix (US), Check Point (Isreal), Trellix (US), Forcepoint (US), CrowdStrike (US), Cloudflare (US), Fortinet (US), and Google (US).


Personalize This Research

  • Triangulate with your Own Data
  • Get Data as per your Format and Definition
  • Gain a Deeper Dive on a Specific Application, Geography, Customer or Competitor
  • Any level of Personalization
Request A Free Customisation

Let Us Help You

  • What are the Known and Unknown Adjacencies Impacting the Zero Trust Security Market
  • What will your New Revenue Sources be?
  • Who will be your Top Customer; what will make them switch?
  • Defend your Market Share or Win Competitors
  • Get a Scorecard for Target Partners
Customized Workshop Request

Table of Contents

Exclusive indicates content/data unique to MarketsandMarkets and not available with any competitors.

TITLE
PAGE NO
INTRODUCTION
35
RESEARCH METHODOLOGY
41
EXECUTIVE SUMMARY
51
PREMIUM INSIGHTS
55
MARKET OVERVIEW AND INDUSTRY TRENDS
59
  • 5.1 INTRODUCTION
  • 5.2 EVOLUTION OF ZERO TRUST SECURITY MARKET: COMPREHENSIVE HISTORY AND OUTLOOK
  • 5.3 MARKET DYNAMICS
    DRIVERS
    - Rapid adoption of cloud and surge in digital transformation
    - Rising regulatory compliance demands
    - Diminishing popularity of perimeter-based security
    - Rising threat of sophisticated cyberattacks
    RESTRAINTS
    - Complexity and costly implementation
    - Presence of legacy systems and compatibility issues
    - Organizational resistance to change
    OPPORTUNITIES
    - Improved visibility into networks and robust security
    - Development of new zero trust security products and services
    - Surge in awareness about zero trust security
    CHALLENGES
    - Weakening of established security perimeters
    - Growth of shadow SaaS applications
    - Digital supply chain vulnerability
    - Fragmented security operations and siloed teams
  • 5.4 IMPACT OF GENERATIVE AI ON ZERO TRUST SECURITY MARKET
    TOP USE CASES AND MARKET POTENTIAL
    - Key use cases
    IMPACT OF GENERATIVE AI ON INTERCONNECTED AND ADJACENT ECOSYSTEMS
    - Identity and access management (IAM)
    - Blockchain
    - Internet of Things (IoT)
    - Security information and event management (SIEM)
    - Behavioral analytics
  • 5.5 CASE STUDY ANALYSIS
    CASE STUDY 1: MICRON TECHNOLOGY ENHANCES SECURITY AND OPERATIONAL EFFICIENCY THROUGH ZSCALER'S ZERO TRUST SOLUTIONS
    CASE STUDY 2: DZ BANK ENHANCES ZERO TRUST SECURITY AND COMPLIANCE WITH CYBERARK INTEGRATION
    CASE STUDY 3: WEALDEN DISTRICT COUNCIL ENHANCES CONNECTIVITY AND SECURITY WITH PALO ALTO NETWORKS SASE SOLUTION
    CASE STUDY 4: DELOITTE’S CUSTOMIZED SOLUTION HELPED MAJOR CHEMICAL INDUSTRIAL ORGANIZATION ACHIEVE ZERO TRUST ARCHITECTURE
    CASE STUDY 5: ARRIVAL ENHANCED ITS INTERNAL INFRASTRUCTURE SECURITY WITH CLOUDFLARE’S ZERO TRUST NETWORK ACCESS
    CASE STUDY 6: CISCO HELPED VICTORIA UNIVERSITY ENHANCE CAMPUS SECURITY WITH ZERO TRUST SECURITY SOLUTIONS
  • 5.6 VALUE CHAIN ANALYSIS
    RESEARCH AND DEVELOPMENT
    SOLUTION PROVIDERS
    INTEGRATION AND DEPLOYMENT
    - Managed security service providers
    - Training and education providers
    COMPLIANCE AND AUDITING
    END USERS
  • 5.7 ECOSYSTEM ANALYSIS
  • 5.8 PORTER’S FIVE FORCES ANALYSIS
    THREAT OF NEW ENTRANTS
    BARGAINING POWER OF SUPPLIERS
    BARGAINING POWER OF BUYERS
    THREAT OF SUBSTITUTES
    INTENSITY OF COMPETITIVE RIVALRY
  • 5.9 PRICING ANALYSIS
    AVERAGE SELLING PRICE TREND OF KEY PLAYERS, BY AUTHENTICATION TYPE
    INDICATIVE PRICING ANALYSIS, BY OFFERING
  • 5.10 TECHNOLOGY ANALYSIS
    KEY TECHNOLOGIES
    - Identity and access management (IAM)
    - Cloud access security brokers (CASBs)
    COMPLEMENTARY TECHNOLOGIES
    - Multi-factor authentication (MFA)
    - Endpoint detection and response (EDR)
    ADJACENT TECHNOLOGIES
    - Internet of Things (IoT)
    - Blockchain
    - Artificial intelligence
  • 5.11 PATENT ANALYSIS
  • 5.12 TRENDS AND DISRUPTIONS IMPACTING CUSTOMER BUSINESS
  • 5.13 TECHNOLOGY ROADMAP
  • 5.14 KEY STAKEHOLDERS AND BUYING CRITERIA
    KEY STAKEHOLDERS IN BUYING PROCESS
    BUYING CRITERIA
  • 5.15 REGULATORY LANDSCAPE
    PAYMENT CARD INDUSTRY DATA SECURITY STANDARD (PCI–DSS)
    GENERAL DATA PROTECTION REGULATION (GDPR)
    CALIFORNIA CONSUMER PRIVACY ACT (CCPA)
    GRAMM—LEACH—BLILEY ACT OF 1999 (GLBA)
    PERSONAL INFORMATION PROTECTION AND ELECTRONIC DOCUMENTS ACT (PIPEDA)
    HEALTH INSURANCE PORTABILITY AND ACCOUNTABILITY ACT (HIPAA)
    INTERNATIONAL ORGANIZATION FOR STANDARDIZATION (ISO) STANDARD 27001
    REGULATORY BODIES, GOVERNMENT AGENCIES, AND OTHER ORGANIZATIONS
  • 5.16 KEY CONFERENCES AND EVENTS, 2024–2025
  • 5.17 BUSINESS MODEL
  • 5.18 INVESTMENT AND FUNDING SCENARIO
ZERO TRUST SECURITY MARKET, BY OFFERING
110
  • 6.1 INTRODUCTION
    OFFERINGS: ZERO TRUST SECURITY MARKET DRIVERS
  • 6.2 SOLUTIONS
    FOCUS ON OPTIMIZING OPERATIONAL EFFICIENCY WITH ZERO TRUST SECURITY SOLUTIONS TO DRIVE MARKET
    IDENTITY AND ACCESS MANAGEMENT (IAM)
    MICRO-SEGMENTATION
    ZERO TRUST NETWORK ACCESS (ZTNA)
    ZERO TRUST DATA ACCESS (ZTDA)
    SECURITY INFORMATION AND EVENT MANAGEMENT (SIEM)
    USER AND ENTITY BEHAVIOR ANALYTICS (UEBA)
    POLICY MANAGEMENT
    OTHER SOLUTION TYPES
  • 6.3 SERVICES
    NEED FOR PROACTIVE EXPERTISE AND CONTINUOUS PROTECTION SERVICES TO DRIVE MARKET
    PROFESSIONAL SERVICES
    - Design, deployment, integration, and consulting
    - Training and education
    - Support and maintenance
    MANAGED SERVICES
ZERO TRUST SECURITY MARKET, BY APPLICATION
121
  • 7.1 INTRODUCTION
    APPLICATION: ZERO TRUST SECURITY MARKET DRIVERS
  • 7.2 ACCESS CONTROL
    NEED FOR RIGOROUS IDENTITY VERIFICATION AND GRANULAR ACCESS MANAGEMENT TO DRIVE MARKET
  • 7.3 API SECURITY
    NEED TO ENSURE SECURE COMMUNICATION AND DATA SHARING BETWEEN SOFTWARE APPLICATIONS TO DRIVE MARKET
  • 7.4 USER BEHAVIOR ANALYTICS (UBA)
    NEED FOR REAL-TIME DETECTION AND RESPONSE TO ANOMALOUS ACTIVITIES IN ZERO TRUST ENVIRONMENTS TO DRIVE MARKET
  • 7.5 SECURITY ANALYTICS
    DEMAND FOR COMPREHENSIVE THREAT DETECTION AND ENHANCED INCIDENT RESPONSE IN ZERO TRUST ENVIRONMENTS TO DRIVE MARKET
ZERO TRUST SECURITY MARKET, BY SECURITY TYPE
130
  • 8.1 INTRODUCTION
    SECURITY TYPE: ZERO TRUST SECURITY MARKET DRIVERS
  • 8.2 NETWORK SECURITY
    NEED TO BOLSTER NETWORK SECURITY AGAINST EVOLVING THREATS TO DRIVE MARKET
  • 8.3 APPLICATION SECURITY
    NEED TO PROVIDE FULL CONTROL OVER PLATFORMS, SYSTEMS, AND DATA TO ORGANIZATIONS TO PROPEL MARKET
  • 8.4 CLOUD SECURITY
    EMPHASIS ON STRENGTHENING CLOUD SECURITY WITH CASBS, CSPM, AND CWPPS IN ZERO TRUST SECURITY ENVIRONMENTS TO DRIVE MARKET
  • 8.5 DATA SECURITY
    FOCUS ON GRANULAR ACCESS CONTROLS, CONTINUOUS VERIFICATION, AND ENCRYPTION TO ENHANCE DATA SECURITY TO DRIVE MARKET
  • 8.6 ENDPOINT SECURITY & IOT SECURITY
    RISING COMPLEXITIES IN ENDPOINT AND IOT SECURITY TO ENCOURAGE ADOPTION OF ZERO TRUST SECURITY SOLUTIONS
ZERO TRUST SECURITY MARKET, BY AUTHENTICATION TYPE
139
  • 9.1 INTRODUCTION
    AUTHENTICATION TYPE: ZERO TRUST SECURITY MARKET DRIVERS
  • 9.2 SINGLE-FACTOR AUTHENTICATION
    NEED TO BOLSTER NETWORK SECURITY AGAINST EVOLVING THREATS TO DRIVE MARKET
  • 9.3 MULTI-FACTOR AUTHENTICATION
    DEMAND FOR ENHANCED AUTHENTICATION AND IDENTIFICATION ACROSS INDUSTRIES TO DRIVE MARKET
ZERO TRUST SECURITY MARKET, BY VERTICAL
144
  • 10.1 INTRODUCTION
    VERTICAL: ZERO TRUST SECURITY MARKET DRIVERS
  • 10.2 BANKING, FINANCIAL SERVICES, AND INSURANCE (BFSI)
    NEED FOR ADVANCED SECURITY SOLUTIONS IN BFSI SECTOR AMID RISING CYBER THREATS TO DRIVE MARKET
  • 10.3 GOVERNMENT & DEFENSE
    NEED TO STRENGTHEN CYBERSECURITY RESILIENCE IN GOVERNMENT & DEFENSE SECTORS TO DRIVE MARKET
  • 10.4 IT & ITES
    GROWING COMPLEXITIES IN CYBERSECURITY AND STRINGENT REGULATORY REQUIREMENTS TO PROPEL MARKET
  • 10.5 HEALTHCARE
    ESCALATING CYBER THREATS TO BOOST POPULARITY OF ZERO TRUST SECURITY SOLUTIONS
  • 10.6 RETAIL & E-COMMERCE
    RISING DIGITAL TRANSFORMATION TRENDS TO DRIVE DEMAND FOR ZERO TRUST SECURITY SOLUTIONS
  • 10.7 ENERGY & UTILITIES
    NEED FOR ENHANCED CRITICAL INFRASTRUCTURE SECURITY TO DRIVE ADOPTION OF ZERO TRUST SECURITY SOLUTIONS
  • 10.8 OTHER VERTICALS
ZERO TRUST SECURITY MARKET, BY REGION
157
  • 11.1 INTRODUCTION
  • 11.2 NORTH AMERICA
    NORTH AMERICA: ZERO TRUST SECURITY MARKET DRIVERS
    NORTH AMERICA: MACROECONOMIC OUTLOOK
    US
    - Weak password hygiene and increased concerns regarding cybersecurity to fuel demand
    CANADA
    - Rising bot attacks and ransomware and increasing government initiatives to drive market
  • 11.3 EUROPE
    EUROPE: ZERO TRUST SECURITY MARKET DRIVERS
    EUROPE: MACROECONOMIC OUTLOOK
    UK
    - Increased collaboration with forces to develop robust security solutions to drive market
    GERMANY
    - Rising cyberattacks on critical government websites and early adoption of cutting-edge technologies to drive market
    FRANCE
    - Increased internet use and need to safeguard sensitive data to boost demand
    ITALY
    - Increasing digital transformation and growing adoption of cloud services to drive demand
    REST OF EUROPE
  • 11.4 ASIA PACIFIC
    ASIA PACIFIC: ZERO TRUST SECURITY MARKET DRIVERS
    ASIA PACIFIC: MACROECONOMIC OUTLOOK
    CHINA
    - Booming mobile internet services and increasing importance of online payment security to drive market
    JAPAN
    - Rising instances of cyberattacks to fuel demand
    INDIA
    - Cultural shifts, budget constraints, and escalating threat of cyberattacks to drive market
    SINGAPORE
    - Increasing government initiatives to combat cyber threats to drive demand
    AUSTRALIA
    - Focus of government on adopting robust cybersecurity strategies to drive market
    REST OF ASIA PACIFIC
  • 11.5 MIDDLE EAST & AFRICA
    MIDDLE EAST & AFRICA: ZERO TRUST SECURITY MARKET DRIVERS
    MIDDLE EAST & AFRICA: MACROECONOMIC OUTLOOK
    GCC COUNTRIES
    - KSA
    - UAE
    - Rest of GCC Countries
    SOUTH AFRICA
    - Increasing awareness of people regarding zero trust security campaigns to drive market
    REST OF MIDDLE EAST & AFRICA
  • 11.6 LATIN AMERICA
    LATIN AMERICA: ZERO TRUST SECURITY MARKET DRIVERS
    LATIN AMERICA: MACROECONOMIC OUTLOOK
    BRAZIL
    - Evolving cybersecurity challenges due to rapid shift to remote work during pandemic to drive market
    MEXICO
    - Proliferation of connected devices and integration of XDR capabilities with zero trust principles to drive market
    REST OF LATIN AMERICA
COMPETITIVE LANDSCAPE
251
  • 12.1 KEY PLAYER STRATEGIES/RIGHT TO WIN
  • 12.2 REVENUE ANALYSIS
  • 12.3 MARKET SHARE ANALYSIS
  • 12.4 BRAND COMPARISON
  • 12.5 COMPANY VALUATION AND FINANCIAL METRICS
    COMPANY VALUATION
    FINANCIAL METRICS USING EV/EBITDA
  • 12.6 COMPANY EVALUATION MATRIX: KEY PLAYERS, 2023
    STARS
    EMERGING LEADERS
    PERVASIVE PLAYERS
    PARTICIPANTS
    COMPANY FOOTPRINT: KEY PLAYERS, 2023
    - Company footprint
    - Offering footprint
    - Vertical footprint
    - Regional footprint
  • 12.7 COMPANY EVALUATION MATRIX: STARTUPS/SMES, 2023
    PROGRESSIVE COMPANIES
    RESPONSIVE COMPANIES
    DYNAMIC COMPANIES
    STARTING BLOCKS
    COMPETITIVE BENCHMARKING: STARTUPS/SMES, 2023
    - Detailed list of key startups/SMEs
    - Competitive benchmarking of key startups/SMEs
  • 12.8 COMPETITIVE SCENARIO
    PRODUCT LAUNCHES
    DEALS
COMPANY PROFILES
281
  • 13.1 KEY PLAYERS
    PALO ALTO NETWORKS
    - Business overview
    - Products/Solutions/Services offered
    - Recent developments
    - MnM view
    VMWARE
    - Business overview
    - Products/Solutions/Services offered
    - MnM view
    ZSCALER
    - Business overview
    - Products/Solutions/Services offered
    - Recent developments
    - MnM view
    AKAMAI
    - Business overview
    - Products/Solutions/Services offered
    - Recent developments
    - MnM view
    MICROSOFT
    - Business overview
    - Products/Solutions/Services offered
    - Recent developments
    - MnM view
    CISCO
    - Business overview
    - Products/Solutions/Services offered
    - Recent developments
    IBM
    - Business overview
    - Products/Solutions/Services offered
    - Recent developments
    CITRIX
    - Business overview
    - Products/Solutions/Services offered
    - Recent developments
    CHECK POINT
    - Business overview
    - Products/Solutions/Services offered
    - Recent developments
    TRELLIX
    - Business overview
    - Products/Solutions/Services offered
    - Recent developments
    FORCEPOINT
    - Business overview
    - Products/Solutions/Services offered
    - Recent developments
    CROWDSTRIKE
    - Business overview
    - Products/Solutions/Services offered
    - Recent developments
    CLOUDFLARE
    - Business overview
    - Products/Solutions/Services offered
    - Recent developments
    FORTINET
    - Business overview
    - Products/Solutions/Services offered
    GOOGLE
    - Business overview
    - Products/Solutions/Services offered
    - Recent developments
    QNEXT
    - Business overview
    - Products/Solutions/Services offered
    - Recent developments
  • 13.2 OTHER PLAYERS
    ILLUMIO
    ON2IT
    PERIMETER 81
    THREATLOCKER
    TWINGATE
    APPGATE
    ZERO NETWORKS
    ZENTERA
    XAGE
    SKYHIGH SECURITY
ADJACENT MARKETS
348
  • 14.1 INTRODUCTION
  • 14.2 LIMITATIONS
  • 14.3 IDENTITY AND ACCESS MANAGEMENT (IAM) MARKET
  • 14.4 CYBERSECURITY MARKET
APPENDIX
353
  • 15.1 DISCUSSION GUIDE
  • 15.2 KNOWLEDGESTORE: MARKETSANDMARKETS’ SUBSCRIPTION PORTAL
  • 15.3 CUSTOMIZATION OPTIONS
  • 15.4 RELATED REPORTS
  • 15.5 AUTHOR DETAILS
LIST OF TABLES
 
  • TABLE 1 USD EXCHANGE RATES, 2019–2023
  • TABLE 2 FACTOR ANALYSIS
  • TABLE 3 ZERO TRUST SECURITY MARKET AND GROWTH RATE, 2018–2023 (USD MILLION)
  • TABLE 4 ZERO TRUST SECURITY MARKET AND GROWTH RATE, 2024–2029 (USD MILLION)
  • TABLE 5 ZERO TRUST SECURITY MARKET: ECOSYSTEM
  • TABLE 6 PORTER’S FIVE FORCES IMPACT ON ZERO TRUST SECURITY MARKET
  • TABLE 7 AVERAGE SELLING PRICE TREND OF KEY PLAYERS, BY AUTHENTICATION TYPE
  • TABLE 8 CLOUDFLARE: INDICATIVE PRICING ANALYSIS
  • TABLE 9 PERIMETER 81: INDICATIVE PRICING ANALYSIS
  • TABLE 10 OKTA: INDICATIVE PRICING ANALYSIS
  • TABLE 11 ILLUMIO: INDICATIVE PRICING ANALYSIS
  • TABLE 12 LIST OF PATENTS IN ZERO TRUST SECURITY MARKET, 2022–2024
  • TABLE 13 TECHNOLOGY ROADMAP
  • TABLE 14 INFLUENCE OF STAKEHOLDERS ON BUYING PROCESS OF TOP THREE VERTICALS
  • TABLE 15 KEY BUYING CRITERIA FOR TOP THREE VERTICALS
  • TABLE 16 NORTH AMERICA: LIST OF REGULATORY BODIES, GOVERNMENT AGENCIES, AND OTHER ORGANIZATIONS
  • TABLE 17 EUROPE: LIST OF REGULATORY BODIES, GOVERNMENT AGENCIES, AND OTHER ORGANIZATIONS
  • TABLE 18 ASIA PACIFIC: LIST OF REGULATORY BODIES, GOVERNMENT AGENCIES, AND OTHER ORGANIZATIONS
  • TABLE 19 ZERO TRUST SECURITY MARKET: KEY CONFERENCES AND EVENTS, 2024–2025
  • TABLE 20 ZERO TRUST SECURITY MARKET: BUSINESS MODEL
  • TABLE 21 ZERO TRUST SECURITY MARKET, BY OFFERING, 2018–2023 (USD MILLION)
  • TABLE 22 ZERO TRUST SECURITY MARKET, BY OFFERING, 2024–2029 (USD MILLION)
  • TABLE 23 SOLUTIONS: ZERO TRUST SECURITY MARKET, BY REGION, 2018–2023 (USD MILLION)
  • TABLE 24 SOLUTIONS: ZERO TRUST SECURITY MARKET, BY REGION, 2024–2029 (USD MILLION)
  • TABLE 25 SERVICES: ZERO TRUST SECURITY MARKET, BY REGION, 2018–2023 (USD MILLION)
  • TABLE 26 SERVICES: ZERO TRUST SECURITY MARKET, BY REGION, 2024–2029 (USD MILLION)
  • TABLE 27 ZERO TRUST SECURITY MARKET, BY APPLICATION, 2018–2023 (USD MILLION)
  • TABLE 28 ZERO TRUST SECURITY MARKET, BY APPLICATION, 2024–2029 (USD MILLION)
  • TABLE 29 ACCESS CONTROL: ZERO TRUST SECURITY MARKET, BY REGION, 2018–2023 (USD MILLION)
  • TABLE 30 ACCESS CONTROL: ZERO TRUST SECURITY MARKET, BY REGION, 2024–2029 (USD MILLION)
  • TABLE 31 API SECURITY: ZERO TRUST SECURITY MARKET, BY REGION, 2018–2023 (USD MILLION)
  • TABLE 32 API SECURITY: ZERO TRUST SECURITY MARKET, BY REGION, 2024–2029 (USD MILLION)
  • TABLE 33 USER BEHAVIOR ANALYTICS (UBA): ZERO TRUST SECURITY MARKET, BY REGION, 2018–2023 (USD MILLION)
  • TABLE 34 USER BEHAVIOR ANALYTICS (UBA): ZERO TRUST SECURITY MARKET, BY REGION, 2024–2029 (USD MILLION)
  • TABLE 35 SECURITY ANALYTICS: ZERO TRUST SECURITY MARKET, BY REGION, 2018–2023 (USD MILLION)
  • TABLE 36 SECURITY ANALYTICS: ZERO TRUST SECURITY MARKET, BY REGION, 2024–2029 (USD MILLION)
  • TABLE 37 ZERO TRUST SECURITY MARKET, BY SECURITY TYPE, 2018–2023 (USD MILLION)
  • TABLE 38 ZERO TRUST SECURITY MARKET, BY SECURITY TYPE, 2024–2029 (USD MILLION)
  • TABLE 39 NETWORK SECURITY: ZERO TRUST SECURITY MARKET, BY REGION, 2018–2023 (USD MILLION)
  • TABLE 40 NETWORK SECURITY: ZERO TRUST SECURITY MARKET, BY REGION, 2024–2029 (USD MILLION)
  • TABLE 41 APPLICATION SECURITY: ZERO TRUST SECURITY MARKET, BY REGION, 2018–2023 (USD MILLION)
  • TABLE 42 APPLICATION SECURITY: ZERO TRUST SECURITY MARKET, BY REGION, 2024–2029 (USD MILLION)
  • TABLE 43 CLOUD SECURITY: ZERO TRUST SECURITY MARKET, BY REGION, 2018–2023 (USD MILLION)
  • TABLE 44 CLOUD SECURITY: ZERO TRUST SECURITY MARKET, BY REGION, 2024–2029 (USD MILLION)
  • TABLE 45 DATA SECURITY: ZERO TRUST SECURITY MARKET, BY REGION, 2018–2023 (USD MILLION)
  • TABLE 46 DATA SECURITY: ZERO TRUST SECURITY MARKET, BY REGION, 2024–2029 (USD MILLION)
  • TABLE 47 ENDPOINT SECURITY & IOT SECURITY: ZERO TRUST SECURITY MARKET, BY REGION, 2018–2023 (USD MILLION)
  • TABLE 48 ENDPOINT SECURITY & IOT SECURITY: ZERO TRUST SECURITY MARKET, BY REGION, 2024–2029 (USD MILLION)
  • TABLE 49 ZERO TRUST SECURITY MARKET, BY AUTHENTICATION TYPE, 2018–2023 (USD MILLION)
  • TABLE 50 ZERO TRUST SECURITY MARKET, BY AUTHENTICATION TYPE, 2024–2029 (USD MILLION)
  • TABLE 51 SINGLE-FACTOR AUTHENTICATION: ZERO TRUST SECURITY MARKET, BY REGION, 2018–2023 (USD MILLION)
  • TABLE 52 SINGLE-FACTOR AUTHENTICATION: ZERO TRUST SECURITY MARKET, BY REGION, 2024–2029 (USD MILLION)
  • TABLE 53 MULTI-FACTOR AUTHENTICATION: ZERO TRUST SECURITY MARKET, BY REGION, 2018–2023 (USD MILLION)
  • TABLE 54 MULTI-FACTOR AUTHENTICATION: ZERO TRUST SECURITY MARKET, BY REGION, 2024–2029 (USD MILLION)
  • TABLE 55 ZERO TRUST SECURITY MARKET, BY VERTICAL, 2018–2023 (USD MILLION)
  • TABLE 56 ZERO TRUST SECURITY MARKET, BY VERTICAL, 2024–2029 (USD MILLION)
  • TABLE 57 BANKING, FINANCIAL SERVICES, AND INSURANCE: ZERO TRUST SECURITY MARKET, BY REGION, 2018–2023 (USD MILLION)
  • TABLE 58 BANKING, FINANCIAL SERVICES, AND INSURANCE: ZERO TRUST SECURITY MARKET, BY REGION, 2024–2029 (USD MILLION)
  • TABLE 59 GOVERNMENT & DEFENSE: ZERO TRUST SECURITY MARKET, BY REGION, 2018–2023 (USD MILLION)
  • TABLE 60 GOVERNMENT & DEFENSE: ZERO TRUST SECURITY MARKET, BY REGION, 2024–2029 (USD MILLION)
  • TABLE 61 IT & ITES: ZERO TRUST SECURITY MARKET, BY REGION, 2018–2023 (USD MILLION)
  • TABLE 62 IT & ITES: ZERO TRUST SECURITY MARKET, BY REGION, 2024–2029 (USD MILLION)
  • TABLE 63 HEALTHCARE: ZERO TRUST SECURITY MARKET, BY REGION, 2018–2023 (USD MILLION)
  • TABLE 64 HEALTHCARE: ZERO TRUST SECURITY MARKET, BY REGION, 2024–2029 (USD MILLION)
  • TABLE 65 RETAIL & E-COMMERCE: ZERO TRUST SECURITY MARKET, BY REGION, 2018–2023 (USD MILLION)
  • TABLE 66 RETAIL & E-COMMERCE: ZERO TRUST SECURITY MARKET, BY REGION, 2024–2029 (USD MILLION)
  • TABLE 67 ENERGY & UTILITIES: ZERO TRUST SECURITY MARKET, BY REGION, 2018–2023 (USD MILLION)
  • TABLE 68 ENERGY & UTILITIES: ZERO TRUST SECURITY MARKET, BY REGION, 2024–2029 (USD MILLION)
  • TABLE 69 OTHER VERTICALS: ZERO TRUST SECURITY MARKET, BY REGION, 2018–2023 (USD MILLION)
  • TABLE 70 OTHER VERTICALS: ZERO TRUST SECURITY MARKET, BY REGION, 2024–2029 (USD MILLION)
  • TABLE 71 ZERO TRUST SECURITY MARKET, BY REGION, 2018–2023 (USD MILLION)
  • TABLE 72 ZERO TRUST SECURITY MARKET, BY REGION, 2024–2029 (USD MILLION)
  • TABLE 73 NORTH AMERICA: ZERO TRUST SECURITY MARKET, BY OFFERING, 2018–2023 (USD MILLION)
  • TABLE 74 NORTH AMERICA: ZERO TRUST SECURITY MARKET, BY OFFERING, 2024–2029 (USD MILLION)
  • TABLE 75 NORTH AMERICA: ZERO TRUST SECURITY MARKET, BY SECURITY TYPE, 2018–2023 (USD MILLION)
  • TABLE 76 NORTH AMERICA: ZERO TRUST SECURITY MARKET, BY SECURITY TYPE, 2024–2029 (USD MILLION)
  • TABLE 77 NORTH AMERICA: ZERO TRUST SECURITY MARKET, BY AUTHENTICATION TYPE, 2018–2023 (USD MILLION)
  • TABLE 78 NORTH AMERICA: ZERO TRUST SECURITY MARKET, BY AUTHENTICATION TYPE, 2024–2029 (USD MILLION)
  • TABLE 79 NORTH AMERICA: ZERO TRUST SECURITY MARKET, BY VERTICAL, 2018–2023 (USD MILLION)
  • TABLE 80 NORTH AMERICA: ZERO TRUST SECURITY MARKET, BY VERTICAL, 2024–2029 (USD MILLION)
  • TABLE 81 NORTH AMERICA: ZERO TRUST SECURITY MARKET, BY APPLICATION, 2018–2023 (USD MILLION)
  • TABLE 82 NORTH AMERICA: ZERO TRUST SECURITY MARKET, BY APPLICATION, 2024–2029 (USD MILLION)
  • TABLE 83 NORTH AMERICA: ZERO TRUST SECURITY MARKET, BY COUNTRY, 2018–2023 (USD MILLION)
  • TABLE 84 NORTH AMERICA: ZERO TRUST SECURITY MARKET, BY COUNTRY, 2024–2029 (USD MILLION)
  • TABLE 85 US: ZERO TRUST SECURITY MARKET, BY OFFERING, 2018–2023 (USD MILLION)
  • TABLE 86 US: ZERO TRUST SECURITY MARKET, BY OFFERING, 2024–2029 (USD MILLION)
  • TABLE 87 US: ZERO TRUST SECURITY MARKET, BY SECURITY TYPE, 2018–2023 (USD MILLION)
  • TABLE 88 US: ZERO TRUST SECURITY MARKET, BY SECURITY TYPE, 2024–2029 (USD MILLION)
  • TABLE 89 US: ZERO TRUST SECURITY MARKET, BY AUTHENTICATION TYPE, 2018–2023 (USD MILLION)
  • TABLE 90 US: ZERO TRUST SECURITY MARKET, BY AUTHENTICATION TYPE, 2024–2029 (USD MILLION)
  • TABLE 91 US: ZERO TRUST SECURITY MARKET, BY VERTICAL, 2018–2023 (USD MILLION)
  • TABLE 92 US: ZERO TRUST SECURITY MARKET, BY VERTICAL, 2024–2029 (USD MILLION)
  • TABLE 93 CANADA: ZERO TRUST SECURITY MARKET, BY OFFERING, 2018–2023 (USD MILLION)
  • TABLE 94 CANADA: ZERO TRUST SECURITY MARKET, BY OFFERING, 2024–2029 (USD MILLION)
  • TABLE 95 CANADA: ZERO TRUST SECURITY MARKET, BY SECURITY TYPE, 2018–2023 (USD MILLION)
  • TABLE 96 CANADA: ZERO TRUST SECURITY MARKET, BY SECURITY TYPE, 2024–2029 (USD MILLION)
  • TABLE 97 CANADA: ZERO TRUST SECURITY MARKET, BY AUTHENTICATION TYPE, 2018–2023 (USD MILLION)
  • TABLE 98 CANADA: ZERO TRUST SECURITY MARKET, BY AUTHENTICATION TYPE, 2024–2029 (USD MILLION)
  • TABLE 99 CANADA: ZERO TRUST SECURITY MARKET, BY VERTICAL, 2018–2023 (USD MILLION)
  • TABLE 100 CANADA: ZERO TRUST SECURITY MARKET, BY VERTICAL, 2024–2029 (USD MILLION)
  • TABLE 101 EUROPE: ZERO TRUST SECURITY MARKET, BY OFFERING, 2018–2023 (USD MILLION)
  • TABLE 102 EUROPE: ZERO TRUST SECURITY MARKET, BY OFFERING, 2024–2029 (USD MILLION)
  • TABLE 103 EUROPE: ZERO TRUST SECURITY MARKET, BY SECURITY TYPE, 2018–2023 (USD MILLION)
  • TABLE 104 EUROPE: ZERO TRUST SECURITY MARKET, BY SECURITY TYPE, 2024–2029 (USD MILLION)
  • TABLE 105 EUROPE: ZERO TRUST SECURITY MARKET, BY AUTHENTICATION TYPE, 2018–2023 (USD MILLION)
  • TABLE 106 EUROPE: ZERO TRUST SECURITY MARKET, BY AUTHENTICATION TYPE, 2024–2029 (USD MILLION)
  • TABLE 107 EUROPE: ZERO TRUST SECURITY MARKET, BY VERTICAL, 2018–2023 (USD MILLION)
  • TABLE 108 EUROPE: ZERO TRUST SECURITY MARKET, BY VERTICAL, 2024–2029 (USD MILLION)
  • TABLE 109 EUROPE: ZERO TRUST SECURITY MARKET, BY APPLICATION, 2018–2023 (USD MILLION)
  • TABLE 110 EUROPE: ZERO TRUST SECURITY MARKET, BY APPLICATION, 2024–2029 (USD MILLION)
  • TABLE 111 EUROPE: ZERO TRUST SECURITY MARKET, BY COUNTRY, 2018–2023 (USD MILLION)
  • TABLE 112 EUROPE: ZERO TRUST SECURITY MARKET, BY COUNTRY, 2024–2029 (USD MILLION)
  • TABLE 113 UK: ZERO TRUST SECURITY MARKET, BY OFFERING, 2018–2023 (USD MILLION)
  • TABLE 114 UK: ZERO TRUST SECURITY MARKET, BY OFFERING, 2024–2029 (USD MILLION)
  • TABLE 115 UK: ZERO TRUST SECURITY MARKET, BY SECURITY TYPE, 2018–2023 (USD MILLION)
  • TABLE 116 UK: ZERO TRUST SECURITY MARKET, BY SECURITY TYPE, 2024–2029 (USD MILLION)
  • TABLE 117 UK: ZERO TRUST SECURITY MARKET, BY AUTHENTICATION TYPE, 2018–2023 (USD MILLION)
  • TABLE 118 UK: ZERO TRUST SECURITY MARKET, BY AUTHENTICATION TYPE, 2024–2029 (USD MILLION)
  • TABLE 119 UK: ZERO TRUST SECURITY MARKET, BY VERTICAL, 2018–2023 (USD MILLION)
  • TABLE 120 UK: ZERO TRUST SECURITY MARKET, BY VERTICAL, 2024–2029 (USD MILLION)
  • TABLE 121 GERMANY: ZERO TRUST SECURITY MARKET, BY OFFERING, 2018–2023 (USD MILLION)
  • TABLE 122 GERMANY: ZERO TRUST SECURITY MARKET, BY OFFERING, 2024–2029 (USD MILLION)
  • TABLE 123 GERMANY: ZERO TRUST SECURITY MARKET, BY SECURITY TYPE, 2018–2023 (USD MILLION)
  • TABLE 124 GERMANY: ZERO TRUST SECURITY MARKET, BY SECURITY TYPE, 2024–2029 (USD MILLION)
  • TABLE 125 GERMANY: ZERO TRUST SECURITY MARKET, BY AUTHENTICATION TYPE, 2018–2023 (USD MILLION)
  • TABLE 126 GERMANY: ZERO TRUST SECURITY MARKET, BY AUTHENTICATION TYPE, 2024–2029 (USD MILLION)
  • TABLE 127 GERMANY: ZERO TRUST SECURITY MARKET, BY VERTICAL, 2018–2023 (USD MILLION)
  • TABLE 128 GERMANY: ZERO TRUST SECURITY MARKET, BY VERTICAL, 2024–2029 (USD MILLION)
  • TABLE 129 FRANCE: ZERO TRUST SECURITY MARKET, BY OFFERING, 2018–2023 (USD MILLION)
  • TABLE 130 FRANCE: ZERO TRUST SECURITY MARKET, BY OFFERING, 2024–2029 (USD MILLION)
  • TABLE 131 FRANCE: ZERO TRUST SECURITY MARKET, BY SECURITY TYPE, 2018–2023 (USD MILLION)
  • TABLE 132 FRANCE: ZERO TRUST SECURITY MARKET, BY SECURITY TYPE, 2024–2029 (USD MILLION)
  • TABLE 133 FRANCE: ZERO TRUST SECURITY MARKET, BY AUTHENTICATION TYPE, 2018–2023 (USD MILLION)
  • TABLE 134 FRANCE: ZERO TRUST SECURITY MARKET, BY AUTHENTICATION TYPE, 2024–2029 (USD MILLION)
  • TABLE 135 FRANCE: ZERO TRUST SECURITY MARKET, BY VERTICAL, 2018–2023 (USD MILLION)
  • TABLE 136 FRANCE: ZERO TRUST SECURITY MARKET, BY VERTICAL, 2024–2029 (USD MILLION)
  • TABLE 137 ITALY: ZERO TRUST SECURITY MARKET, BY OFFERING, 2018–2023 (USD MILLION)
  • TABLE 138 ITALY: ZERO TRUST SECURITY MARKET, BY OFFERING, 2024–2029 (USD MILLION)
  • TABLE 139 ITALY: ZERO TRUST SECURITY MARKET, BY SECURITY TYPE, 2018–2023 (USD MILLION)
  • TABLE 140 ITALY: ZERO TRUST SECURITY MARKET, BY SECURITY TYPE, 2024–2029 (USD MILLION)
  • TABLE 141 ITALY: ZERO TRUST SECURITY MARKET, BY AUTHENTICATION TYPE, 2018–2023 (USD MILLION)
  • TABLE 142 ITALY: ZERO TRUST SECURITY MARKET, BY AUTHENTICATION TYPE, 2024–2029 (USD MILLION)
  • TABLE 143 ITALY: ZERO TRUST SECURITY MARKET, BY VERTICAL, 2018–2023 (USD MILLION)
  • TABLE 144 ITALY: ZERO TRUST SECURITY MARKET, BY VERTICAL, 2024–2029 (USD MILLION)
  • TABLE 145 REST OF EUROPE: ZERO TRUST SECURITY MARKET, BY OFFERING, 2018–2023 (USD MILLION)
  • TABLE 146 REST OF EUROPE: ZERO TRUST SECURITY MARKET, BY OFFERING, 2024–2029 (USD MILLION)
  • TABLE 147 REST OF EUROPE: ZERO TRUST SECURITY MARKET, BY SECURITY TYPE, 2018–2023 (USD MILLION)
  • TABLE 148 REST OF EUROPE: ZERO TRUST SECURITY MARKET, BY SECURITY TYPE, 2024–2029 (USD MILLION)
  • TABLE 149 REST OF EUROPE: ZERO TRUST SECURITY MARKET, BY AUTHENTICATION TYPE, 2018–2023 (USD MILLION)
  • TABLE 150 REST OF EUROPE: ZERO TRUST SECURITY MARKET, BY AUTHENTICATION TYPE, 2024–2029 (USD MILLION)
  • TABLE 151 REST OF EUROPE: ZERO TRUST SECURITY MARKET, BY VERTICAL, 2018–2023 (USD MILLION)
  • TABLE 152 REST OF EUROPE: ZERO TRUST SECURITY MARKET, BY VERTICAL, 2024–2029 (USD MILLION)
  • TABLE 153 ASIA PACIFIC: ZERO TRUST SECURITY MARKET, BY OFFERING, 2018–2023 (USD MILLION)
  • TABLE 154 ASIA PACIFIC: ZERO TRUST SECURITY MARKET, BY OFFERING, 2024–2029 (USD MILLION)
  • TABLE 155 ASIA PACIFIC: ZERO TRUST SECURITY MARKET, BY SECURITY TYPE, 2018–2023 (USD MILLION)
  • TABLE 156 ASIA PACIFIC: ZERO TRUST SECURITY MARKET, BY SECURITY TYPE, 2024–2029 (USD MILLION)
  • TABLE 157 ASIA PACIFIC: ZERO TRUST SECURITY MARKET, BY AUTHENTICATION TYPE, 2018–2023 (USD MILLION)
  • TABLE 158 ASIA PACIFIC: ZERO TRUST SECURITY MARKET, BY AUTHENTICATION TYPE, 2024–2029 (USD MILLION)
  • TABLE 159 ASIA PACIFIC: ZERO TRUST SECURITY MARKET, BY VERTICAL, 2018–2023 (USD MILLION)
  • TABLE 160 ASIA PACIFIC: ZERO TRUST SECURITY MARKET, BY VERTICAL, 2024–2029 (USD MILLION)
  • TABLE 161 ASIA PACIFIC: ZERO TRUST SECURITY MARKET, BY APPLICATION, 2018–2023 (USD MILLION)
  • TABLE 162 ASIA PACIFIC: ZERO TRUST SECURITY MARKET, BY APPLICATION, 2024–2029 (USD MILLION)
  • TABLE 163 ASIA PACIFIC: ZERO TRUST SECURITY MARKET, BY COUNTRY, 2018–2023 (USD MILLION)
  • TABLE 164 ASIA PACIFIC: ZERO TRUST SECURITY MARKET, BY COUNTRY, 2024–2029 (USD MILLION)
  • TABLE 165 CHINA: ZERO TRUST SECURITY MARKET, BY OFFERING, 2018–2023 (USD MILLION)
  • TABLE 166 CHINA: ZERO TRUST SECURITY MARKET, BY OFFERING, 2024–2029 (USD MILLION)
  • TABLE 167 CHINA: ZERO TRUST SECURITY MARKET, BY SECURITY TYPE, 2018–2023 (USD MILLION)
  • TABLE 168 CHINA: ZERO TRUST SECURITY MARKET, BY SECURITY TYPE, 2024–2029 (USD MILLION)
  • TABLE 169 CHINA: ZERO TRUST SECURITY MARKET, BY AUTHENTICATION TYPE, 2018–2023 (USD MILLION)
  • TABLE 170 CHINA: ZERO TRUST SECURITY MARKET, BY AUTHENTICATION TYPE, 2024–2029 (USD MILLION)
  • TABLE 171 CHINA: ZERO TRUST SECURITY MARKET, BY VERTICAL, 2018–2023 (USD MILLION)
  • TABLE 172 CHINA: ZERO TRUST SECURITY MARKET, BY VERTICAL, 2024–2029 (USD MILLION)
  • TABLE 173 JAPAN: ZERO TRUST SECURITY MARKET, BY OFFERING, 2018–2023 (USD MILLION)
  • TABLE 174 JAPAN: ZERO TRUST SECURITY MARKET, BY OFFERING, 2024–2029 (USD MILLION)
  • TABLE 175 JAPAN: ZERO TRUST SECURITY MARKET, BY SECURITY TYPE, 2018–2023 (USD MILLION)
  • TABLE 176 JAPAN: ZERO TRUST SECURITY MARKET, BY SECURITY TYPE, 2024–2029 (USD MILLION)
  • TABLE 177 JAPAN: ZERO TRUST SECURITY MARKET, BY AUTHENTICATION TYPE, 2018–2023 (USD MILLION)
  • TABLE 178 JAPAN: ZERO TRUST SECURITY MARKET, BY AUTHENTICATION TYPE, 2024–2029 (USD MILLION)
  • TABLE 179 JAPAN: ZERO TRUST SECURITY MARKET, BY VERTICAL, 2018–2023 (USD MILLION)
  • TABLE 180 JAPAN: ZERO TRUST SECURITY MARKET, BY VERTICAL, 2024–2029 (USD MILLION)
  • TABLE 181 INDIA: ZERO TRUST SECURITY MARKET, BY OFFERING, 2018–2023 (USD MILLION)
  • TABLE 182 INDIA: ZERO TRUST SECURITY MARKET, BY OFFERING, 2024–2029 (USD MILLION)
  • TABLE 183 INDIA: ZERO TRUST SECURITY MARKET, BY SECURITY TYPE, 2018–2023 (USD MILLION)
  • TABLE 184 INDIA: ZERO TRUST SECURITY MARKET, BY SECURITY TYPE, 2024–2029 (USD MILLION)
  • TABLE 185 INDIA: ZERO TRUST SECURITY MARKET, BY AUTHENTICATION TYPE, 2018–2023 (USD MILLION)
  • TABLE 186 INDIA: ZERO TRUST SECURITY MARKET, BY AUTHENTICATION TYPE, 2024–2029 (USD MILLION)
  • TABLE 187 INDIA: ZERO TRUST SECURITY MARKET, BY VERTICAL, 2018–2023 (USD MILLION)
  • TABLE 188 INDIA: ZERO TRUST SECURITY MARKET, BY VERTICAL, 2024–2029 (USD MILLION)
  • TABLE 189 SINGAPORE: ZERO TRUST SECURITY MARKET, BY OFFERING, 2018–2023 (USD MILLION)
  • TABLE 190 SINGAPORE: ZERO TRUST SECURITY MARKET, BY OFFERING, 2024–2029 (USD MILLION)
  • TABLE 191 SINGAPORE: ZERO TRUST SECURITY MARKET, BY SECURITY TYPE, 2018–2023 (USD MILLION)
  • TABLE 192 SINGAPORE: ZERO TRUST SECURITY MARKET, BY SECURITY TYPE, 2024–2029 (USD MILLION)
  • TABLE 193 SINGAPORE: ZERO TRUST SECURITY MARKET, BY AUTHENTICATION TYPE, 2018–2023 (USD MILLION)
  • TABLE 194 SINGAPORE: ZERO TRUST SECURITY MARKET, BY AUTHENTICATION TYPE, 2024–2029 (USD MILLION)
  • TABLE 195 SINGAPORE: ZERO TRUST SECURITY MARKET, BY VERTICAL, 2018–2023 (USD MILLION)
  • TABLE 196 SINGAPORE: ZERO TRUST SECURITY MARKET, BY VERTICAL, 2024–2029 (USD MILLION)
  • TABLE 197 AUSTRALIA: ZERO TRUST SECURITY MARKET, BY OFFERING, 2018–2023 (USD MILLION)
  • TABLE 198 AUSTRALIA: ZERO TRUST SECURITY MARKET, BY OFFERING, 2024–2029 (USD MILLION)
  • TABLE 199 AUSTRALIA: ZERO TRUST SECURITY MARKET, BY SECURITY TYPE, 2018–2023 (USD MILLION)
  • TABLE 200 AUSTRALIA: ZERO TRUST SECURITY MARKET, BY SECURITY TYPE, 2024–2029 (USD MILLION)
  • TABLE 201 AUSTRALIA: ZERO TRUST SECURITY MARKET, BY AUTHENTICATION TYPE, 2018–2023 (USD MILLION)
  • TABLE 202 AUSTRALIA: ZERO TRUST SECURITY MARKET, BY AUTHENTICATION TYPE, 2 024–2029 (USD MILLION)
  • TABLE 203 AUSTRALIA: ZERO TRUST SECURITY MARKET, BY VERTICAL, 2018–2023 (USD MILLION)
  • TABLE 204 AUSTRALIA: ZERO TRUST SECURITY MARKET, BY VERTICAL, 2024–2029 (USD MILLION)
  • TABLE 205 REST OF ASIA PACIFIC: ZERO TRUST SECURITY MARKET, BY OFFERING, 2018–2023 (USD MILLION)
  • TABLE 206 REST OF ASIA PACIFIC: ZERO TRUST SECURITY MARKET, BY OFFERING, 2024–2029 (USD MILLION)
  • TABLE 207 REST OF ASIA PACIFIC: ZERO TRUST SECURITY MARKET, BY SECURITY TYPE, 2018–2023 (USD MILLION)
  • TABLE 208 REST OF ASIA PACIFIC: ZERO TRUST SECURITY MARKET, BY SECURITY TYPE, 2024–2029 (USD MILLION)
  • TABLE 209 REST OF ASIA PACIFIC: ZERO TRUST SECURITY MARKET, BY AUTHENTICATION TYPE, 2018–2023 (USD MILLION)
  • TABLE 210 REST OF ASIA PACIFIC: ZERO TRUST SECURITY MARKET, BY AUTHENTICATION TYPE, 2024–2029 (USD MILLION)
  • TABLE 211 REST OF ASIA PACIFIC: ZERO TRUST SECURITY MARKET, BY VERTICAL, 2018–2023 (USD MILLION)
  • TABLE 212 REST OF ASIA PACIFIC: ZERO TRUST SECURITY MARKET, BY VERTICAL, 2024–2029 (USD MILLION)
  • TABLE 213 MIDDLE EAST & AFRICA: ZERO TRUST SECURITY MARKET, BY OFFERING, 2018–2023 (USD MILLION)
  • TABLE 214 MIDDLE EAST & AFRICA: ZERO TRUST SECURITY MARKET, BY OFFERING, 2024–2029 (USD MILLION)
  • TABLE 215 MIDDLE EAST & AFRICA: ZERO TRUST SECURITY MARKET, BY SECURITY TYPE, 2018–2023 (USD MILLION)
  • TABLE 216 MIDDLE EAST & AFRICA: ZERO TRUST SECURITY MARKET, BY SECURITY TYPE, 2024–2029 (USD MILLION)
  • TABLE 217 MIDDLE EAST & AFRICA: ZERO TRUST SECURITY MARKET, BY AUTHENTICATION TYPE, 2018–2023 (USD MILLION)
  • TABLE 218 MIDDLE EAST & AFRICA: ZERO TRUST SECURITY MARKET, BY AUTHENTICATION TYPE, 2024–2029 (USD MILLION)
  • TABLE 219 MIDDLE EAST & AFRICA: ZERO TRUST SECURITY MARKET, BY VERTICAL, 2018–2023 (USD MILLION)
  • TABLE 220 MIDDLE EAST & AFRICA: ZERO TRUST SECURITY MARKET, BY VERTICAL, 2024–2029 (USD MILLION)
  • TABLE 221 MIDDLE EAST & AFRICA: ZERO TRUST SECURITY MARKET, BY APPLICATION, 2018–2023 (USD MILLION)
  • TABLE 222 MIDDLE EAST & AFRICA: ZERO TRUST SECURITY MARKET, BY APPLICATION, 2024–2029 (USD MILLION)
  • TABLE 223 MIDDLE EAST & AFRICA: ZERO TRUST SECURITY MARKET, BY COUNTRY, 2018–2023 (USD MILLION)
  • TABLE 224 MIDDLE EAST & AFRICA: ZERO TRUST SECURITY MARKET, BY COUNTRY, 2024–2029 (USD MILLION)
  • TABLE 225 GCC: ZERO TRUST SECURITY MARKET, BY OFFERING, 2018–2023 (USD MILLION)
  • TABLE 226 GCC: ZERO TRUST SECURITY MARKET, BY OFFERING, 2024–2029 (USD MILLION)
  • TABLE 227 GCC: ZERO TRUST SECURITY MARKET, BY SECURITY TYPE, 2018–2023 (USD MILLION)
  • TABLE 228 GCC: ZERO TRUST SECURITY MARKET, BY SECURITY TYPE, 2024–2029 (USD MILLION)
  • TABLE 229 GCC: ZERO TRUST SECURITY MARKET, BY AUTHENTICATION TYPE, 2018–2023 (USD MILLION)
  • TABLE 230 GCC: ZERO TRUST SECURITY MARKET, BY AUTHENTICATION TYPE, 2024–2029 (USD MILLION)
  • TABLE 231 GCC: ZERO TRUST SECURITY MARKET, BY VERTICAL, 2018–2023 (USD MILLION)
  • TABLE 232 GCC: ZERO TRUST SECURITY MARKET, BY VERTICAL, 2024–2029 (USD MILLION)
  • TABLE 233 GCC COUNTRIES: ZERO TRUST SECURITY MARKET, BY COUNTRY, 2018–2023 (USD MILLION)
  • TABLE 234 GCC COUNTRIES: ZERO TRUST SECURITY MARKET, BY COUNTRY, 2024–2029 (USD MILLION)
  • TABLE 235 KSA: ZERO TRUST SECURITY MARKET, BY OFFERING, 2018–2023 (USD MILLION)
  • TABLE 236 KSA: ZERO TRUST SECURITY MARKET, BY OFFERING, 2024–2029 (USD MILLION)
  • TABLE 237 KSA: ZERO TRUST SECURITY MARKET, BY SECURITY TYPE, 2018–2023 (USD MILLION)
  • TABLE 238 KSA: ZERO TRUST SECURITY MARKET, BY SECURITY TYPE, 2024–2029 (USD MILLION)
  • TABLE 239 KSA: ZERO TRUST SECURITY MARKET, BY AUTHENTICATION TYPE, 2018–2023 (USD MILLION)
  • TABLE 240 KSA: ZERO TRUST SECURITY MARKET, BY AUTHENTICATION TYPE, 2024–2029 (USD MILLION)
  • TABLE 241 KSA: ZERO TRUST SECURITY MARKET, BY VERTICAL, 2018–2023 (USD MILLION)
  • TABLE 242 KSA: ZERO TRUST SECURITY MARKET, BY VERTICAL, 2024–2029 (USD MILLION)
  • TABLE 243 UAE: ZERO TRUST SECURITY MARKET, BY OFFERING, 2018–2023 (USD MILLION)
  • TABLE 244 UAE: ZERO TRUST SECURITY MARKET, BY OFFERING, 2024–2029 (USD MILLION)
  • TABLE 245 UAE: ZERO TRUST SECURITY MARKET, BY SECURITY TYPE, 2018–2023 (USD MILLION)
  • TABLE 246 UAE: ZERO TRUST SECURITY MARKET, BY SECURITY TYPE, 2024–2029 (USD MILLION)
  • TABLE 247 UAE: ZERO TRUST SECURITY MARKET, BY AUTHENTICATION TYPE, 2018–2023 (USD MILLION)
  • TABLE 248 UAE: ZERO TRUST SECURITY MARKET, BY AUTHENTICATION TYPE, 2024–2029 (USD MILLION)
  • TABLE 249 UAE: ZERO TRUST SECURITY MARKET, BY VERTICAL, 2018–2023 (USD MILLION)
  • TABLE 250 UAE: ZERO TRUST SECURITY MARKET, BY VERTICAL, 2024–2029 (USD MILLION)
  • TABLE 251 REST OF GCC: ZERO TRUST SECURITY MARKET, BY OFFERING, 2018–2023 (USD MILLION)
  • TABLE 252 REST OF GCC: ZERO TRUST SECURITY MARKET, BY OFFERING, 2024–2029 (USD MILLION)
  • TABLE 253 REST OF GCC: ZERO TRUST SECURITY MARKET, BY SECURITY TYPE, 2018–2023 (USD MILLION)
  • TABLE 254 REST OF GCC: ZERO TRUST SECURITY MARKET, BY SECURITY TYPE, 2024–2029 (USD MILLION)
  • TABLE 255 REST OF GCC: ZERO TRUST SECURITY MARKET, BY AUTHENTICATION TYPE, 2018–2023 (USD MILLION)
  • TABLE 256 REST OF GCC: ZERO TRUST SECURITY MARKET, BY AUTHENTICATION TYPE, 2024–2029 (USD MILLION)
  • TABLE 257 REST OF GCC: ZERO TRUST SECURITY MARKET, BY VERTICAL, 2018–2023 (USD MILLION)
  • TABLE 258 REST OF GCC: ZERO TRUST SECURITY MARKET, BY VERTICAL, 2024–2029 (USD MILLION)
  • TABLE 259 SOUTH AFRICA: ZERO TRUST SECURITY MARKET, BY OFFERING, 2018–2023 (USD MILLION)
  • TABLE 260 SOUTH AFRICA: ZERO TRUST SECURITY MARKET, BY OFFERING, 2024–2029 (USD MILLION)
  • TABLE 261 SOUTH AFRICA: ZERO TRUST SECURITY MARKET, BY SECURITY TYPE, 2018–2023 (USD MILLION)
  • TABLE 262 SOUTH AFRICA: ZERO TRUST SECURITY MARKET, BY SECURITY TYPE, 2024–2029 (USD MILLION)
  • TABLE 263 SOUTH AFRICA: ZERO TRUST SECURITY MARKET, BY AUTHENTICATION TYPE, 2018–2023 (USD MILLION)
  • TABLE 264 SOUTH AFRICA: ZERO TRUST SECURITY MARKET, BY AUTHENTICATION TYPE, 2024–2029 (USD MILLION)
  • TABLE 265 SOUTH AFRICA: ZERO TRUST SECURITY MARKET, BY VERTICAL, 2018–2023 (USD MILLION)
  • TABLE 266 SOUTH AFRICA: ZERO TRUST SECURITY MARKET, BY VERTICAL, 2024–2029 (USD MILLION)
  • TABLE 267 REST OF MIDDLE EAST & AFRICA: ZERO TRUST SECURITY MARKET, BY OFFERING, 2018–2023 (USD MILLION)
  • TABLE 268 REST OF MIDDLE EAST & AFRICA: ZERO TRUST SECURITY MARKET, BY OFFERING, 2024–2029 (USD MILLION)
  • TABLE 269 REST OF MIDDLE EAST & AFRICA: ZERO TRUST SECURITY MARKET, BY SECURITY TYPE, 2018–2023 (USD MILLION)
  • TABLE 270 REST OF MIDDLE EAST & AFRICA: ZERO TRUST SECURITY MARKET, BY SECURITY TYPE, 2024–2029 (USD MILLION)
  • TABLE 271 REST OF MIDDLE EAST & AFRICA: ZERO TRUST SECURITY MARKET, BY AUTHENTICATION TYPE, 2018–2023 (USD MILLION)
  • TABLE 272 REST OF MIDDLE EAST & AFRICA: ZERO TRUST SECURITY MARKET, BY AUTHENTICATION TYPE, 2024–2029 (USD MILLION)
  • TABLE 273 REST OF MIDDLE EAST & AFRICA: ZERO TRUST SECURITY MARKET, BY VERTICAL, 2018–2023 (USD MILLION)
  • TABLE 274 REST OF MIDDLE EAST & AFRICA: ZERO TRUST SECURITY MARKET, BY VERTICAL, 2024–2029 (USD MILLION)
  • TABLE 275 LATIN AMERICA: ZERO TRUST SECURITY MARKET, BY OFFERING, 2018–2023 (USD MILLION)
  • TABLE 276 LATIN AMERICA: ZERO TRUST SECURITY MARKET, BY OFFERING, 2024–2029 (USD MILLION)
  • TABLE 277 LATIN AMERICA: ZERO TRUST SECURITY MARKET, BY SECURITY TYPE, 2018–2023 (USD MILLION)
  • TABLE 278 LATIN AMERICA: ZERO TRUST SECURITY MARKET, BY SECURITY TYPE, 2024–2029 (USD MILLION)
  • TABLE 279 LATIN AMERICA: ZERO TRUST SECURITY MARKET, BY AUTHENTICATION TYPE, 2018–2023 (USD MILLION)
  • TABLE 280 LATIN AMERICA: ZERO TRUST SECURITY MARKET, BY AUTHENTICATION TYPE, 2024–2029 (USD MILLION)
  • TABLE 281 LATIN AMERICA: ZERO TRUST SECURITY MARKET, BY VERTICAL, 2018–2023 (USD MILLION)
  • TABLE 282 LATIN AMERICA: ZERO TRUST SECURITY MARKET, BY VERTICAL, 2024–2029 (USD MILLION)
  • TABLE 283 LATIN AMERICA: ZERO TRUST SECURITY MARKET, BY APPLICATION, 2018–2023 (USD MILLION)
  • TABLE 284 LATIN AMERICA: ZERO TRUST SECURITY MARKET, BY APPLICATION, 2024–2029 (USD MILLION)
  • TABLE 285 LATIN AMERICA: ZERO TRUST SECURITY MARKET, BY COUNTRY, 2018–2023 (USD MILLION)
  • TABLE 286 LATIN AMERICA: ZERO TRUST SECURITY MARKET, BY COUNTRY, 2024–2029 (USD MILLION)
  • TABLE 287 BRAZIL: ZERO TRUST SECURITY MARKET, BY OFFERING, 2018–2023 (USD MILLION)
  • TABLE 288 BRAZIL: ZERO TRUST SECURITY MARKET, BY OFFERING, 2024–2029 (USD MILLION)
  • TABLE 289 BRAZIL: ZERO TRUST SECURITY MARKET, BY SECURITY TYPE, 2018–2023 (USD MILLION)
  • TABLE 290 BRAZIL: ZERO TRUST SECURITY MARKET, BY SECURITY TYPE, 2024–2029 (USD MILLION)
  • TABLE 291 BRAZIL: ZERO TRUST SECURITY MARKET, BY AUTHENTICATION TYPE, 2018–2023 (USD MILLION)
  • TABLE 292 BRAZIL: ZERO TRUST SECURITY MARKET, BY AUTHENTICATION TYPE, 2024–2029 (USD MILLION)
  • TABLE 293 BRAZIL: ZERO TRUST SECURITY MARKET, BY VERTICAL, 2018–2023 (USD MILLION)
  • TABLE 294 BRAZIL: ZERO TRUST SECURITY MARKET, BY VERTICAL, 2024–2029 (USD MILLION)
  • TABLE 295 MEXICO: ZERO TRUST SECURITY MARKET, BY OFFERING, 2018–2023 (USD MILLION)
  • TABLE 296 MEXICO: ZERO TRUST SECURITY MARKET, BY OFFERING, 2024–2029 (USD MILLION)
  • TABLE 297 MEXICO: ZERO TRUST SECURITY MARKET, BY SECURITY TYPE, 2018–2023 (USD MILLION)
  • TABLE 298 MEXICO: ZERO TRUST SECURITY MARKET, BY SECURITY TYPE, 2024–2029 (USD MILLION)
  • TABLE 299 MEXICO: ZERO TRUST SECURITY MARKET, BY AUTHENTICATION TYPE, 2018–2023 (USD MILLION)
  • TABLE 300 MEXICO: ZERO TRUST SECURITY MARKET, BY AUTHENTICATION TYPE, 2024–2029 (USD MILLION)
  • TABLE 301 MEXICO: ZERO TRUST SECURITY MARKET, BY VERTICAL, 2018–2023 (USD MILLION)
  • TABLE 302 MEXICO: ZERO TRUST SECURITY MARKET, BY VERTICAL, 2024–2029 (USD MILLION)
  • TABLE 303 REST OF LATIN AMERICA: ZERO TRUST SECURITY MARKET, BY OFFERING, 2018–2023 (USD MILLION)
  • TABLE 304 REST OF LATIN AMERICA: ZERO TRUST SECURITY MARKET, BY OFFERING, 2024–2029 (USD MILLION)
  • TABLE 305 REST OF LATIN AMERICA: ZERO TRUST SECURITY MARKET, BY SECURITY TYPE, 2018–2023 (USD MILLION)
  • TABLE 306 REST OF LATIN AMERICA: ZERO TRUST SECURITY MARKET, BY SECURITY TYPE, 2024–2029 (USD MILLION)
  • TABLE 307 REST OF LATIN AMERICA: ZERO TRUST SECURITY MARKET, BY AUTHENTICATION TYPE, 2018–2023 (USD MILLION)
  • TABLE 308 REST OF LATIN AMERICA: ZERO TRUST SECURITY MARKET, BY AUTHENTICATION TYPE, 2024–2029 (USD MILLION)
  • TABLE 309 REST OF LATIN AMERICA: ZERO TRUST SECURITY MARKET, BY VERTICAL, 2018–2023 (USD MILLION)
  • TABLE 310 REST OF LATIN AMERICA: ZERO TRUST SECURITY MARKET, BY VERTICAL, 2024–2029 (USD MILLION)
  • TABLE 311 OVERVIEW OF STRATEGIES ADOPTED BY ZERO TRUST SECURITY VENDORS
  • TABLE 312 ZERO TRUST SECURITY MARKET: DEGREE OF COMPETITION
  • TABLE 313 ZERO TRUST SECURITY MARKET: OFFERING FOOTPRINT
  • TABLE 314 ZERO TRUST SECURITY MARKET: DETAILED LIST OF KEY STARTUPS/SMES
  • TABLE 315 VERTICAL FOOTPRINT OF STARTUPS/SMES
  • TABLE 316 REGIONAL FOOTPRINT OF STARTUPS/SMES
  • TABLE 317 ZERO TRUST SECURITY MARKET: PRODUCT LAUNCHES, JANUARY 2021–JULY 2024
  • TABLE 318 ZERO TRUST SECURITY MARKET: DEALS, JANUARY 2021–JULY 2024
  • TABLE 319 CISCO: OTHER DEVELOPMENTS, JANUARY 2021–JULY 2024
  • TABLE 320 PALO ALTO NETWORKS: COMPANY OVERVIEW
  • TABLE 321 PALO ALTO NETWORKS: PRODUCTS/SOLUTIONS/SERVICES OFFERED
  • TABLE 322 PALO ALTO NETWORKS: PRODUCT LAUNCHES & ENHANCEMENTS
  • TABLE 323 PALO ALTO NETWORKS: DEALS
  • TABLE 324 VMWARE: COMPANY OVERVIEW
  • TABLE 325 VMWARE: PRODUCTS/SOLUTIONS/SERVICES OFFERED
  • TABLE 326 VMWARE: DEALS
  • TABLE 327 ZSCALER: BUSINESS OVERVIEW
  • TABLE 328 ZSCALER: PRODUCTS/SOLUTIONS/SERVICES OFFERED
  • TABLE 329 ZSCALER: PRODUCT LAUNCHES & ENHANCEMENTS
  • TABLE 330 ZSCALER: DEALS
  • TABLE 331 AKAMAI: COMPANY OVERVIEW
  • TABLE 332 AKAMAI: PRODUCTS/SOLUTIONS/SERVICES OFFERED
  • TABLE 333 AKAMAI: PRODUCT LAUNCHES & ENHANCEMENTS
  • TABLE 334 AKAMAI: DEALS
  • TABLE 335 MICROSOFT: COMPANY OVERVIEW
  • TABLE 336 MICROSOFT: PRODUCTS/SOLUTIONS/SERVICES OFFERED
  • TABLE 337 MICROSOFT: PRODUCT LAUNCHES & ENHANCEMENTS
  • TABLE 338 MICROSOFT: DEALS
  • TABLE 339 CISCO: COMPANY OVERVIEW
  • TABLE 340 CISCO: PRODUCTS/SOLUTIONS/SERVICES OFFERED
  • TABLE 341 CISCO: PRODUCT LAUNCHES & ENHANCEMENTS
  • TABLE 342 CISCO: DEALS
  • TABLE 343 CISCO: OTHER DEVELOPMENTS
  • TABLE 344 IBM: COMPANY OVERVIEW
  • TABLE 345 IBM: PRODUCTS/SOLUTIONS/SERVICES OFFERED
  • TABLE 346 IBM: DEALS
  • TABLE 347 CITRIX: COMPANY OVERVIEW
  • TABLE 348 CITRIX: PRODUCTS/SOLUTIONS/SERVICES OFFERED
  • TABLE 349 CITRIX: PRODUCT LAUNCHES & ENHANCEMENTS
  • TABLE 350 CITRIX: DEALS
  • TABLE 351 CHECK POINT: COMPANY OVERVIEW
  • TABLE 352 CHECK POINT: PRODUCTS/SOLUTIONS/SERVICES OFFERED
  • TABLE 353 CHECK POINT: PRODUCT LAUNCHES & ENHANCEMENTS
  • TABLE 354 CHECK POINT: DEALS
  • TABLE 355 TRELLIX: COMPANY OVERVIEW
  • TABLE 356 TRELLIX: PRODUCTS/SOLUTIONS/SERVICES OFFERED
  • TABLE 357 TRELLIX: PRODUCT LAUNCHES & ENHANCEMENTS
  • TABLE 358 FORCEPOINT: COMPANY OVERVIEW
  • TABLE 359 FORCEPOINT: PRODUCTS/SOLUTIONS/SERVICES OFFERED
  • TABLE 360 FORCEPOINT: PRODUCT LAUNCHES & ENHANCEMENTS
  • TABLE 361 FORCEPOINT: DEALS
  • TABLE 362 CROWDSTRIKE: COMPANY OVERVIEW
  • TABLE 363 CROWDSTRIKE: PRODUCTS/SOLUTIONS/SERVICES OFFERED
  • TABLE 364 CROWDSTRIKE: PRODUCT LAUNCHES & ENHANCEMENTS
  • TABLE 365 CROWDSTRIKE: DEALS
  • TABLE 366 CLOUDFLARE: COMPANY OVERVIEW
  • TABLE 367 CLOUDFLARE: PRODUCTS/SOLUTIONS/SERVICES OFFERED
  • TABLE 368 CLOUDFLARE: PRODUCT LAUNCHES & ENHANCEMENTS
  • TABLE 369 CLOUDFLARE: DEALS
  • TABLE 370 FORTINET: COMPANY OVERVIEW
  • TABLE 371 FORTINET: PRODUCTS/SOLUTIONS/SERVICES OFFERED
  • TABLE 372 GOOGLE: COMPANY OVERVIEW
  • TABLE 373 GOOGLE: PRODUCTS/SOLUTIONS/SERVICES OFFERED
  • TABLE 374 GOOGLE: PRODUCT LAUNCHES & ENHANCEMENTS
  • TABLE 375 GOOGLE: DEALS
  • TABLE 376 QNEXT: COMPANY OVERVIEW
  • TABLE 377 QNEXT: PRODUCTS/SOLUTIONS/SERVICES OFFERED
  • TABLE 378 QNEXT: PRODUCT LAUNCHES & ENHANCEMENTS
  • TABLE 379 QNEXT: DEALS
  • TABLE 380 ADJACENT MARKETS AND FORECASTS
  • TABLE 381 IDENTITY AND ACCESS MANAGEMENT MARKET, BY OFFERING, 2018–2023 (USD MILLION)
  • TABLE 382 IDENTITY AND ACCESS MANAGEMENT MARKET, BY OFFERING, 2024–2029 (USD MILLION)
  • TABLE 383 IDENTITY AND ACCESS MANAGEMENT MARKET, BY TYPE, 2018–2023 (USD MILLION)
  • TABLE 384 IDENTITY AND ACCESS MANAGEMENT MARKET, BY TYPE, 2024–2029 (USD MILLION)
  • TABLE 385 CYBERSECURITY MARKET, BY OFFERING, 2017–2022 (USD MILLION)
  • TABLE 386 CYBERSECURITY MARKET, BY OFFERING, 2023–2028 (USD MILLION)
  • TABLE 387 CYBERSECURITY MARKET, BY DEPLOYMENT MODE, 2017–2022 (USD MILLION)
  • TABLE 388 CYBERSECURITY MARKET, BY DEPLOYMENT MODE, 2023–2028 (USD MILLION)
  • TABLE 389 CYBERSECURITY MARKET, BY ORGANIZATION SIZE, 2017–2022 (USD MILLION)
  • TABLE 390 CYBERSECURITY MARKET, BY ORGANIZATION SIZE, 2023–2028 (USD MILLION)
  • TABLE 391 CYBERSECURITY MARKET, BY SECURITY TYPE, 2017–2022 (USD MILLION)
  • TABLE 392 CYBERSECURITY MARKET, BY SECURITY TYPE, 2023–2028 (USD MILLION)
LIST OF FIGURES
 
  • FIGURE 1 ZERO TRUST SECURITY MARKET: RESEARCH DESIGN
  • FIGURE 2 BREAKDOWN OF PRIMARY INTERVIEWS: BY COMPANY TYPE, DESIGNATION, AND REGION
  • FIGURE 3 ZERO TRUST SECURITY MARKET: DATA TRIANGULATION
  • FIGURE 4 ZERO TRUST SECURITY MARKET ESTIMATION: RESEARCH FLOW
  • FIGURE 5 APPROACH 1 (SUPPLY SIDE): REVENUE FROM SOFTWARE/SERVICES OF ZERO TRUST SECURITY VENDORS
  • FIGURE 6 APPROACH 2 (SUPPLY-SIDE ANALYSIS)
  • FIGURE 7 MARKET SIZE ESTIMATION METHODOLOGY (APPROACH 2): BOTTOM-UP (DEMAND SIDE) — PRODUCTS/SOLUTIONS/SERVICES
  • FIGURE 8 ZERO TRUST SECURITY MARKET SIZE AND Y-O-Y GROWTH RATE
  • FIGURE 9 SEGMENTS WITH SIGNIFICANT MARKET SHARE AND GROWTH RATE
  • FIGURE 10 NORTH AMERICA TO ACCOUNT FOR LARGEST MARKET SHARE IN 2024
  • FIGURE 11 INCREASING INSTANCES OF SOPHISTICATED CYBERATTACKS AND NEED FOR ADHERENCE TO REGULATORY COMPLIANCE TO DRIVE MARKET
  • FIGURE 12 SERVICES SEGMENT TO REGISTER HIGHER CAGR THAN SOLUTIONS SEGMENT DURING FORECAST PERIOD
  • FIGURE 13 API SECURITY SEGMENT TO REGISTER HIGHEST CAGR DURING FORECAST PERIOD
  • FIGURE 14 CLOUD SECURITY SEGMENT TO LEAD MARKET DURING FORECAST PERIOD
  • FIGURE 15 MULTI-FACTOR AUTHENTICATION SEGMENT TO REGISTER HIGHER CAGR THAN SINGLE-FACTOR AUTHENTICATION SEGMENT DURING FORECAST PERIOD
  • FIGURE 16 RETAIL & E-COMMERCE SEGMENT TO REGISTER HIGHEST CAGR DURING FORECAST PERIOD
  • FIGURE 17 ASIA PACIFIC TO EMERGE AS LUCRATIVE MARKET FOR INVESTMENTS IN NEXT FIVE YEARS
  • FIGURE 18 ZERO TRUST SECURITY MODERN ARCHITECTURE
  • FIGURE 19 SEVEN PILLARS OF ZERO TRUST SECURITY MODEL
  • FIGURE 20 ZERO TRUST SECURITY MARKET: DRIVERS, RESTRAINTS, OPPORTUNITIES, AND CHALLENGES
  • FIGURE 21 POTENTIAL OF GENERATIVE AI IN ENHANCING ZERO TRUST SECURITY MARKET ACROSS INDUSTRIES
  • FIGURE 22 IMPACT OF GENERATIVE AI ON INTERCONNECTED AND ADJACENT ECOSYSTEMS
  • FIGURE 23 VALUE CHAIN ANALYSIS
  • FIGURE 24 ZERO TRUST SECURITY MARKET: ECOSYSTEM
  • FIGURE 25 ZERO TRUST SECURITY MARKET: PORTER’S FIVE FORCES ANALYSIS
  • FIGURE 26 AVERAGE SELLING PRICE TREND OF KEY PLAYERS, BY AUTHENTICATION TYPE
  • FIGURE 27 NUMBER OF PATENTS GRANTED FOR ZERO TRUST SECURITY MARKET, 2014–2024
  • FIGURE 28 REGIONAL ANALYSIS OF PATENTS GRANTED FOR ZERO TRUST SECURITY MARKET
  • FIGURE 29 REVENUE SHIFT OF ZERO TRUST SECURITY MARKET VENDORS
  • FIGURE 30 INFLUENCE OF STAKEHOLDERS ON BUYING PROCESS OF TOP THREE VERTICALS
  • FIGURE 31 KEY BUYING CRITERIA FOR TOP THREE VERTICALS
  • FIGURE 32 LEADING GLOBAL ZERO TRUST SECURITY STARTUPS AND SMES, BY NUMBER OF INVESTORS AND FUNDING AMOUNT, 2020–2024
  • FIGURE 33 SOLUTIONS SEGMENT TO DOMINATE MARKET DURING FORECAST PERIOD
  • FIGURE 34 ACCESS CONTROL SEGMENT TO DOMINATE MARKET DURING FORECAST PERIOD
  • FIGURE 35 CLOUD SECURITY SEGMENT TO LEAD MARKET DURING FORECAST PERIOD
  • FIGURE 36 MULTI-FACTOR AUTHENTICATION SEGMENT TO REGISTER HIGHER CAGR DURING FORECAST PERIOD
  • FIGURE 37 IT & ITES SEGMENT TO DOMINATE MARKET DURING FORECAST PERIOD
  • FIGURE 38 ASIA PACIFIC TO GROW AT HIGHEST CAGR DURING FORECAST PERIOD
  • FIGURE 39 NORTH AMERICA: MARKET SNAPSHOT
  • FIGURE 40 ASIA PACIFIC: ZERO TRUST SECURITY MARKET SNAPSHOT
  • FIGURE 41 SEGMENTAL REVENUE ANALYSIS OF TOP FIVE MARKET PLAYERS, 2019–2023 (USD MILLION)
  • FIGURE 42 SHARE OF LEADING COMPANIES IN ZERO TRUST SECURITY MARKET
  • FIGURE 43 ZERO TRUST SECURITY MARKET: COMPARISON OF VENDORS’ BRANDS
  • FIGURE 44 ZERO TRUST SECURITY MARKET: COMPANY VALUATION OF KEY VENDORS (USD BILLION)
  • FIGURE 45 ZERO TRUST SECURITY MARKET: FINANCIAL METRICS OF KEY VENDORS
  • FIGURE 46 COMPANY EVALUATION MATRIX: KEY PLAYERS, 2023
  • FIGURE 47 ZERO TRUST SECURITY MARKET: COMPANY FOOTPRINT
  • FIGURE 48 COMPANY EVALUATION MATRIX: STARTUPS/SMES, 2023
  • FIGURE 49 PALO ALTO NETWORKS: COMPANY SNAPSHOT
  • FIGURE 50 VMWARE: COMPANY SNAPSHOT
  • FIGURE 51 ZSCALER: COMPANY SNAPSHOT
  • FIGURE 52 AKAMAI: COMPANY SNAPSHOT
  • FIGURE 53 MICROSOFT: COMPANY SNAPSHOT
  • FIGURE 54 CISCO: COMPANY SNAPSHOT
  • FIGURE 55 IBM: COMPANY SNAPSHOT
  • FIGURE 56 CHECK POINT: COMPANY SNAPSHOT
  • FIGURE 57 CROWDSTRIKE: COMPANY SNAPSHOT
  • FIGURE 58 CLOUDFLARE: COMPANY SNAPSHOT
  • FIGURE 59 FORTINET: COMPANY SNAPSHOT
  • FIGURE 60 GOOGLE: COMPANY SNAPSHOT

The market size of zero trust security was ascertained through a range of essential research efforts. A lot of secondary research was done to learn more about the sector. Primary research with industry professionals from all points of the value chain then confirmed these conclusions, hypotheses, and estimates. A variety of strategies, including top-down and bottom-up approaches, were used to estimate the total market size. The market sizes of the various segments and subsegments within the zero trust security market were then determined using market segmentation and data triangulation approaches.

Secondary Research

During the secondary research phase, various sources were looked into to gather information for the study. These secondary sources included annual reports, press releases, investor presentations from Zero Trust Security software and service providers, online forums, accredited publications and white papers. This secondary research was used to get insights into the industry supply chain, key players, market segmentation down to granular level, regional markets and notable developments from market and technology perspective. These findings were then validated through primary sources. Factors considered to estimate regional market size included government and technology initiatives, Gross Domestic Product (GDP) growth rates, Information and Communication Technology (ICT) spend, recent market developments and a thorough analysis of major Operational Technology Security solution providers’ market position.

Primary Research

The comprehensive market engineering process employed a combination of top-down and bottom-up approaches, complemented by various data triangulation methods, to estimate accurately and forecast market trends for overall market segments and subsegments outlined in the report. The report accordingly compiled and presented key insights and information through accurate qualitative and quantitative analyses ran throughout the market engineering process.

After completing the market engineering process, which encloses calculations for market statistics, segmentation breakdowns, market size estimations, forecasts, and data triangulation, thorough primary research was conducted. This primary research gathered, verified, and validated critical numerical data and identified segmentation types, industry trends, and the competitive landscape within the Zero Trust Security market. The primary research was instrumental in elucidating fundamental market dynamics, Including drivers, restraints, opportunities, challenges, industry trends, and strategic initiatives market players adopt.

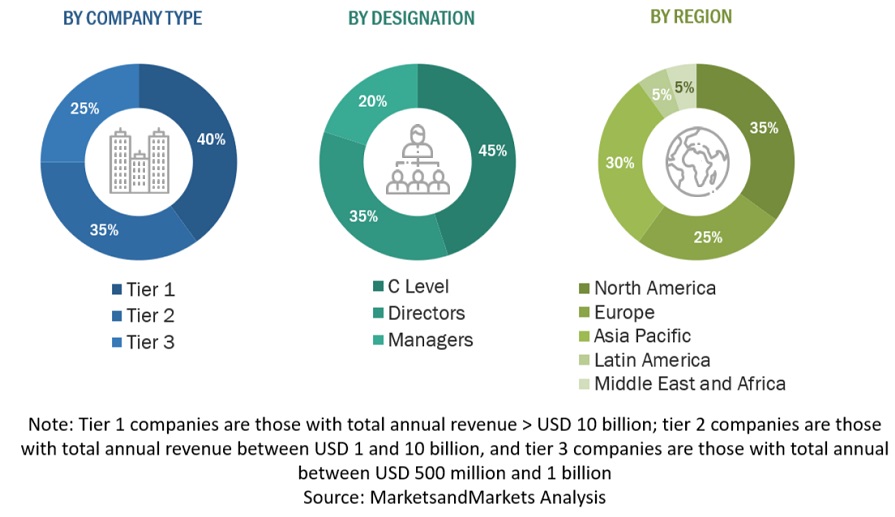
Following is the breakup of the primary study:

Zero Trust Security Market  Size, and Share

To know about the assumptions considered for the study, download the pdf brochure

Market Size Estimation

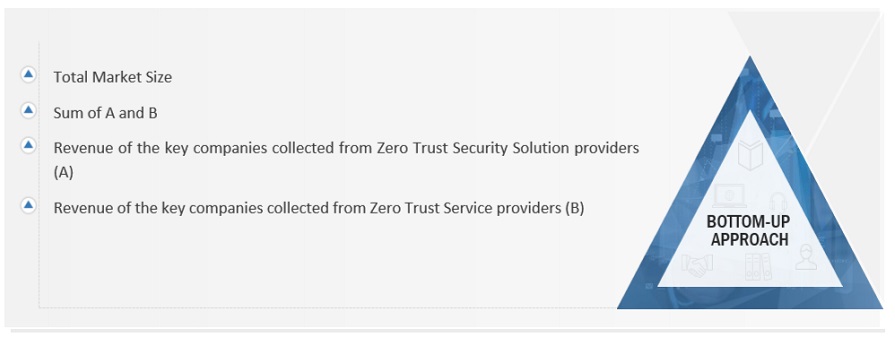
Both top-down and bottom-up methods were implemented to get an accurate picture of the global Zero Trust Security market's size. Also evaluated the sizes of different parts within this bigger market. This approach had several steps:First, Identifying the main players in the market through a lot of background reading. Then, looked at the revenue made in different Regions by the players. To do this, Have gone through reports and spoken to people in charge. Spent time looking at yearly and revenue reports from the top companies. Also had primary interviews with industry leaders like CEOs, VPs, directors, and marketing bosses to learn more. All the numbers about market splits and different parts came from reading reports. Re-ensured these numbers were Accurate by talking to Officials.

INFOGRAPHIC DEPICTING BOTTOM-UP AND TOP-DOWN APPROACHES

Zero Trust Security Market  Top Down Approach

To know about the assumptions considered for the study, Request for Free Sample Report
Zero Trust Security Market  Bottom Up Approach

Data Triangulation

Following the determination of the overall market size using the market above size estimation methodologies, the market was segmented into distinct segments and subsegments. Data triangulation and market segmentation procedures were utilized, as needed, to complete the comprehensive market engineering process and ascertain the precise statistics for each market segment and subsegment. Data triangulation was achieved by analyzing various factors and trends from both the demand and supply sides.

Market Definition

The US National Institute of Standards and Technology (NIST), in its current draft of standards for zero trust architecture, defines zero trust in the following manner: “Zero trust is a cybersecurity paradigm focused on resource protection and the premise that trust is never granted implicitly but must be continually evaluated.” Zero trust security is, therefore, not only a product or an approach—it is a web of connected policies, practices, software, and hardware that create an entire zero-trust ecosystem.

According to CrowdStrike, zero trust is a security concept that requires all users, even those inside the organization’s enterprise network, to be authenticated, authorized, and continuously validating security configuration and posture before being granted or keeping access to applications and data.

Further, according to Akamai Technologies, zero trust is a network security model, based on a strict identity verification process. The framework dictates that only authenticated and authorized users and devices can access applications and data. At the same time, it protects those applications and users from advanced threats on the Internet”.

Report Objectives

  • To define, describe, and forecast the Zero Trust Security market based on offering, application, security type, authentication type, vertical, and region.
  • To forecast the market size of five central regions: North America, Europe, Asia Pacific (APAC), Middle East & Africa (MEA), and Latin America.
  • To analyze the subsegments of the market concerning individual growth trends, prospects, and contributions to the overall market.
  • To provide detailed information related to the primary factors (drivers, restraints, opportunities, and challenges) influencing the growth of Zero Trust Security market.
  • To analyze opportunities in the market for stakeholders by identifying high-growth segments of the Zero Trust Security market.  
  • To profile the key players of the Zero Trust Security market and comprehensively analyze their market size and core competencies.  
  • Track and analyze competitive developments, such as new product launches, mergers and acquisitions, partnerships, agreements, and collaborations in the global Zero Trust Security market.

Customization Options

With the given market data, MarketsandMarkets offers customizations based on company-specific needs. The following customization options are available for the report:

Geographic Analysis

  • Further breakup of the Asia Pacific market into major countries.
  • Further breakup of the North American market into major countries.
  • Further breakup of the Latin American market into major countries.
  • Further breakup of the Middle East African market into major countries
  • Further breakup of the European market into major countries.

Company Information

  • Detailed analysis and profiling of additional market players (up to 5)

Previous Versions of this Report

Zero Trust Security Market by Offering, Security type, Authentication Type (Single Factor, Multi Factor), Vertical (BFSI, Government & Defense, IT & ITES, Healthcare, Retail E-commerce, Energy and Utilities) and Region - Global Forecast to 2029

Report Code TC 7384
Published in Jul, 2024, By MarketsandMarkets™

Zero Trust Security Market by Offering (Solution and Services), Security Type (Network Security, Application Security, Cloud Security, and Endpoint Security and IoT Security), Authentication Type, Vertical and Region - Global Forecast to 2028

Report Code TC 7384
Published in Sep, 2023, By MarketsandMarkets™

Zero Trust Security Market by Solution Type (Data Security, Endpoint Security, API Security, Security Analytics, and Security Policy Management), Deployment Mode, Authentication Type, Organization Size, Vertical and Region - Global Forecast to 2027

Report Code TC 7384
Published in Jun, 2022, By MarketsandMarkets™

Zero Trust Security Market by Solution Type (Data Security, Endpoint Security, API Security, Security Analytics, Security Policy Management), Deployment Type, Authentication Type, Organization Size, Vertical, and Region - Global Forecast to 2026

Report Code TC 7384
Published in Feb, 2021, By MarketsandMarkets™

Zero Trust Security Market by Solution Type (Data Security, Endpoint Security, API Security, Security Analytics, Security Policy Management), Deployment Type, Authentication Type, Organization Size, Vertical, and Region - Global Forecast to 2026

Report Code TC 7384
Published in Oct, 2019, By MarketsandMarkets™

Custom Market Research Services

We Will Customise The Research For You, In Case The Report Listed Above Does Not Meet With Your Requirements

Get 10% Free Customisation

Growth opportunities and latent adjacency in Zero Trust Security Market

DMCA.com Protection Status