Fire Testing Market by Service Type (Testing, Inspection, and Certification), Sourcing Type (In-house and Outsourced), Application (Consumer Goods & Retail, Chemicals, Construction & Infrastructure, Mining) Region - Global Forecast till 2025-2036


The global fire testing market was valued at USD 8.58 billion in 2024 and is projected to reach USD 17.85 billion by 2036, growing at a CAGR of 6.3% between 2025 and 2036.
The global fire testing market is driven by the rising enforcement of fire-safety regulations, growth in infrastructure modernization, and increasing emphasis on risk prevention across commercial, industrial, and residential sectors. Advancements such as automated fire resistance testing, AI-enabled test data analytics, and simulation-based performance evaluation are enhancing the efficiency and accuracy of testing processes. The market is becoming increasingly technology-driven, with service providers focusing on innovation, regulatory alignment, and regional expansion to meet diverse compliance requirements worldwide.

Fire testing is the process of evaluating the behavior of materials and products when exposed to fire to determine their performance in terms of fire resistance, flammability, heat release, and smoke spread characteristics. It ensures compliance with international standards such as EN, ISO, and ASTM, helping assess safety and reliability across applications, including construction, industrial manufacturing, energy, transportation, and consumer goods.
Market by Application
Consumer Goods & Retail
The consumer goods and retail segment represents the fastest-growing application within the fire testing market. Rising consumer safety awareness and stringent global regulations for furniture, textiles, home appliances, and packaging materials are driving demand. Manufacturers are increasingly investing in third-party certification and flammability testing to comply with ISO, EN, and UL standards. The push toward sustainable, low-emission, and flame-retardant materials in everyday products further accelerates growth, positioning this segment as a key driver of market expansion.
Construction & Infrastructure
Construction and infrastructure remain the dominant application for fire testing globally. The adoption of new façade materials, insulation composites, and green building technologies has elevated the need for comprehensive fire-resistance and smoke-toxicity evaluations. Regulatory tightening under EN 13501, ASTM E84, and ISO 5660 standards continues to drive demand. Increasing urbanization, smart-city initiatives, and retrofit programs for aging structures are further expanding market potential for building and material fire testing.
Industrial & Manufacturing
Industrial and manufacturing applications represent a significant share of the fire testing market, driven by factory safety audits and equipment certification requirements. The use of composite materials, lubricants, and high-temperature processes increases fire risk, necessitating compliance testing. Manufacturers are implementing proactive fire testing as part of EHS (Environment, Health & Safety) frameworks. Demand is further supported by automation and IoT-driven monitoring integrated with preventive fire assessment systems.
Market by Sourcing Type
In-house
In-house fire testing currently dominates the market, accounting for the majority share due to its strong presence among large manufacturers and industrial operators with established quality control systems. These companies maintain dedicated laboratories to perform continuous product validation, R&D testing, and early-stage compliance assessments. In-house testing ensures faster turnaround, data confidentiality, and alignment with internal safety protocols. However, despite its scale advantage, high infrastructure and maintenance costs limit its expansion to smaller organizations.
Outsourced
Outsourced fire testing holds a smaller market share but is growing at a significantly faster rate, driven by increasing dependence on accredited third-party laboratories for independent certification and global compliance. The rising complexity of materials, façade designs, and safety standards has made outsourcing a practical choice for manufacturers lacking in-house facilities. It offers access to specialized equipment, multi-standard testing, and international certification support, positioning it as the market's most dynamic and rapidly expanding sourcing model.
Market by Geography
Geographically, the fire testing market is witnessing strong growth across North America, Europe, Asia Pacific, and the Rest of the World (RoW). Asia Pacific continues to lead the market, driven by rapid industrialization, large-scale infrastructure development, and stricter enforcement of building safety regulations across emerging economies. North America maintains a significant share owing to advanced laboratory infrastructure, increasing adoption of performance-based fire testing, and continuous upgrades in compliance with NFPA and ASTM standards. Europe remains a mature yet evolving market, supported by stringent EN and ISO frameworks, growing emphasis on façade fire safety, and energy-efficient building retrofits. Meanwhile, the RoW region, including the Middle East, Africa, and South America, is gaining momentum through expanding commercial construction, government-led safety programs, and alignment with global certification practices.
Market Dynamics
Driver: Growing enforcement of fire safety regulations and standards
Rising enforcement of international fire safety codes such as EN 13501, ISO 5660, ASTM E84, and NFPA is a key driver of the fire testing market. Governments and regulatory bodies are mandating stricter compliance for construction materials, industrial facilities, and consumer products. This has increased the frequency of product certification and building inspection. As sustainability goals expand and new materials enter the market, manufacturers are investing in advanced testing to ensure global conformity and minimize liability risks.
Restraint: High cost of equipment and certification procedures
The fire testing process involves significant capital investment in specialized chambers, instrumentation, and calibration systems, often exceeding the budgets of small and medium manufacturers. Additionally, obtaining certifications across multiple international standards adds complexity and cost. Long test cycles and maintenance expenses further limit accessibility for developing markets. These financial and operational barriers hinder the rapid expansion of accredited laboratories and discourage smaller players from entering the testing ecosystem.
Opportunity: Expansion of electric vehicle and energy storage applications
The rapid growth of electric vehicles (EVs) and battery energy storage systems (BESS) presents a major opportunity for the fire testing industry. With increasing fire incidents linked to lithium-ion batteries, regulators are establishing new performance and safety benchmarks. Testing now extends beyond materials to include modules, enclosures, and thermal management systems. This emerging segment offers strong potential for specialized laboratories providing battery abuse testing, thermal runaway evaluation, and compliance for EV and renewable-energy applications.
Challenge: Complexity of multi-standard compliance across regions
The coexistence of numerous national and regional fire safety codes poses a major challenge for manufacturers and laboratories. Variations between European (EN), American (ASTM/NFPA), and Asian (ISO/JIS) standards often require repeated testing, documentation, and cross-certification. This fragmentation slows product launches and increases administrative workload. Harmonization efforts are ongoing but limited, making multi-standard compliance one of the most time-consuming and resource-intensive aspects of global fire testing operations.
Future Outlook
The fire testing market is poised for steady expansion as global emphasis on fire safety, sustainability, and regulatory compliance continues to intensify across construction, manufacturing, and energy sectors. Advancements in automation, AI-driven data analysis, and simulation-based testing are enabling faster, more accurate evaluations of material and structural performance under fire conditions. Growing investments in smart buildings, electric vehicle infrastructure, and energy storage systems are further widening the application scope of fire testing. As governments tighten safety mandates and industries adopt standardized certification practices, demand for specialized testing laboratories and digital compliance tools will accelerate. Over time, fire testing will play a vital role in enhancing material innovation, mitigating risk, and supporting the development of safer, resilient infrastructure worldwide.
Key Market Players
The top fire testing companies are Intertek Group plc (UK), SGS SA (Switzerland), Bureau Veritas (France), TÜV SÜD (Germany), and Applus+ (Spain).
Key Questions addressed in this report:
- Which applications are expected to drive the growth of the fire testing market in the next 5-10 years?
- Which are the major companies in the fire testing market? What are their major strategies to strengthen their market presence?
- Which is the dominating and potential market for fire testing in terms of region?
- What are the opportunities for new fire testing market entrants?
- Which factors are expected to boost the fire testing market in the next 5-10 years?
 Exclusive indicates content/data unique to MarketsandMarkets and not available with any competitors.
Table of Contents
1 Introduction (Page No. - 18)
1.1 Study Objectives
1.2 Market Definition and Scope
1.2.1 Inclusions and Exclusions
1.3 Study Scope
1.3.1 Markets Covered
1.3.2 Geographic Scope
1.3.3 Years Considered
1.4 Currency
1.5 Limitations
1.6 Stakeholders
2 Research Methodology (Page No. - 22)
2.1 Research Data
2.1.1 Secondary Data
2.1.1.1 List of Major Secondary Sources
2.1.1.2 Key Data From Secondary Sources
2.1.2 Primary Data
2.1.2.1 Key Data From Primary Sources
2.1.2.2 Key Industry Insights
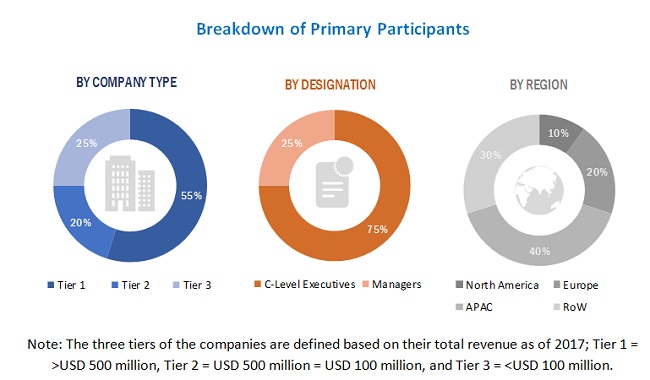
2.1.2.3 Breakdown of Primaries
2.2 Market Size Estimation
2.2.1 Bottom-Up Approach
2.2.2 Top-Down Approach
2.3 Fire Testing Market Breakdown and Data Triangulation
2.4 Research Assumptions
3 Executive Summary (Page No. - 30)
4 Premium Insights (Page No. - 35)
4.1 Attractive Opportunities in Fire Testing Market
4.2 Market, By Sourcing Type
4.3 Market in APAC, By Application
4.4 Market, By Application
4.5 Market, By Region
5 Fire Testing Market Overview (Page No. - 38)
5.1 Introduction
5.2 Market Dynamics
5.2.1 Drivers
5.2.1.1 Increasing Adoption of Safety Systems in Industries
5.2.1.2 Growing Automation in Buildings
5.2.2 Restraints
5.2.2.1 Fire Legislation Requirements and International Regulations for Fire Testing Services
5.2.3 Opportunities
5.2.3.1 Increasing Adoption of Smart City Concept
5.2.3.2 Stringent Government Norms
5.2.3.3 Increasing Demand for Construction Equipment
5.2.4 Challenges
5.2.4.1 Lack of Awareness on Fire Safety in Developing Countries
6 Fire Testing Market, By Service (Page No. - 45)
6.1 Introduction
6.2 Testing
6.2.1 Fire Testing Allows Manufacturers to Understand Behavior of Materials and Products
6.3 Inspection
6.3.1 Fire Inspections are Conducted Yearly Or on Demand as Required
6.4 Certification
6.4.1 Certification Standards Differ From Country to Country for Different Sectors
6.5 Others
7 Fire Testing Market, By Sourcing Type (Page No. - 50)
7.1 Introduction
7.2 In-House
7.2.1 In-House Fire Testing Market in APAC Expected to Grow Owing to Growth of Manufacturing and Engineering Hubs
7.3 Outsourced
7.3.1 Privatization of State-Owned Laboratories Will Drive Growth of Outsourced Fire Testing Services
8 Fire Testing Market, By Application (Page No. - 54)
8.1 Introduction
8.2 Consumer Goods and Retail
8.2.1 Fire Testing Services Help Determine How Devices React to Extreme Heat Or Fire to Ensure Safety of Consumers in Case of Fire
8.3 Agriculture and Food
8.3.1 Stringent Codes for Use of Equipment to Drive Market in Agriculture and Food Industry
8.4 Chemicals
8.4.1 Fire Testing Services Help Companies Understand Potential Risks Related to Fire Hazards
8.5 Construction and Infrastructure
8.5.1 Construction Material Testing to Drive Market in Construction & Infrastructure Market
8.6 Energy & Power
8.6.1 Demand for Fire Suppression Equipment in Power Generating Plants to Drive Market in Energy & Power Sector
8.7 Industrial and Manufacturing
8.7.1 Growing Number of Fire Incidents to Increase Demand for Fire Testing Services in Manufacturing Sector
8.8 Medical and Life Sciences
8.8.1 Increasing Demand for Medical Devices to Drive Market for Medical & Life Sciences Sector
8.9 Mining
8.9.1 Need for Safety in Mining Industry Will Drive Fire Testing Services in Future
8.10 Oil & Gas and Petroleum
8.10.1 Demand for Fire Safety Fosters Growth of Fire Testing Services in Future
8.11 Public Sector
8.11.1 Revised Fire and Life Safety Codes By Governments to Boost Fire Testing Service Market in Public Sector
8.12 Automotive
8.12.1 Component Fire Testing to Foster Growth of Fire Testing Services in Automotive Segment
8.13 Aerospace
8.13.1 Stringent Regulations, Standards, and Legislation to Drive Fire Testing Market in Aerospace and Defense Sector
8.14 Marine & Railway
8.14.1 Wide Range of Standards, Regulations, and Logistical Complexities to Drive Market in Marine & Railway Sector
8.15 Supply Chain and Logistics
8.15.1 Increasing Number of Warehouse Fires to Boost Market in Supply Chain & Logistics Sector
8.16 Others
8.16.1 Need to Ensure Safety of Sports and Leisure Equipment to Drive Fire Testing Services Market in Future
9 Geographic Analysis (Page No. - 98)
9.1 Introduction
9.2 North America
9.2.1 US
9.2.1.1 Booming Building and Construction Industry in The US to Drive The Need for Fire Testing Services
9.2.2 Canada
9.2.2.1 Investments in Oil Sands, Lng, and Energy Infrastructure Drives Market in Canada
9.2.3 Mexico
9.2.3.1 Automotive & Medical Industries to Increase Demand for Fire Testing in Mexico
9.3 Europe
9.3.1 Germany
9.3.1.1 Demand for Renewable Energy Will Drive Fire Testing Market in Germany
9.3.2 UK
9.3.2.1 Construction Industry to Substantially Increase Demand for Fire Testing in UK
9.3.3 France
9.3.3.1 Energy Sector in France to Boost Market Growth
9.3.4 Spain
9.3.4.1 Growing Pharmaceutical and Automobile Industries to Drive The Demand for Fire Testing Services in Spain
9.3.5 Italy
9.3.5.1 Adoption of Advanced Manufacturing Techniques to Drive Demand for Fire Testing Services in Italy
9.3.6 Rest of Europe
9.4 APAC
9.4.1 China
9.4.1.1 Construction Industry to Increase Demand for Market in APAC
9.4.2 Japan
9.4.2.1 Smart City Projects Drive Market in Japan
9.4.3 India
9.4.3.1 Growing Fire Equipment Services Drives Market in India
9.4.4 South Korea
9.4.4.1 Mining & Automotive Sector to Drive The Market for Fire Testing in South Korea
9.4.5 Australia
9.4.5.1 Consumer Segment to Boost The Fire Testing Market in Australia
9.4.6 Rest of APAC
9.5 RoW
9.5.1 South America
9.5.1.1 Growth in Mining Industry Will Drive Market in South American Countries
9.5.2 Middle East
9.5.2.1 Construction Industry in Middle East Will Lead to Increasing Demand for Fire Testing
9.5.3 Africa
9.5.3.1 Mining and Infrastructure Development Will Boost Fire Testing Services in Africa
10 Competitive Landscape (Page No. - 124)
10.1 Overview
10.2 Fire Testing Market Rank Analysis, 2018
10.3 Competitive Situations and Trends
10.3.1 Service Launches
10.3.2 Others
10.4 Competitive Leadership Mapping
10.4.1 Visionary Leaders
10.4.2 Innovators
10.4.3 Dynamic Differentiators
10.4.4 Emerging Companies
10.5 Strength of Service Portfolio (For All 25 Players)
10.6 Business Strategy Excellence (For All 25 Players)
11 Company Profile (Page No. - 133)
11.1 Key Players
(Business Overview, Services Offered, Recent Developments, SWOT Analysis, and MnM View)*
11.1.1 SGS Group
11.1.2 Bureau Veritas SA
11.1.3 UL LLC
11.1.4 Intertek
11.1.5 DEKRA SE
11.1.6 TUV SUD
11.1.7 QIMA
11.1.8 Applus+
11.1.9 United Technologies
11.1.10 Element Materials Technology
11.1.11 International Fire Consultants Group
* Business Overview, Services Offered, Recent Developments, SWOT Analysis, and MnM View Might Not Be Captured in Case of Unlisted Companies.
11.2 Right-To Win
11.3 Other Players
11.3.1 DNV GL
11.3.2 BRE Group
11.3.3 TUV Rheinland
11.3.4 Rina
11.3.5 Mistras Group, Inc
11.3.6 Premier Technical Service Group PLC (PTSG)
11.3.7 F.E. Moran Fire Protection
11.3.8 STC Group
11.3.9 Kiwa
11.3.10 Fireflow Services, Inc
11.3.11 J. Meadows Fire & Sprinkler
11.3.12 Geyer Fire
11.3.13 Impact Fire Services
12 Appendix (Page No. - 169)
12.1 Insights From Industry Experts
12.2 Discussion Guide
12.3 Knowledge Store: Marketsandmarkets’ Subscription Portal
12.4 Available Customizations
12.5 Related Report
12.6 Author Details
List of Tables (110 Tables)
Table 1 Fire Testing Market, By Service, 2016–2024 (USD Million)
Table 2 Market for Testing Services, By Region, 2016–2024 (USD Million)
Table 3 Market for Inspection Services, By Region, 2016–2024 (USD Million)
Table 4 Market for Certification Services, By Region, 2016–2024 (USD Million)
Table 5 Market for Other Services, By Region, 2016–2024 (USD Million)
Table 6 Market, By Sourcing Type, 2016–2024 (USD Million)
Table 7 In-House Fire Testing Market, By Region, 2016–2024 (USD Million)
Table 8 Outsourced Fire Testing Market, By Region, 2016–2024 (USD Million)
Table 9 Market, By Application, 2016–2024 (USD Million)
Table 10 Market for Consumer Goods and Retail, By Region, 2016–2024 (USD Million)
Table 11 Market for Consumer Goods and Retail in North America, By Country, 2016–2024 (USD Million)
Table 12 Market for Consumer Goods and Retail in Europe, By Country, 2016–2024 (USD Million)
Table 13 Market for Consumer Goods and Retail in APAC, By Country, 2016–2024 (USD Million)
Table 14 Market for Consumer Goods and Retail in RoW, By Region, 2016–2024 (USD Million)
Table 15 Market for Agriculture and Food, By Region, 2016–2024 (USD Million)
Table 16 Market for Agriculture and Food in North America, By Country, 2016–2024 (USD Million)
Table 17 Market for Agriculture and Food in Europe, By Country, 2016–2024 (USD Million)
Table 18 Fire Testing Market for Agriculture and Food in APAC, By Country, 2016–2024 (USD Million)
Table 19 Market for Agriculture and Food in RoW, By Region, 2016–2024 (USD Million)
Table 20 Market for Chemicals, By Region, 2016–2024 (USD Million)
Table 21 Market for Chemicals in North America, By Country, 2016–2024 (USD Million)
Table 22 Market for Chemicals in Europe, By Country, 2016–2024 (USD Million)
Table 23 Market for Chemicals in APAC, By Country, 2016–2024 (USD Million)
Table 24 Market for Chemicals in RoW, By Region, 2016–2024 (USD Million)
Table 25 Market for Construction and Infrastructure, By Region, 2016–2024 (USD Million)
Table 26 Market for Construction and Infrastructure in North America, By Country, 2016–2024 (USD Million)
Table 27 Market for Construction and Infrastructure in Europe, By Country, 2016–2024 (USD Million)
Table 28 Market for Construction and Infrastructure in APAC, By Country, 2016–2024 (USD Million)
Table 29 Market for Construction and Infrastructure in RoW, By Region, 2016–2024 (USD Million)
Table 30 Market for Energy & Power, By Region, 2016–2024 (USD Million)
Table 31 Market for Energy & Power in North America, By Country, 2016–2024 (USD Million)
Table 32 Fire Testing Market for Energy & Power in Europe, By Country, 2016–2024 (USD Million)
Table 33 Market for Energy & Power in APAC, By Country, 2016–2024 (USD Million)
Table 34 Market for Energy & Power in RoW, By Region, 2016–2024 (USD Million)
Table 35 Market for Industrial and Manufacturing, By Region, 2016–2024 (USD Million)
Table 36 Market for Industrial and Manufacturing in North America, By Country, 2016–2024 (USD Million)
Table 37 Market for Industrial and Manufacturing in Europe, By Country, 2016–2024 (USD Million)
Table 38 Market for Industrial and Manufacturing in APAC, By Country, 2016–2024 (USD Million)
Table 39 Market for Industrial and Manufacturing in RoW, By Region, 2016–2024 (USD Million)
Table 40 Market for Medical and Life Sciences, By Region, 2016–2024 (USD Million)
Table 41 Market for Medical and Life Sciences in North America, By Country, 2016–2024 (USD Million)
Table 42 Market for Medical and Life Sciences in Europe, Country, 2016–2024 (USD Million)
Table 43 Market for Medical and Life Sciences in APAC, By Country, 2016–2024 (USD Million)
Table 44 Market for Medical and Life Sciences in RoW, By Region, 2016–2024 (USD Million)
Table 45 Market for Mining, By Region, 2016–2024 (USD Million)
Table 46 Fire Testing Market for Mining in North America, By Country, 2016–2024 (USD Million)
Table 47 Market for Mining in Europe, By Country, 2016–2024 (USD Million)
Table 48 Market for Mining in APAC, By Country, 2016–2024 (USD Million)
Table 49 Market for Mining in RoW, By Region, 2016–2024 (USD Million)
Table 50 Market for Oil & Gas and Petroleum, By Region, 2016–2024 (USD Million)
Table 51 Market for Oil & Gas and Petroleum in North America, By Country, 2016–2024 (USD Million)
Table 52 Fire Market for Oil & Gas and Petroleum in Europe, By Country, 2016–2024 (USD Million)
Table 53 Fire Market for Oil & Gas and Petroleum in APAC, By Country, 2016–2024 (USD Million)
Table 54 Fire Market for Oil & Gas and Petroleum in RoW, By Region, 2016–2024 (USD Million)
Table 55 Market for Public Sector, By Region, 2016–2024 (USD Million)
Table 56 Market for Public Sector in North America, By Country, 2016–2024 (USD Million)
Table 57 Market for Public Sector in Europe, By Country, 2016–2024 (USD Million)
Table 58 Market for Public Sector in APAC, By Country, 2016–2024 (USD Million)
Table 59 Fire Testing Market for Public Sector in RoW, By Region, 2016–2024 (USD Million)
Table 60 Market for Automotive, By Region, 2016–2024 (USD Million)
Table 61 Market for Automotive in North America, By Country, 2016–2024 (USD Million)
Table 62 Market for Automotive in Europe, By Country, 2016–2024 (USD Million)
Table 63 Market for Automotive in APAC, By Country, 2016–2024 (USD Million)
Table 64 Market for Automotive in RoW, By Region, 2016–2024 (USD Million)
Table 65 Market for Aerospace, By Region, 2016–2024 (USD Million)
Table 66 Market for Aerospace in North America, By Country, 2016–2024 (USD Million)
Table 67 Market for Aerospace in Europe, By Country, 2016–2024 (USD Million)
Table 68 Market for Aerospace in APAC, By Country, 2016–2024 (USD Million)
Table 69 Market for Aerospace in RoW, By Region, 2016–2024 (USD Million)
Table 70 Market for Marine & Railway, By Region, 2016–2024 (USD Million)
Table 71 Market for Marine & Railway in North America, By Country, 2016–2024 (USD Million)
Table 72 Market for Marine & Railway in Europe, By Country, 2016–2024 (USD Million)
Table 73 Fire Testing Market for Marine & Railway in APAC, By Country, 2016–2024 (USD Million)
Table 74 Market for Marine & Railway in RoW, By Region, 2016–2024 (USD Million)
Table 75 Market for Supply Chain and Logistics, By Region, 2016–2024 (USD Million)
Table 76 Market for Supply Chain and Logistics in North America, By Country, 2016–2024 (USD Million)
Table 77 Market for Supply Chain and Logistics in Europe, By Country, 2016–2024 (USD Million)
Table 78 Market for Supply Chain and Logistics in APAC, By Country, 2016–2024 (USD Million)
Table 79 Market for Supply Chain and Logistics in RoW, By Region, 2016–2024 (USD Million)
Table 80 Market for Other Applications, By Region, 2016–2024 (USD Million)
Table 81 Market for Other Applications in North America, By Country, 2016–2024 (USD Million)
Table 82 Market for Other Applications in Europe, By Country, 2016–2024 (USD Million)
Table 83 Market for Other Applications in APAC, By Country, 2016–2024 (USD Million)
Table 84 Market for Other Applications in RoW, By Region, 2016–2024 (USD Million)
Table 85 Market, By Region, 2016–2024 (USD Million)
Table 86 Market in North America, By Country, 2016–2024 (USD Million)
Table 87 Market in US, By Application, 2016–2024 (USD Million)
Table 88 Fire Testing Market in Canada, By Application, 2016–2024 (USD Million)
Table 89 Market in Mexico, By Application, 2016–2024 (USD Million)
Table 90 Market in Europe, By Country, 2016–2024 (USD Million)
Table 91 Market in Germany, By Application, 2016–2024 (USD Million)
Table 92 Market in UK, By Application, 2016–2024 (USD Million)
Table 93 Market in France, By Application, 2016–2024 (USD Million)
Table 94 Market in Spain, By Application, 2016–2024 (USD Million)
Table 95 Market in Italy, By Application, 2016–2024 (USD Million)
Table 96 Market in Rest of Europe, By Application, 2016–2024 (USD Million)
Table 97 Market in APAC, By Country, 2016–2024 (USD Million)
Table 98 Market in China, By Application, 2016–2024 (USD Million)
Table 99 Market in Japan, By Application, 2016–2024 (USD Million)
Table 100 Market in India, By Application, 2016–2024 (USD Million)
Table 101 Market in South Korea, By Application, 2016–2024 (USD Million)
Table 102 Market in Australia, By Application, 2016–2024 (USD Million)
Table 103 Market in Rest of APAC, By Application, 2016–2024 (USD Million)
Table 104 Market in RoW, By Region, 2016–2024 (USD Million)
Table 105 Market in South America, By Application, 2016–2024 (USD Million)
Table 106 Market in Middle East, By Application, 2016–2024 (USD Million)
Table 107 Market in Africa, By Application, 2016–2024 (USD Million)
Table 108 Service Launches (2017–2019)
Table 109 Mergers & Acquisitions (2017–2018)
Table 110 Partnerships, Agreements, and Contracts (2017–2019)
List of Figures (43 Figures)
Figure 1 Global Fire Testing Market: Segmentation
Figure 2 Market: Research Design
Figure 3 Bottom-Up Approach to Arrive at Market Size
Figure 4 Top-Down Approach to Arrive at Market Size
Figure 5 Data Triangulation
Figure 6 Assumptions of Research Study
Figure 7 Market, By Sourcing Type, 2019 vs 2024 (USD Million)
Figure 8 Testing Services to Exhibit Largest Size for Market During 2019–2024
Figure 9 Market, By Application, 2019 vs 2024 (USD Million)
Figure 10 China to Hold Largest Size of Market in APAC
Figure 11 APAC Market to Grow at Highest CAGR During Forecast Period
Figure 12 Market in APAC to Grow at Highest CAGR During 2019–2024
Figure 13 In-House Sourcing to Witness Higher CAGR in Fire Testing Market By 2024
Figure 14 Industrial & Manufacturing to Hold Largest Share of Market in 2019
Figure 15 Construction and Infrastructure to Hold Largest Size of Market By 2024
Figure 16 Market to Witness Significant Growth in APAC During Forecast Period
Figure 17 Increasing Adoption of Safety Systems in Industries
Figure 18 Market Drivers and Their Impact
Figure 19 Market Restraints and Their Impact
Figure 20 Market Opportunities and Their Impact
Figure 21 Structure Fires in US, 2014–2018
Figure 22 Projected Construction Equipment Sales, 2015–2023
Figure 23 Market Challenges and Their Impact
Figure 24 Testing Service to Hold Largest Size of Market By 2024
Figure 25 In-House Sourcing Type to Hold Larger Size of Market By 2024
Figure 26 Construction and Infrastructure to Hold Largest Size of Market During Forecast Period
Figure 27 Global Consumer Goods and Retail Export Market Size, By Region, 2016–2024 (USD Billion)
Figure 28 Global Manufacturing Value Added Market Size, By Region, 2013–2017 (USD Trillion)
Figure 29 China to Witness Highest CAGR in Market During Forecast Period
Figure 30 North America: Market Snapshot
Figure 31 Europe: Fire Testing Market Snapshot
Figure 32 APAC: Market Snapshot
Figure 33 RoW: Market Snapshot
Figure 34 Organic and Inorganic Strategies Adopted By Companies Operating in Market
Figure 35 Major Fire Testing Service Providers
Figure 36 Market (Global) Competitive Leadership Mapping, 2018
Figure 37 SGS Group: Company Snapshot
Figure 38 Bureau Veritas SA: Company Snapshot
Figure 39 Intertek: Company Snapshot
Figure 40 DEKRA SE: Company Snapshot
Figure 41 TUV SUD: Company Snapshot
Figure 42 Applus+: Company Snapshot
Figure 43 United Technologies: Company Snapshot
The study involved 4 major activities in estimating the current size of the fire testing market. Exhaustive secondary research has been conducted to collect information about the market, the peer market, and the parent market. Validating findings, assumptions, and sizing with industry experts through primary research has been the next step. Both top-down and bottom-up approaches have been employed to estimate the total market size. After that, market breakdown and data triangulation methods have been used to estimate the market size of segments and subsegments.
Secondary Research
The research methodology used to estimate and forecast the fire testing market begins with capturing data on revenues of the key vendors in the market through secondary research. This study involves the use of extensive secondary sources, directories, and databases such as Hoovers, Bloomberg Businessweek, Factiva, and OneSource to identify and collect information useful for the technical and commercial study of the fire testing market. Moreover, secondary sources include annual reports, press releases, and investor presentations of companies; white papers, certified publications, and articles from recognized authors; directories; and databases. Secondary research has been mainly done to obtain key information about the industry’s supply chain, the total pool of key players, market classification and segmentation according to industry trends, geographic markets, and key developments from both market- and technology oriented perspectives.
Primary Research
In the primary research process, various primary sources from both supply and demand sides were interviewed to obtain the qualitative and quantitative information relevant to the market. Primary sources from the supply side include experts such as CEOs, vice presidents, marketing directors, technology and innovation directors, service providers, and related executives from various key companies and organizations operating in the ecosystem of the fire testing market.
To know about the assumptions considered for the study, download the pdf brochure
Market Size Estimation
Both top-down and bottom-up approaches have been used to estimate and validate the overall size of the fire testing market. These methods have also been used extensively to estimate the size of various market subsegments. The research methodology used to estimate the market size includes the following:
- Key players in significant applications and markets have been identified through extensive secondary research.
- The industry’s supply chain and market size, in terms of value, have been determined through primary and secondary research processes.
- All percentage shares, splits, and breakdowns have been determined using secondary sources and verified through primary sources.
Data Triangulation
After arriving at the overall market size using the estimation processes as explained above, the market was split into several segments and subsegments. To complete the overall market engineering process and arrive at the exact statistics of each market segment and subsegment, data triangulation, and market breakdown procedures have been employed, wherever applicable. The data have been triangulated by studying various factors and trends from both the demand and supply sides.
Report Objectives
- To define, analyze, and forecast the fire testing market, in terms of value based on services, sourcing type, application, and region
- To forecast the market size, in terms of value for various segments with regard to 4 main regions, namely, North America, Europe, Asia Pacific (APAC), and the Rest of the World (RoW)
- To provide detailed information regarding major factors such as drivers, restraints, opportunities, and challenges influencing the growth of the fire testing market, globally
- To analyze micromarkets with respect to individual growth trends, prospects, and contributions to the overall market
- To analyze opportunities in the market for various stakeholders by identifying high-growth segments of the market
- To profile key players and comprehensively analyze their market position in terms of their ranking and core competencies
- To provide a detailed competitive landscape for the market leaders
- To analyze competitive developments such as product/service launches & developments, acquisitions, partnerships, expansions, contracts, and agreements in the fire testing market
Available Customizations
With the given market data, MarketsandMarkets offers customizations according to the company’s specific needs. The following customization options are available for the report:
Product Analysis
- Product matrix that gives a detailed comparison of the product portfolio of each company
- Comprehensive coverage of funding/M&A activities, regulations followed in each region (North America, APAC, Europe, and RoW)
Company Information
- Detailed analysis and profiling of additional market players (up to 5)


Growth opportunities and latent adjacency in Fire Testing Market