Fish Processing Market by Category (Frozen, Preserved, Others), Species (Fish, Crustaceans, Mollusks, Others), Application (Food & Non-food), Source (Marine & Inland), Equipment, and by Region - Global Forecast to 2021


The fish processing market is projected to reach USD 222.71 Billion in terms of value by 2021, at a CAGR of 3.8% from 2016 to 2021, and is projected to reach 37,194.98 KT in terms of volume by 2021, at a CAGR of 2.2%. The objectives of the study is to define, segment, and measure the fish processing market with respect to categories, species, sources, applications, equipment, and key regional markets. They also include major factors influencing the growth of the market, strategically analyze the micromarkets, analyze opportunities for stakeholders, provide details of competitive landscape, and strategically profile the key players with respect to their market share and core competencies.
The years considered for the study are:
- Base Year � 2015
- Estimated Year � 2016
- Projected Year � 2021
- Forecast Period � 2016 to 2021
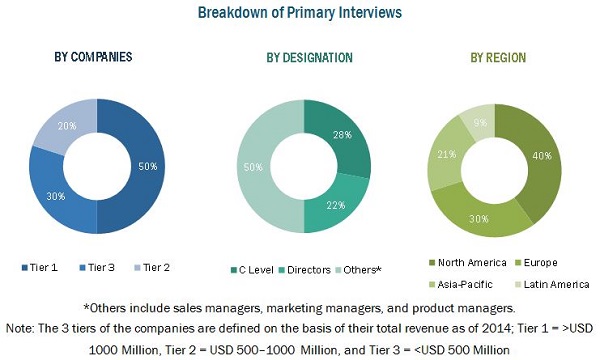
This report includes estimations of market sizes for value (USD billion) and volume (kilo tons). Both top-down and bottom-up approaches have been used to estimate and validate the size of the fish processing market and to estimate the size of various other dependent submarkets in the overall market. Key players in the market have been identified through secondary research, and their market share in respective regions has been determined through primary and secondary research. All percentage shares, splits, and breakdowns have been determined using secondary sources and were verified through primary sources.
To know about the assumptions considered for the study, download the pdf brochure
Market Ecosystem:
The various contributors involved in the value chain of fish processing include harvesters, fish sourcing suppliers, fish processors, manufacturers, logistics & distribution, marketing & sales, and end-use industries. Fish processors and manufacturers use their R&D facilities to develop a new variety or improved version of existing fish by using advanced technology to make value additions. Handling of the fish both pre- and post-processing impacts the quality of the product which then goes to the final customers. Maximum value addition of a product in the food & beverages industry is observed in the stages of fish procurement, processing, and packaging. Processed fish is used in various food applications and finds use in non-food industries such as fish meal, fish oil, cosmetics, and fertilizers.
The market is dominated by key players such as Charoen Pokphand Foods PCL (Thailand), Maruha Nichiro Corporation (Japan), Nippon Suisan Kaisha, Ltd. (Japan), Marine Harvest ASA (Norway), and Thai Union Frozen Products PLC (Thailand). Other players include Pescanova S.A. (Spain), High Liner Foods Incorporated (Canada), Royal Greenland A/S (Denmark), Leroy Seafood Group ASA (Norway), and Norway Pelagic ASA (Norway).
Target Audience:
- Raw material suppliers/harvesters
- Suppliers of fish & sea food
- Fisheries
- R&D institutes
- Pre-processors
- Processed fish & seafood manufacturers/suppliers
- Intermediary suppliers
- Wholesalers
- Retailers
- Dealers
- Consumers
- Food manufacturers
- Pharmaceutical companies
- Retailers
- Research institutes and organizations
- Government bodies, venture capitalists, and private equity firms
�The study answers several questions for stakeholders, primarily which market segments to focus on in the next two to five years for prioritizing efforts and investments.�
Scope of the Report
This research report categorizes the fish processing market based on species, category, source, application equipment type, and region.
Based on fish processing Category, the market has been segmented as follows:
- Frozen
- Preserved
- Others (which includes cured, dried, smoked, salted, and surimi)
Based on Application, the market has been segmented as follows:
- Food
- Non-food
Based on Source, the market has been segmented as follows:
- Marine
- Inland
Based on Species, the market has been segmented as follows:
- Fish
- Crustaceans
- Mollusks
- Others (which includes turtles and urchins)
Based on Equipment, the market has been segmented as follows:
- Slaughtering
- Gutting
- Scaling
- Filleting
- Deboning
- Skinning
- Curing & Smoking
- Others (which includes packing and storing machines)
Based on Region, the market has been segmented as follows:
- North America
- Europe
- Asia-Pacific
- RoW
Available Customizations
With the given market data, MarketsandMarkets offers customizations according to the client-specific needs.
The following customization options are available for the report:
Product Analysis
- Product matrix, which gives a detailed comparison of the product portfolio of each company
Application Analysis
- Application analysis, which gives a detailed analysis of feed application in fish processing
Regional Analysis
- Further breakdown of the Rest of World fish processing market into Latin American countries (Brazil, Chile, Argentina)
- Further breakdown of the Rest of Asia-Pacific fish processing market into India, South Korea, Malaysia, and other Asian countries
- Further breakdown of the RoW fish processing market into Middle-Eastern and African countries
Company Information
- Detailed analysis and profiling of additional market players (up to 5)
The global market for fish processing has been growing steadily during the last few decades. In terms of value, the market is projected to reach USD 222.71 Billion by 2021, at a CAGR of 3.8% from 2016 to 2021 and is projected to reach 37,194.98 KT in terms of volume by 2021, at a CAGR of 2.2%. Factors such as high nutritional profile and added health benefits of processed fish and fish products, growth in the aquaculture industry, and increase in health consciousness toward value-added fish products are driving the fish processing market.
The fish processing market, based on category, is segmented into frozen, preserved, and others (which includes cured, dried, smoked, salted, and surimi). The frozen segment accounted for the largest market share and the others segment (which includes cured, dried, smoked, slated, and surimi) is projected to grow at the highest CAGR during the forecast period as convenience and ready-to-cook attributes the popularity of processed fish products among the middle-aged and younger population.
The fish processing market, based on application, is segmented into food and non-food. The demand for processed fish has been increasing due to various factors such as the diversified portfolio of fish products offered by fish processors & manufacturers and changing eating habits of the population with the inclusion of fish products as a part of their daily diets.
The fish processing market, based on source of capture, is segmented into marine and inland. The marine segment is dominating the market by source due to increase in marine capture rates for both coastal and deep sea fish which are used for processing in most Asian & European countries.
The fish processing market, based on species, is segmented into fish, crustraceans, mollusks, and others (which includes turtles and urchins). The fish segment comprising majorly of whitefish, tuna, and salmon dominate the market by species. The factors which led to the growth of the market include a low-fat and high-quality protein content offered by these fishes and the ease of incorporation into food applications.
The fish processing market, based on equipment, is segmented into slaughtering, curing & smoking, gutting, skinning, scaling, filleting, deboning, and others, which include packing and storing machines. The slaughtering segment dominated the market by equipment as these equipment are corrosion-free and available with various cut types designed for a variety of fishes.
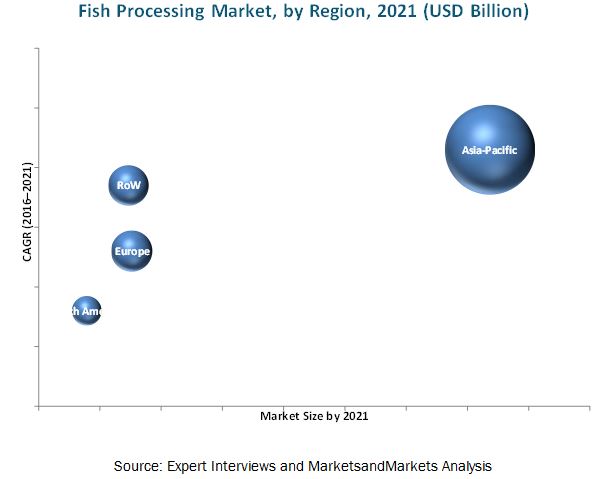
The fish processing market was dominated by the Asia-Pacific region in 2015. It is projected to be the fastest-growing market from 2016 to 2021. Economic growth and the shift of the preferences of the consumers toward value-added processed fish products have led to the market growth in this region. In Europe, countries such as Germany, U.K., France, Italy, Portugal, and Poland have shown increment in the capture rate of marine fish catering to the increased demand for processed fish products.
The increasing prices of raw materials are adversely affecting the fish processing industry. The raw materials used in fish processing are a variety of fishes and other marine products. The prices of these raw materials are rising owing to the increase in the cost of aquaculture. Feed is the main input for any aquaculture and the prices of feed are continuously increasing due to which aquaculture is costly to maintain.
The key players in this market have adopted various strategies to expand their global presence and increase their market share. Partnerships, agreements, collaborations, acquisitions, and new product launches are some of the key strategies adopted by market players to achieve growth in the global fish processing industry. The rising demand for processed fish products as well as high growth rate of fisheries and aquaculture in emerging countries has encouraged companies to adopt these strategies. Market players are focusing on entering into collaborations to share technical know-how related to biotechnology that can improve marine productivity. Charoen Pokphand Foods PCL (Thailand), Maruha Nichiro Corporation (Japan), and Nippon Suisan Kaisha, Ltd. (Japan) are some of the leading market players that adopted this strategy in order to develop their business.
To speak to our analyst for a discussion on the above findings, click Speak to Analyst
 Exclusive indicates content/data unique to MarketsandMarkets and not available with any competitors.
Table of Contents
1 Introduction (Page No. - 14)
1.1 Objectives of the Study
1.2 Market Definition
1.3 Market Scope
1.3.1 Markets Covered
1.3.2 Years Considered in the Report
1.4 Currency
1.5 Units
1.6 Stakeholders
2 Research Methodology (Page No. - 18)
2.1 Research Data
2.1.1 Secondary Data
2.1.1.1 Key Data From Secondary Sources
2.1.2 Primary Data
2.1.2.1 Key Data From Primary Sources
2.1.2.2 Breakdown of Primaries
2.2 Factor Analysis
2.2.1 Introduction
2.2.2 Overview of the Parent Industry
2.2.3 Demand-Side Analysis
2.2.3.1 Increasing Global Per Capita Consumption of Fish
2.2.3.2 Emerging Economies
2.2.4 Supply-Side Analysis
2.2.4.1 Regulatory Compliances and International Policies for Sustainable Fishing
2.3 Market Size Estimation
2.4 Market Breakdown & Data Triangulation
2.5 Market Share Estimation
2.6 Research Assumptions and Limitations
2.6.1 Assumptions
2.6.2 Limitations
3 Executive Summary (Page No. - 30)
4 Premium Insights (Page No. - 34)
4.1 Extensive Market Opportunities in the Fish Processing Market
4.2 Fish Processing Market, By Application
4.3 Asia-Pacific: the Largest Consumer of Fish Processing
4.4 Fish Processing Market, By Country
4.5 Fish Processing Species Market Size, By Region
4.6 Life Cycle Analysis, By Region
5 Market Overview (Page No. - 38)
5.1 Introduction
5.2 Market Segmentation
5.2.1 By Category
5.2.2 By Species
5.2.3 By Application
5.2.4 By Source
5.2.5 By Equipment
5.3 Market Dynamics
5.3.1 Drivers
5.3.1.1 High Nutritional Profile of Fish Products
5.3.1.2 Health Benefits of Fish
5.3.1.3 Growth in the Aquaculture Industry
5.3.1.4 Increasing Health-Consciousness
5.3.2 Restraints
5.3.2.1 Rising Prices of Raw Materials
5.3.3 Opportunities
5.3.3.1 Increasing Consumer Preference for Value Added Products
5.3.3.2 Tapping the Emerging Markets
5.3.4 Challenges
5.3.4.1 Food Safety Issues and Compliance to International Regulations
6 Industry Trends (Page No. - 46)
6.1 Introduction
6.2 Value Chain Analysis
6.3 Supply Chain Analysis
6.4 Porter�s Five Forces Analysis
6.4.1 Threat of New Entrants
6.4.2 Threat of Substitutes
6.4.3 Bargaining Power of Suppliers
6.4.4 Bargaining Power of Buyers
6.4.5 Intensity of Competitive Rivalry
7 International Regulatory Framework (Page No. - 51)
7.1 Introduction
7.2 International Import Systems for Fish and Seafood
7.3 The European Union
7.4 U.S.
7.5 Canada
7.6 Japan
7.6.1 Labeling Requirements
8 Fish Processing Market, By Category (Page No. - 59)
8.1 Introduction
8.2 Frozen
8.3 Preserved
8.4 Others
9 Fish Processing Market, By Species (Page No. - 64)
9.1 Introduction
9.2 Fish
9.3 Crustaceans
9.4 Mollusks
9.5 Others
10 Fish Processing Market, By Source (Page No. - 72)
10.1 Introduction
10.2 Marine
10.3 Inland
11 Fish Processing Market, By Application (Page No. - 77)
11.1 Introduction
11.2 Food
11.3 Non-Food
12 Fish Processing Market, By Equipment (Page No. - 82)
12.1 Introduction
12.2 Slaughtering Equipment
12.3 Gutting Equipment
12.4 Scaling Equipment
12.5 Filleting Equipment
12.6 Deboning Equipment
12.7 Skinning Equipment
12.8 Curing and Smoking Equipment
12.9 Other Equipment
13 Fish Processing Market, By Region (Page No. - 91)
13.1 Introduction
13.2 North America
13.2.1 U.S.
13.2.2 Canada
13.2.3 Mexico
13.3 Europe
13.3.1 Spain
13.3.2 France
13.3.3 U.K.
13.3.4 Poland
13.3.5 Italy
13.3.6 Germany
13.3.7 Portugal
13.3.8 Rest of Europe
13.4 Asia-Pacific
13.4.1 China
13.4.2 Japan
13.4.3 Thailand
13.4.4 Vietnam
13.4.5 Rest of Asia-Pacific
13.5 Rest of the World (RoW)
13.5.1 Latin America
13.5.2 Middle East & Africa
14 Competitive Landscape (Page No. - 126)
14.1 Overview
14.2 Competitive Situation & Trends
14.2.1 Mergers & Acquisitions
14.2.2 New Product Launches
14.2.3 Expansions & Investments
14.2.4 Agreements, Partnerships, Collaborations & Joint Ventures
15 Company Profiles (Page No. - 133)
(Company at A Glance, Recent Financials, Products & Services, Strategies & Insights, & Recent Developments)*
15.1 Introduction
15.2 Charoen Pokphand Foods PCL
15.3 Maruha Nichiro Corporation
15.4 Nippon Suisan Kaisha, Ltd.
15.5 Marine Harvest ASA
15.6 Thai Union Frozen Products Public Company Limited
15.7 Pesconova S.A.
15.8 High Liner Foods Incorporated
15.9 Royal Greenland A/S
15.10 Leroy Seafood Group ASA
15.11 Norway Pelagic ASA
*Details on Company at A Glance, Recent Financials, Products & Services, Strategies & Insights, & Recent Developments Might Not Be Captured in Case of Unlisted Companies.
16 Appendix (Page No. - 160)
16.1 Discussion Guide
16.2 Knowledge Store: Marketsandmarkets� Subscription Portal
16.3 Introducing RT: Real-Time Market Intelligence
16.4 Available Customizations
16.5 Related Reports
List of Tables (102 Tables)
Table 1 Per Capita Fish Consumption, By Region, 2000-2030 (Kg)
Table 2 Nutrient Composition in Various Species of Fish
Table 3 Comparison of Fish Import Systems in the Eu, U.S., Japan, and Canada
Table 4 New Eu Hygiene Package Regulations and Directives
Table 5 Summary of Physical Checks at Border Inspection Posts
Table 6 Japan: Regulations Applying to Fishery Products and Prepared Products
Table 7 Fish Processing Market, By Category, 2014-2021 (USD Billion)
Table 8 Frozen Fish Processing Market, By Region, 2014-2021 (USD Billion)
Table 9 Preserved Fish Processing Market, By Region, 2014-2021 (USD Billion)
Table 10 Other Fish Processing Market, By Region, 2014-2021 (USD Billion)
Table 11 Fish Processing Market, By Species, 2014-2021 (USD Billion)
Table 12 Fish Processing Market, By Species, 2014-2021 (KT)
Table 13 Fish: Fish Processing Market, By Region, 2014-2021 (USD Billion)
Table 14 Fish: Market For Fish Processing, By Region, 2014-2021 (KT)
Table 15 Crustaceans: Fish Processing Market, By Region, 2014-2021 (USD Billion)
Table 16 Crustaceans: Market For Fish Processing, By Region, 2014-2021 (KT)
Table 17 Mollusks: Fish Processing Market, By Region, 2014-2021 (USD Billion)
Table 18 Mollusks: Market For Fish Processing, By Region, 2014-2021 (KT)
Table 19 Others: Fish Processing Market, By Region, 2014-2021 (USD Billion)
Table 20 Others: Market For Fish Processing, By Region, 2014-2021 (KT)
Table 21 Marine: Fish Processing Market, By Region, 2014�2021 (USD Billion)
Table 22 Marine: Market For Fish Processing, By Region, 2014�2021 (KT)
Table 23 Inland: Fish Processing Market, By Region, 2014�2021 (USD Billion)
Table 24 Inland: Market For Fish Processing, By Region, 2014�2021 (KT)
Table 25 Food: Fish Processing Market, By Region, 2014�2021 (USD Billion)
Table 26 Food: Market For Fish Processing, By Region, 2014�2021 (KT)
Table 27 Non-Food: Fish Processing Market, By Region, 2014�2021 (USD Billion)
Table 28 Non-Food: Market For Fish Processing, By Region, 2014�2021 (KT)
Table 29 Fish Processing Equipment Market Size, By Type, 2014-2021 (USD Million)
Table 30 Slaughtering Equipment: Fish Processing Market Size, By Region,2014-2021 (USD Million)
Table 31 Gutting Equipment: Market Size For Fish Processing, By Region,2014-2021 (USD Million)
Table 32 Scaling Equipment: Fish Processing Market Size, By Region,2014-2021 (USD Million)
Table 33 Filleting Equipment: Market Size For Fish Processing, By Region,2014-2021 (USD Million)
Table 34 Deboning Equipment: Fish Processing Market Size, By Region,2014-2021 (USD Million)
Table 35 Skinning Equipment: Market Size For Fish Processing, By Region,2014-2021 (USD Million)
Table 36 Curing and Smoking Equipment: Fish Processing Market Size, By Region, 2014-2021 (USD Million)
Table 37 Other Equipment: Market Size For Fish Processing, By Region,2014-2021 (USD Million)
Table 38 Fish Processing Market Size, By Region, 2014-2021 (USD Billion)
Table 39 North America: Fish Processing Market Size, By Country,2014-2021 (USD Billion)
Table 40 North America: Fish Processing Market Size, By Species,2014-2021 (USD Billion)
Table 41 North America: Market Size For Fish Processing, By Species, 2014-2021 (KT)
Table 42 North America: Market Size For Fish Processing, By Fish,2014-2021 (USD Billion)
Table 43 North America: Market Size For Fish Processing, By Fish, 2014-2021 (KT)
Table 44 North America: Market Size For Fish Processing, By Crustaceans,2014-2021 (USD Billion)
Table 45 North America: Market Size For Fish Processing, By Crustaceans,2014-2021 (KT)
Table 46 North America: Market Size For Fish Processing, By Mollusks,2014-2021 (USD Billion)
Table 47 North America: Market Size For Fish Processing, By Mollusks, 2014-2021 (KT)
Table 48 North America: Market Size For Fish Processing, By Category,2014-2021 (USD Billion)
Table 49 North America: Market Size For Fish Processing, By Source,2014-2021 (USD Billion)
Table 50 North America: Market Size For Fish Processing, By Source, 2014-2021 (KT)
Table 51 North America: Market Size For Fish Processing, By Application,2014-2021 (USD Billion)
Table 52 North America: Market Size For Fish Processing, By Application,2014-2021 (KT)
Table 53 North America: Fish Processing Equipment Market Size, By Type,2014-2021 (USD Million)
Table 54 Europe: Fish Processing Market Size, By Country, 2014-2021 (USD Billion)
Table 55 Europe: Fish Processing Market Size, By Species, 2014-2021 (USD Billion)
Table 56 Europe: Market Size For Fish Processing, By Species, 2014-2021 (KT)
Table 57 Europe: Market Size For Fish Processing, By Fish, 2014-2021 (USD Billion)
Table 58 Europe: Market Size For Fish Processing, By Fish, 2014-2021 (KT)
Table 59 Europe: Market Size For Fish Processing, By Crustaceans,2014-2021 (USD Billion)
Table 60 Europe: Market Size For Fish Processing, By Crustaceans, 2014-2021 (KT)
Table 61 Europe: Market Size For Fish Processing, By Mollusks,2014-2021 (USD Billion)
Table 62 Europe: Market Size For Fish Processing, By Mollusks, 2014-2021 (KT)
Table 63 Europe: Market Size For Fish Processing, By Category,2014-2021 (USD Billion)
Table 64 Europe: Market Size For Fish Processing, By Source, 2014-2021 (USD Billion)
Table 65 Europe: Market Size For Fish Processing, By Source, 2014-2021 (KT)
Table 66 Europe: Market Size For Fish Processing, By Application,2014-2021 (USD Billion)
Table 67 Europe: Market Size For Fish Processing, By Application, 2014-2021 (KT)
Table 68 Europe: Fish Processing Equipment Market Size, By Type,2014-2021 (USD Million)
Table 69 Asia-Pacific: Fish Processing Market, By Country, 2014�2021 (USD Billion)
Table 70 Asia-Pacific: Fish Processing Market, By Species, 2014�2021 (USD Billion)
Table 71 Asia-Pacific: Market For Fish Processing, By Species, 2014�2021 (KT)
Table 72 Asia-Pacific: Market For Fish Processing, By Fish, 2014�2021 (USD Billion)
Table 73 Asia-Pacific: Market For Fish Processing, By Fish, 2014�2021 (KT)
Table 74 Asia-Pacific: Market For Fish Processing, By Crustacean,2014�2021 (USD Billion)
Table 75 Asia-Pacific: Market For Fish Processing, By Crustacean, 2014�2021 (KT)
Table 76 Asia-Pacific: Market For Fish Processing, By Mollusk, 2014�2021 (USD Billion)
Table 77 Asia-Pacific: Market For Fish Processing, By Mollusk, 2014�2021 (KT)
Table 78 Asia-Pacific: Market For Fish Processing, By Category,2014�2021 (USD Billion)
Table 79 Asia-Pacific: Market For Fish Processing, By Source, 2014�2021 (USD Billion)
Table 80 Asia-Pacific: Market For Fish Processing, By Source, 2014�2021 (KT)
Table 81 Asia-Pacific: Market For Fish Processing, By Application,2014�2021 (USD Billion)
Table 82 Asia-Pacific: Market For Fish Processing, By Application, 2014�2021 (KT)
Table 83 Asia-Pacific: Fish Processing Equipment Market Size, By Type,2014�2021 (USD Million)
Table 84 RoW: Fish Processing Market, By Country, 2014�2021 (USD Billion)
Table 85 RoW: Fish Processing Market, By Species, 2014�2021 (USD Billion)
Table 86 RoW: Market For Fish Processing, By Species, 2014�2021 (KT)
Table 87 RoW: Market For Fish Processing, By Fish, 2014�2021 (USD Billion)
Table 88 RoW: Market For Fish Processing, By Fish, 2014�2021 (KT)
Table 89 RoW: Market For Fish Processing, By Crustacean, 2014�2021 (USD Billion)
Table 90 RoW: Market For Fish Processing, By Crustacean, 2014�2021 (KT)
Table 91 RoW: Market For Fish Processing, By Mollusk, 2014�2021 (USD Billion)
Table 92 RoW: Market For Fish Processing, By Mollusk, 2014�2021 (KT)
Table 93 RoW: Market For Fish Processing, By Category, 2014�2021 (USD Billion)
Table 94 RoW: Market For Fish Processing, By Source, 2014�2021 (USD Billion)
Table 95 RoW: Market For Fish Processing, By Source, 2014�2021 (KT)
Table 96 RoW: Market For Fish Processing, By Application,2014�2021 (USD Billion)Billion)
Table 97 RoW: Market For Fish Processing, By Application, 2014�2021 (KT)
Table 98 RoW : Fish Processing Equipment Market Size, By Type,2014�2021 (USD Million)
Table 99 Mergers & Acquisitions, 2010�2016
Table 100 New Product Launches, 2010�2016
Table 101 Expansions & Investments, 2010�2016
Table 102 Agreements, Partnerships, Collaborations & Joint Ventures, 2010�2016
List of Figures (60 Figures)
Figure 1 Fish Processing Market Segmentation
Figure 2 Fish Processing Market: Research Design
Figure 3 Impact of Key Factors Influencing the Parent Industry
Figure 4 Key Economies Based on Gdp (Ppp), 2015 (USD Billion)
Figure 5 Market Size Estimation Methodology: Bottom-Up Approach
Figure 6 Market Size Estimation Methodology: Top-Down Approach
Figure 7 Data Triangulation Methodology
Figure 8 Assumptions of the Research Study
Figure 9 Limitations of the Research Study
Figure 10 Fish Processing Market Snapshot (2016 vs. 2021): Non-Food Segment is Projected to Grow Rapidly During the Forecast Period
Figure 11 Fish Processing Market Snapshot (2016 vs. 2021): Frozen Segment is Projected to Grow Rapidly During the Forecast Period
Figure 12 Fish Processing Market Share (Value), By Region, 2015
Figure 13 Mergers & Acquisitions: the Key Strategy
Figure 14 A Prospective Market With Robust Growth Potential, 2016�2021
Figure 15 Applications for Processed Fish as Food for Human Consumption Dominates the Market
Figure 16 Frozen Fish: Largest Market for Processed Fish in Asia-Pacific
Figure 17 Countries Such as Portugal, Italy, China, Thailand and Vietnam Showing Great Potential for Processed Fish Products, 2016�2021
Figure 18 Asia-Pacific Dominant Market for All Processed Fish Species in 2016
Figure 19 Asia-Pacific in High Growth Phase With A Promising Future, 2016
Figure 20 Market Segmentation For Fish Processing, By Category
Figure 21 Market Segmentation For Fish Processing, By Species
Figure 22 Fish Processing Market: Drivers, Restraints, Opportunities, Challenges
Figure 23 Potential Effects of Fish Components on Human Health
Figure 24 Value Chain Analysis: Fish Processing
Figure 25 Supply Chain Analysis: Fish Processing
Figure 26 Porter�s Five Forces Analysis: Fish Processing Market
Figure 27 Frozen Segment Would Dominate the Fish Processing Market,By Category, in 2016
Figure 28 Asia-Pacific Would Dominate Frozen Segment in 2016
Figure 29 Fish Processing Market, By Species, 2016 vs. 2021 (USD Billion)
Figure 30 Asia-Pacific is Estimated to Dominate the Fish Segment in 2016
Figure 31 Marine Segment Expected to Dominate the Fish Processing MarketIn 2016
Figure 32 Asia-Pacific is Expected to Dominate the Marine Segment ThroughoutThe Forecast Period (2016-2021)
Figure 33 Food Segment is Expected to Dominated the Fish Processing MarketIn 2016
Figure 34 Asia-Pacific is Expected to Dominate the Food Segment in 2016
Figure 35 Slaughtering Segment is Expected to Dominate the Fish Processing Market in 2016
Figure 36 North America Would Dominate the Slaughtering Segment in 2016
Figure 37 Geographic Snapshot : Markets in Asia-Pacific are Emerging as New Hotspots
Figure 38 North American Fish Processing Market Snapshot
Figure 39 European Fish Processing Market Snapshot
Figure 40 Asia-Pacific Fish Processing Marketsnapshot
Figure 41 Key Companies Preferred Strategy of Partnerships, Agreements,Collaborations, and Acquisitions From 2010 to 2016
Figure 42 Fish Processing Market Share, By Key Player, 2015
Figure 43 Key Players Extensively Adopted Agreements, Partnerships, and Collaborations to Fuel Growth of the Fish Processing Market From 2010 to 2015
Figure 44 Annual Developments in the Global Fish Processing Market, 2010�2015
Figure 45 Geographical Revenue Mix of Top Five Market Players
Figure 46 Charoen Pokphand Foods PCL: Company Snapshot
Figure 47 Charoen Pokphand Foods PCL: SWOT Analysis
Figure 48 Maruha Nichiro Corporation: Company Snapshot
Figure 49 Maruha Nichiro Corporation: SWOT Analysis
Figure 50 Nippon Suisan Kaisha, Ltd.: Company Snapshot
Figure 51 Nippon Suisan Kaisha, Ltd.: SWOT Analysis
Figure 52 Marine Harvest ASA: Company Snapshot
Figure 53 Marine Harvest ASA: SWOT Analysis
Figure 54 Thai Union Frozen Products Public Company Limited: Company Snapshot
Figure 55 Thai Union Frozen Products Public Company Limited: SWOT Analysis
Figure 56 Pescanova S.A.: Company Snapshot
Figure 57 High Liner Foods Incorporated: Company Snapshot
Figure 58 Royal Greenland A/S: Company Snapshot
Figure 59 Leroy Seafood Group ASA: Company Snapshot
Figure 60 Norway Pelagic ASA: Company Snapshot


Growth opportunities and latent adjacency in Fish Processing Market