Aquafeed Market

Aquafeed Market by Species (Fish, Crustaceans, and Mollusks), Ingredient (Soybean, Corn, Fishmeal, Fish Oil, and Additives), Lifecycle (Starter Feed, Grower Feed, Finisher Feed, and Brooder Feed), Form, Additive and Region - Global Forecast to 2028

Report Code: AGI 2681 Jul, 2023, by marketsandmarkets.com

Aquafeed Market Size, Share, and Revenue Forecast

The global aquafeed market is projected to reach USD 88.0 billion by 2028, at a CAGR of 7.3% over the forecast period. It is estimated to be valued USD 61.8 billion in 2023.

Several important factors are driving up demand for aquafeed products on a global scale. First, a growing worldwide population has an increased need for seafood, and aquaculture offers a sustainable way to meet this demand. Fish and prawn farming has become more popular because of the depletion of wild fish stocks. Aquafeed is crucial for the healthy growth and development of aquaculture aquatic species, increasing their output and decreasing their reliance on foraging wild fish. Aquafeed products are in high demand to support the expansion of the business since advances in aquaculture technology and practises have made it more effective and financially viable.

Aquafeed Market

To know about the assumptions considered for the study, Request for Free Sample Report

Aquafeed Market

To know about the assumptions considered for the study, download the pdf brochure

Aquafeed Market Dynamics

Driver: Increase in consumption of fish

In recent years, there has been a significant increase in fish consumption worldwide. As people become more health-conscious and aware of the nutritional benefits of fish, it has become a popular choice for many individuals and families. One of the main reasons for the rise in fish consumption is the recognition of fish as a rich source of high-quality protein, omega-3 fatty acids, vitamins, and minerals. These nutrients are essential for maintaining a balanced diet and promoting overall well-being. Moreover, fish is often considered a healthier alternative to red meat due to its lower saturated fat content.

Another contributing factor to the increased demand for fish is the growing awareness of the environmental impact of meat production. As concerns about climate change and sustainability rise, more people are opting for fish as a more environmentally friendly protein source. Compared to land-based livestock farming, fish farming generally has a lower carbon footprint and requires fewer resources such as land and water. Additionally, advancements in technology and transportation have made fish more accessible to a wider range of consumers. Improved cold chain logistics and efficient global trade networks enable the availability of various fish species throughout the year, regardless of geographical location. This accessibility has opened up new culinary experiences and expanded the choices for seafood lovers.

Fishmeal is primarily used in animal diets, particularly for farmed fish. By 2030, it is estimated that 85% of fishmeal will be consumed by the aquaculture sector as feed. China, being the largest producer of aquaculture, will be the largest consumer of fishmeal, accounting for 38% of global fishmeal consumption by 2030. The consumption of fish oil is characterized by competition between the aquaculture industry and dietary supplements for human consumption. By 2030, 66% of fish oil is projected to be used as feed for farmed fish, particularly salmon. The European Union and Norway will remain the main consumers of fish oil, representing 16% and 14% of the world total, respectively, by 2030. Thus the expanding consumption of fish across different applications is a key contributing factor behind the surge in the aquafeed market.

Restraint: Lack of awareness about modern feeding methods in developing countries

The lack of awareness about modern feeding methods in developing countries can indeed be a restraint for the aquafeed market. Aquaculture, which is the farming of fish and other aquatic organisms, has become an increasingly important industry worldwide to meet the growing demand for seafood. However, the success of aquaculture largely depends on the availability and quality of aquafeed, which is the primary source of nutrition for farmed fish.

In many developing countries, traditional feeding methods are still prevalent due to a lack of knowledge and awareness about modern aquafeed practices. Farmers may rely on low-quality feeds or even household waste, which can result in inadequate nutrition for the farmed fish. This can lead to slower growth rates, higher mortality rates, and lower overall productivity of aquaculture operations.

Modern aquafeed formulations are designed to provide balanced nutrition for specific species of fish, promoting healthy growth and efficient feed conversion. These feeds often contain a combination of proteins, carbohydrates, fats, vitamins, and minerals tailored to meet the nutritional requirements of farmed fish at different stages of their life cycle. To overcome the restraint of lack of awareness, it is crucial to focus on educational initiatives and knowledge transfer programs in developing countries. These initiatives can include training programs for fish farmers, extension services, and collaborations with research institutions and international organizations. By providing farmers with information about the benefits of using modern aquafeed and demonstrating its effectiveness through field trials, awareness can be raised, and adoption of improved feeding practices can be encouraged. Additionally, it is essential to address the affordability and availability of quality aquafeed in developing countries. Cost-effective and locally sourced feed ingredients should be identified and promoted to make modern aquafeed more accessible to small-scale farmers.

Opportunity: Growth in support from governments

The aquaculture industry is growing due to the various initiatives taken by the governments of the respective countries, globally. In India, the Ministry of Agriculture is responsible for the planning, monitoring, and funding of centrally sponsored developmental schemes related to fisheries and aquaculture in all Indian states. It provides an opportunity for the aquaculture industry of India to focus on enhancing the aquaculture sector in the country.

Governments promote aquaculture through education and capacity building initiatives. They offer training programs and workshops to enhance the skills and knowledge of aquaculture farmers, enabling them to adopt best practices and improve productivity. Governments also facilitate the exchange of information and knowledge sharing among industry stakeholders, promoting innovation and collaboration. For instance, The European Union (EU) and the Food and Agriculture Organization (FAO) have been providing support to the Georgian government in the development of the National Aquaculture Development Strategy. The workshop aimed to initiate discussions among various stakeholders involved in aquaculture in Georgia, focusing on extensive aquaculture, mariculture, and fish farming. The objective was to support the formulation of the National Aquaculture Development Strategy of Georgia.

Challenge: Growth in environmental and human health concerns

One of the major environmental concerns associated with aquaculture is water pollution. Intensive farming practices can lead to the accumulation of excess nutrients, such as nitrogen and phosphorous, in the surrounding waters. These nutrients can cause eutrophication, leading to harmful algal blooms, oxygen depletion, and damage to aquatic ecosystems. Additionally, uneaten feed and waste from farmed fish can further contribute to water pollution, affecting the quality of both the local marine and freshwater environments. The establishment of fish farms often requires the conversion of natural coastal areas and wetlands, resulting in the loss of important habitats for various species. Furthermore, the physical structures and equipment used in aquaculture operations can damage or destroy sensitive ecosystems such as seagrass beds, coral reefs, and mangroves. These habitats play crucial roles in supporting biodiversity and providing essential ecosystem services, making their destruction a matter of significant concern.

To address these environmental concerns, governments and regulatory bodies have implemented stricter regulations and sustainability requirements for aquaculture operations. These measures aim to mitigate the industry's negative impacts and promote more sustainable practices. For instance, regulations may set limits on the amount of nutrients that can be released into the surrounding waters, and farms may be required to implement waste management systems to minimize pollution. For example, Regulation (EC) No.: 1831/2003 on additives for use in animal nutrition. This regulation establishes rules for the authorization and use of feed additives, including those used in aquafeed, within the EU. Another example, The Norwegian Food Safety Authority regulates aquaculture, including the use of feed, to ensure food safety and environmental sustainability.

Aquafeed Market Ecosystem

Prominent companies in this market include well-established, financially stable manufacturers of aquafeed. These companies have been operating in the market for several years and possess a diversified product portfolio, state-of-the-art, and strong global sales and marketing networks. Prominent companies in this market include ADM (US), Cargill, Incorporated (US), Ridley Corporation Limited (Australia), Nutreco (Netherlands), Alltech (US), Purina Animal Nutrition (US), Adisseo (Belgium), Aller Aqua A/S (Denmark), Biomin (Austria), Biomar (Denmark), Norel Animal Nutrition (Spain), Avanti Feeds Limited (India), De Heus Animal Nutrition B.V. (Netherlands), Novus International (US), and Biostadt India Limited (India).

Aquafeed Market

By ingredients, soybean segment is projected to have the largest share during the forecast period.

Soybeans are among the non-fish sources of omega-3 fatty acids, proteins, and unsaturated fats. Soy protein is fed to farm-reared fish and shellfish to enhance their overall growth and development. Some of the commonly used soybean products in aquafeed include heat-processed full-fat soybean, mechanically extracted soybean cake, solvent-extracted soybean meal, and dehulled solvent-extracted soybean meal. Soybean isolates and different varieties of genetically modified soybeans are being introduced to replace fishmeal, which is a rich source of amino acids.

By form, dry segment is projected to have fastest growing rate during the forecast period.

Dry form of feed is preferred due to a few factors, such as ease of transportation, storage, and convenience associated with it, as opposed to the liquid form, which requires specialized facilities for storage and transportation. It can be purchased in bulk and is available with multiple ingredient options. Cost-effectiveness is another aspect that drives the growth of this market.

By species, fish segment is projected to have fastest growing rate during the forecast period.

In the aquafeed market, the fish segment is expanding for a variety of reasons. The need for high-quality and nutritionally balanced aquafeed is being driven by the increasing demand for fish protein on a global scale, the depletion of wild fish supplies, and the growth of aquaculture. To ensure optimum development, health, and sustainability in the sector, fish farming, with its well-established practises and different species, needs specialised feeds.

By lifecycle, grower segment is projected to have fastest growing rate during the forecast period.

Due to the growing demand for specialised feeds to support the growth and development of aquatic species raised for food, the grower section of the aquafeed industry is expanding. The demand for feeds that meet the unique nutritional needs of developing fish and prawns is increasing as aquaculture production scales up. This enables effective feed conversion, enhanced growth rates, and overall farm profitability.

By additives, amino acids segment is projected to have fastest growing rate during the forecast period.

Due to their vital function in fostering the growth, development, and general health of aquatic species, amino acids are witnessing expansion in the aquafeed market. As the building blocks of proteins, amino acids help to improve nutrient absorption, feed effectiveness, and disease resistance. Additionally, customised amino acid formulations suited to match the needs of particular species are now possible because to advances in research and technology, which are fuelling the segment's expansion.

Asia Pacific is expected to have the fastest growing rate during the forecast period.

The aquafeed market is expanding in the Asia Pacific region because of reasons like a growing population, rising seafood demand, favourable environmental conditions for aquaculture, technical improvements, and government backing. The expansion of the aquaculture sector is being fuelled by economic growth, shifting dietary tastes, and the need for sustainable protein sources, which is causing a commensurate rise in demand for aquafeed products.

Asia Pacific is Expected to Have Fastest Growing Rate During the Forecast Period

Aquafeed Market by Region

Key Market Players

The key players in this include ADM (US), Cargill, Incorporated (US), Ridley Corporation Limited (Australia), Nutreco (Netherlands), Alltech (US), Purina Animal Nutrition (US), Adisseo (Belgium), Aller Aqua A/S (Denmark), Biomin (Austria), Biomar (Denmark), Norel Animal Nutrition (Spain), Avanti Feeds Limited (India), De Heus Animal Nutrition B.V. (Netherlands), Novus International (US), and Biostadt India Limited (India). These companies have been focusing on expanding their market presence, enhancing their solutions, and partnering with many channel partners and technology companies to cater to consumers across the globe. The deep roots of these players in the market and their robust offerings are among the major factors that have helped them achieve major sales and revenues in the global aquafeed market.

Get online access to the report on the World's First Market Intelligence Cloud

  • Easy to Download Historical Data & Forecast Numbers
  • Company Analysis Dashboard for high growth potential opportunities
  • Research Analyst Access for customization & queries
  • Competitor Analysis with Interactive dashboard
  • Latest News, Updates & Trend analysis
Request Sample

Scope of the Report

Report Metric

Details

Market size value in 2023

USD 61.8 billion

Revenue forecast in 2028

USD 88.0 billion

Growth Rate

CAGR of 7.3% from 2023 to 2028

Base year considered

2022

Forecast period considered

2023–2028

Units considered

Value (USD) and Volume (KT)

Segments covered

Species, Additives, Form, Lifecycle, Ingredients, and Region

Regions covered

North America, Europe, Asia Pacific, South America and RoW

Key companies profiled

  • ADM (US)
  • Cargill, Incorpoarted (US)
  • Ridley Corporation Limited (Australia)
  • Nutreco (Netherlands)
  • Alltech (US)
  • Purina Animal Nutrition (US)
  • Adisseo (Belgium)
  • Aller Aqua A/S (Denmark)
  • Biomin (Austria)
  • Biomar (Denmark)
  • Norel Animal Nutrition (Spain)
  • Avanti Feeds Limited (India)
  • De Heus Animal Nutrition B.V (Netherlands)
  • Novus International (US)
  • Biostadt India Limited (India)
  • The Waterbase Limited (india)
  • Marubein Nisshin Feed Co., Ltd (Japan)
  • Marvesa (Netherlands)
  • Beneo (Germany)
  • Japfa Comfeed (Indonesia)
  • CPF PLC (Thailand)
  • Growel Feeds (India)
  • Sonac (Netherlands)
  • Kent Feeds (US)
  • LifeCircle Nutrition (Switzerland)

This research report categorizes the aquafeed market based on species, additives, form, lifecycle, ingredients, and region.

By Ingredient
  • Soybean
  • Corn
  • Fishmeal
  • Fish Oil
  • Additives
  • Other types
By Additives
  • Antibiotics
  • Vitamins & minerals
  • Antioxidants
  • Amino acids
  • Enzymes
  • Probiotics & prebiotics
  • Other types
Aquafeed Market, By Species
  • Fish
    • Tilapia
    • Salmon
    • Carp
    • Trout
    • Others
  • Crustaceans
    • Crabs
    • Krill
    • Shrimp
    • Others
  • Crustaceans
    • Oysters
    • Mussels
    • Others
  • Others
By Form
  • Dry
  • Moist
  • Wet
By Lifecycle
  • Starter feed
  • Grower feed
  • Finisher feed
  • Brooder feed
By Region
  • North America
  • Europe
  • Asia Pacific
  • South America
  • Rest of the World

Aquafeed Market Recent Developments

  • In November 2022, De Heus opened a fourth production facility in Indonesia. De Heus is strengthening the future entrepreneurship in livestock and aquaculture. They are supporting independent breeders, fish, and shrimp farmers in Indonesia. This expansion will help De Hues to increase production for aquafeed in Indonesia.
  • In June 2022, Avanti Feeds expanded its feed production facility for shrimp feeds. With an installed capacity of 1,75,000 MT per annum this expansion will help Avanti Feeds to increase production for aquafeed in India.
  • In November 2021, Ridley partnered with Australian Prawn Farms, based in Mackay, to successfully complete a commercial-scale trial of a ground-breaking prawn feed that uses no marine resources. The feed contains a microbial biomass component called Novacq that is manufactured from plant and animal raw materials.  With this Ridely is strengthening its position in Australia and has no marine resources in the feed.
  • In May 2021, Cargill established a new web platform called MyEWOS to provide aquaculture producers with news, product information, and events. Aquaculture farmers may discover current information that highlights the company's products, services, events, promotions, and news on the website due to its user-friendly and intuitive design.
  • In June 2020, ADM animal nutrition’ aquaculture brand, Ocialis, launched a new brand identity in Asia Pacific region as part of its long-term strategy to strengthen its industrial and commercial footprint, in addition to consolidating its position as a leading aquaculture player in the Asia Pacific region. The move also reflects the company’s investment in developing Ocialis as a global provider of aquaculture solutions and aquafeed products.

Frequently Asked Questions (FAQ):

To speak to our analyst for a discussion on the above findings, click Speak to Analyst

TABLE OF CONTENTS
 
1 INTRODUCTION (Page No. - 25)
    1.1 STUDY OBJECTIVES 
    1.2 MARKET DEFINITION 
    1.3 STUDY SCOPE 
           FIGURE 1 MARKET SEGMENTATION
           1.3.1 REGIONS COVERED
           1.3.2 INCLUSIONS & EXCLUSIONS
           1.3.3 YEARS CONSIDERED
    1.4 CURRENCY CONSIDERED 
           TABLE 1 USD EXCHANGE RATES, 2018–2022
    1.5 STAKEHOLDERS 
    1.6 SUMMARY OF CHANGES 
           1.6.1 RECESSION IMPACT ANALYSIS
 
2 RESEARCH METHODOLOGY (Page No. - 31)
    2.1 RESEARCH DATA 
           FIGURE 2 AQUAFEED MARKET: RESEARCH DESIGN
           2.1.1 SECONDARY DATA
                    2.1.1.1 Key data from secondary sources
           2.1.2 PRIMARY DATA
                    2.1.2.1 Key data from primary sources
                    2.1.2.2 Key industry insights
                    2.1.2.3 Breakdown of primaries
    2.2 MARKET SIZE ESTIMATION 
           2.2.1 APPROACH ONE: TOP-DOWN
                    FIGURE 3 AQUAFEED MARKET SIZE ESTIMATION – TOP-DOWN APPROACH
           2.2.2 APPROACH TWO: BOTTOM-UP
                    FIGURE 4 AQUAFEED MARKET SIZE ESTIMATION – BOTTOM-UP APPROACH
           2.2.3 AQUAFEED MARKET SIZE ESTIMATION: SUPPLY SIDE
                    FIGURE 5 AQUAFEED MARKET SIZE ESTIMATION (SUPPLY SIDE)
           2.2.4 AQUAFEED MARKET SIZE ESTIMATION: DEMAND SIDE
                    FIGURE 6 AQUAFEED MARKET SIZE ESTIMATION (DEMAND SIDE)
    2.3 DATA TRIANGULATION 
           FIGURE 7 DATA TRIANGULATION METHODOLOGY
    2.4 RESEARCH ASSUMPTIONS & LIMITATIONS 
           2.4.1 ASSUMPTIONS
                    TABLE 2 ASSUMPTIONS
    2.5 RESEARCH LIMITATIONS & ASSOCIATED RISKS 
    2.6 RECESSION IMPACT ON AQUAFEED MARKET 
           2.6.1 MACRO INDICATORS OF RECESSION
                    FIGURE 8 INDICATORS OF RECESSION
                    FIGURE 9 WORLD INFLATION RATE: 2011-2021
                    FIGURE 10 GLOBAL GDP: 2011-2021 (USD TRILLION)
                    FIGURE 11 RECESSION INDICATORS AND THEIR IMPACT ON AQUAFEED MARKET
                    FIGURE 12 GLOBAL AQUAFEED MARKET: EARLIER FORECAST VS. RECESSION FORECAST
 
3 EXECUTIVE SUMMARY (Page No. - 46)
    TABLE 3 AQUAFEED MARKET SNAPSHOT (VALUE), 2023 VS. 2028 
    FIGURE 13 AQUAFEED MARKET SIZE, BY INGREDIENT, 2023 VS. 2028 (USD MILLION) 
    FIGURE 14 MARKET SIZE, BY LIFECYCLE, 2023 VS. 2028 (USD MILLION) 
    FIGURE 15 MARKET SIZE, BY FORM, 2023 VS. 2028 (USD MILLION) 
    FIGURE 16 MARKET SIZE, BY ADDITIVE, 2023 VS. 2028 (USD MILLION) 
    FIGURE 17 MARKET SIZE, BY SPECIES, 2023 VS. 2028 (USD MILLION) 
    FIGURE 18 MARKET SHARE (VALUE), BY REGION, 2022 
 
4 PREMIUM INSIGHTS (Page No. - 52)
    4.1 BRIEF OVERVIEW OF AQUAFEED MARKET 
           FIGURE 19 INCREASING TRADE OF SEAFOOD TO PROPEL MARKET GROWTH
    4.2 ASIA PACIFIC: AQUAFEED MARKET, BY INGREDIENT AND COUNTRY 
           FIGURE 20 CHINA ACCOUNTED FOR LARGEST SHARE IN 2022
    4.3 AQUAFEED MARKET, BY LIFECYCLE AND REGION, 2022 
           FIGURE 21 GROWER SEGMENT TO DOMINATE MARKET DURING FORECAST PERIOD
    4.4 AQUAFEED MARKET, BY FORM 
           FIGURE 22 DRY FORM DOMINATED MARKET IN 2022
    4.5 AQUAFEED MARKET: MAJOR REGIONAL SUBMARKETS 
           FIGURE 23 CHINA DOMINATED MARKET IN 2022
 
5 MARKET OVERVIEW (Page No. - 55)
    5.1 INTRODUCTION 
           FIGURE 24 GLOBAL POPULATION, 2010-2021
    5.2 MARKET DYNAMICS 
           FIGURE 25 AQUAFEED MARKET: DRIVERS, RESTRAINTS, OPPORTUNITIES,  AND CHALLENGES
           5.2.1 DRIVERS
                    5.2.1.1 Growth in aquaculture industry
                               TABLE 4 GLOBAL AQUACULTURE PRODUCTION, 2013–2018 (MILLION TONNES)
                    5.2.1.2 Rise in seafood trade to propel demand
                    5.2.1.3 Increase in consumption of fish
           5.2.2 RESTRAINTS
                    5.2.2.1 Lack of awareness about modern feeding methods in developing countries
           5.2.3 OPPORTUNITIES
                    5.2.3.1 Growth in support from governments
                    5.2.3.2 Development of innovative products as source of protein
           5.2.4 CHALLENGES
                    5.2.4.1 Growth in environmental and human health concerns
                    5.2.4.2 Disease outbreaks and disease prevention measures
 
6 INDUSTRY TRENDS (Page No. - 63)
    6.1 INTRODUCTION 
    6.2 VALUE CHAIN ANALYSIS 
           6.2.1 RESEARCH AND DEVELOPMENT
           6.2.2 PROCUREMENT
           6.2.3 MANUFACTURING/PRODUCTION
           6.2.4 DISTRIBUTION
           6.2.5 MARKETING AND SALES
           6.2.6 END USER
                    FIGURE 26 AQUAFEED MARKET: VALUE CHAIN ANALYSIS
    6.3 PRICING ANALYSIS: AQUAFEED MARKET, BY INGREDIENT 
           TABLE 5 AVERAGE SELLING PRICE, BY INGREDIENT, 2018–2022 (USD/KT)
    6.4 ECOSYSTEM MAP 
           6.4.1 AQUAFEED MARKET: ECOSYSTEM VIEW
           6.4.2 AQUAFEED MARKET MAP
                    6.4.2.1 Upstream
                               6.4.2.1.1 Aquafeed manufacturers
                               6.4.2.1.2 Raw material providers
                               6.4.2.1.3 Academia and research institutes
                    6.4.2.2 Downstream
                               6.4.2.2.1 Retailers and distributors
    6.5 TRENDS/DISRUPTIONS IMPACTING CONSUMER’S BUSINESS 
           FIGURE 27 REVENUE SHIFT FOR AQUAFEED MARKET
    6.6 PATENT ANALYSIS 
           FIGURE 28 REGIONAL ANALYSIS OF PATENTS GRANTED
           FIGURE 29 ANALYSIS OF PATENTS GRANTED, 2012–2022
           TABLE 6 KEY PATENTS PERTAINING TO DISINFECTANTS IN LIVESTOCK, 2022–23
    6.7 TRADE ANALYSIS 
           TABLE 7 KEY EXPORTING COUNTRIES OF AQUAFEED, 2022 (USD MILLION)
           FIGURE 30 AQUAFEED EXPORT, BY KEY COUNTRY, 2018–2022 (USD MILLION)
           TABLE 8 KEY IMPORTING COUNTRIES OF AQUAFEED, 2022 (USD MILLION)
           FIGURE 31 AQUAFEED IMPORT, BY KEY COUNTRY, 2018–2022 (USD MILLION)
    6.8 TARIFF AND REGULATORY LANDSCAPE 
           6.8.1 REGULATORY BODIES, GOVERNMENT AGENCIES, AND OTHER ORGANIZATIONS
                    TABLE 9 NORTH AMERICA: LIST OF REGULATORY BODIES, GOVERNMENT AGENCIES,  AND OTHER ORGANIZATIONS
                    TABLE 10 EUROPE: LIST OF REGULATORY BODIES, GOVERNMENT AGENCIES,  AND OTHER ORGANIZATIONS
                    TABLE 11 ASIA PACIFIC: LIST OF REGULATORY BODIES, GOVERNMENT AGENCIES,  AND OTHER ORGANIZATIONS
                    TABLE 12 SOUTH AMERICA: LIST OF REGULATORY BODIES, GOVERNMENT AGENCIES,  AND OTHER ORGANIZATIONS
    6.9 REGULATORY FRAMEWORK 
           6.9.1 INTRODUCTION
           6.9.2 NORTH AMERICA
                    6.9.2.1 US
                    6.9.2.2 Canada
                    6.9.2.3 Mexico
           6.9.3 EUROPE
           6.9.4 ASIA PACIFIC
                    6.9.4.1 China
           6.9.5 JAPAN
                    6.9.5.1 India
                    6.9.5.2 Australia
           6.9.6 SOUTH AMERICA
                    6.9.6.1 Brazil
    6.10 TECHNOLOGY ANALYSIS 
           6.10.1 NUTRIENT ENCAPSULATION
           6.10.2 3 D PRINTING
    6.11 PORTER’S FIVE FORCES ANALYSIS 
                    TABLE 13 AQUAFEEDS MARKET: PORTER’S FIVE FORCES ANALYSIS
           6.11.1 INTENSITY OF COMPETITIVE RIVALRY
           6.11.2 BARGAINING POWER OF SUPPLIERS
           6.11.3 BARGAINING POWER OF BUYERS
           6.11.4 THREAT OF SUBSTITUTES
           6.11.5 THREAT OF NEW ENTRANTS
    6.12 KEY STAKEHOLDERS & BUYING CRITERIA 
           6.12.1 KEY STAKEHOLDERS IN BUYING PROCESS
                    FIGURE 32 INFLUENCE OF STAKEHOLDERS ON BUYING PROCESS
                    TABLE 14 INFLUENCE OF STAKEHOLDERS IN BUYING PROCESS FOR TOP THREE  TYPES OF AQUAFEED (%)
           6.12.2 BUYING CRITERIA
                    FIGURE 33 KEY BUYING CRITERIA FOR SPECIES
                    TABLE 15 KEY BUYING CRITERIA FOR TOP THREE TYPES OF AQUAFEED
    6.13 CASE STUDY 
           6.13.1 AVANTI FEEDS LIMITED: REVOLUTIONIZING AQUAFEED INDUSTRY  IN INDIA
                    TABLE 16 REVOLUTIONIZING INDIA'S AQUAFEED INDUSTRY: AVANTI FEEDS LIMITED'S COLLABORATIVE APPROACH AND TECHNOLOGICAL ADVANCEMENTS
 
7 AQUAFEED MARKET, BY ADDITIVE (Page No. - 93)
    7.1 INTRODUCTION 
           FIGURE 34 AQUAFEED MARKET SIZE, BY ADDITIVE, 2023 VS. 2028 (USD MILLION)
           TABLE 17 MARKET, BY ADDITIVE, 2018–2022 (USD MILLION)
           TABLE 18 MARKET, BY ADDITIVE, 2023–2028 (USD MILLION)
    7.2 AMINO ACIDS 
           7.2.1 AMINO ACIDS TO OVERCOME DIETARY DEFICIENCIES AND DRIVE GROWTH
                    TABLE 19 AMINO ACIDS: AQUAFEED MARKET, BY REGION, 2018–2022 (USD MILLION)
                    TABLE 20 AMINO ACIDS: MARKET, BY REGION, 2023–2028 (USD MILLION)
    7.3 VITAMINS & MINERALS 
           7.3.1 VITAMINS TO AID IN MAINTAINANCE OF AQUATIC ANIMALS AND BOOST GROWTH
                    TABLE 21 VITAMINS & MINERALS: AQUAFEED MARKET, BY REGION, 2018–2022 (USD MILLION)
                    TABLE 22 VITAMINS & MINERALS: MARKET, BY REGION, 2023–2028 (USD MILLION)
    7.4 PREBIOTICS & PROBIOTICS 
           7.4.1 PROBIOTICS & PREBIOTICS TO REGULATE GUT HEALTH OF AQUATIC ANIMALS AND DRIVE GROWTH
                    TABLE 23 PREBIOTICS & PROBIOTICS: AQUAFEED MARKET, BY REGION,  2018–2022 (USD MILLION)
                    TABLE 24 PREBIOTICS & PROBIOTICS: MARKET, BY REGION,  2023–2028 (USD MILLION)
    7.5 ENZYMES 
           7.5.1 FEED ENZYMES TO AID IN NUTRIENT ABSORPTION AND DRIVE GROWTH
                    TABLE 25 ENZYMES: AQUAFEED MARKET, BY REGION, 2018–2022 (USD MILLION)
                    TABLE 26 ENZYMES: MARKET, BY REGION, 2023–2028 (USD MILLION)
    7.6 ANTIBIOTICS 
           7.6.1 INFECTIOUS DISEASES SUCH AS COLUMNARIS AND STREPTOCOCCAL INFECTIONS IN AQUATIC ANIMALS TO LEAD  TO ADOPTION OF ANTIBIOTICS
                    TABLE 27 ANTIBIOTICS: AQUAFEED MARKET, BY REGION, 2018–2022 (USD MILLION)
                    TABLE 28 ANTIBIOTICS: MARKET, BY REGION, 2023–2028 (USD MILLION)
    7.7 ANTIOXIDANTS 
           7.7.1 RISE IN DEMAND FOR FISH FEED TO DRIVE GROWTH OF ANTIOXIDANTS AS ADDITIVE
                    TABLE 29 ANTIOXIDANTS: AQUAFEED MARKET, BY REGION, 2018–2022 (USD MILLION)
                    TABLE 30 ANTIOXIDANTS: MARKET, BY REGION, 2023–2028 (USD MILLION)
    7.8 OTHER ADDITIVES 
           TABLE 31 OTHER ADDITIVES: AQUAFEED MARKET, BY REGION, 2018–2022 (USD MILLION)
           TABLE 32 OTHER ADDITIVES: MARKET, BY REGION, 2023–2028 (USD MILLION)
 
8 AQUAFEED MARKET, BY FORM (Page No. - 104)
    8.1 INTRODUCTION 
           FIGURE 35 AQUAFEED MARKET SIZE, BY FORM, 2023 VS. 2028 (USD MILLION)
           TABLE 33 MARKET, BY FORM, 2018–2022 (USD MILLION)
           TABLE 34 MARKET, BY FORM, 2023–2028 (USD MILLION)
    8.2 DRY FORM 
           8.2.1 FREE-FLOWING STRUCTURE AND CONSISTENCY OF DRY AQUAFEED TO DRIVE GROWTH
                    TABLE 35 DRY FORM: AQUAFEED MARKET, BY REGION, 2018–2022 (USD MILLION)
                    TABLE 36 DRY FORM: MARKET, BY REGION, 2023–2028 (USD MILLION)
    8.3 WET FORM 
           8.3.1 WET FORM OF FEED TO MEET NUTRITIONAL REQUIREMENTS OF FISHES
                    TABLE 37 WET FORM: AQUAFEED MARKET, BY REGION, 2018–2022 (USD MILLION)
                    TABLE 38 WET FORM: MARKET, BY REGION, 2023–2028 (USD MILLION)
    8.4 MOIST FORM 
           8.4.1 MOIST FORM TO BE PALATABLE TO AQUATIC ANIMALS DUE TO ITS SOFT CONSISTENCY
                    TABLE 39 MOIST FORM: AQUAFEED MARKET, BY REGION, 2018–2022 (USD MILLION)
                    TABLE 40 MOIST FORM: MARKET, BY REGION, 2023–2028 (USD MILLION)
 
9 AQUAFEED MARKET, BY INGREDIENT (Page No. - 109)
    9.1 INTRODUCTION 
           FIGURE 36 AQUAFEED MARKET SIZE, BY INGREDIENT, 2023 VS. 2028 (USD MILLION)
           TABLE 41 MARKET, BY INGREDIENT, 2018–2022 (USD MILLION)
           TABLE 42 MARKET, BY INGREDIENT, 2023–2028 (USD MILLION)
           TABLE 43 MARKET, BY INGREDIENT, 2018–2022 (KT)
           TABLE 44 MARKET, BY INGREDIENT, 2023–2028 (KT)
    9.2 SOYBEAN 
           9.2.1 APPLICATION OF SOYBEAN FOR ANIMAL FEED TO BOOST MARKET
                    9.2.1.1 Soybean meal
                    9.2.1.2 Soy oil
                    9.2.1.3 Soy lecithin
                               TABLE 45 SOYBEAN: AQUAFEED MARKET, BY REGION, 2018–2022 (USD MILLION)
                               TABLE 46 SOYBEAN: MARKET, BY REGION, 2023–2028 (USD MILLION)
                               TABLE 47 SOYBEAN: MARKET, BY REGION, 2018–2022 (KT)
                               TABLE 48 SOYBEAN: MARKET, BY REGION, 2023–2028 (KT)
    9.3 FISH MEAL 
           9.3.1 FISHMEAL TO IMPROVE FEED EFFICIENCY OF FISHES AND PRAWNS AND DRIVE GROWTH
                    TABLE 49 FISH MEAL: AQUAFEED MARKET, BY REGION, 2018–2022 (USD MILLION)
                    TABLE 50 FISH MEAL: MARKET, BY REGION, 2023–2028 (USD MILLION)
                    TABLE 51 FISH MEAL: MARKET, BY REGION, 2018–2022 (KT)
                    TABLE 52 FISH MEAL: MARKET, BY REGION, 2023–2028 (KT)
    9.4 CORN 
           9.4.1 USAGE OF CORN OIL AS LOW-COST ALTERNATIVE IN AQUACULTURE TO DRIVE GROWTH
                    9.4.1.1 Corn gluten meal
                    9.4.1.2 Corn gluten feed
                    9.4.1.3 Corn oil
                               TABLE 53 CORN: AQUAFEED MARKET, BY REGION, 2018–2022 (USD MILLION)
                               TABLE 54 CORN: MARKET, BY REGION, 2023–2028 (USD MILLION)
                               TABLE 55 CORN: MARKET, BY REGION, 2018–2022 (KT)
                               TABLE 56 CORN: MARKET, BY REGION, 2023–2028 (KT)
    9.5 FISH OIL 
           9.5.1 NUTRIENT INFUSED OMEGA-3 FATTY ACIDS TO PROVIDE NUTRIENTS FOR SALMONIDS AND MARINE AND PROPEL GROWTH
                    TABLE 57 FISH OIL: AQUAFEED MARKET, BY REGION, 2018–2022 (USD MILLION)
                    TABLE 58 FISH OIL: MARKET, BY REGION, 2023–2028 (USD MILLION)
                    TABLE 59 FISH OIL: MARKET, BY REGION, 2018–2022 (KT)
                    TABLE 60 FISH OIL: MARKET, BY REGION, 2023–2028 (KT)
    9.6 ADDITIVES 
           9.6.1 GROWING DEMAND FOR HIGH-PROTEIN DIETS TO DRIVE GROWTH
                    TABLE 61 ADDITIVES: AQUAFEED MARKET, BY REGION, 2018–2022 (USD MILLION)
                    TABLE 62 ADDITIVES: MARKET, BY REGION, 2023–2028 (USD MILLION)
                    TABLE 63 ADDITIVES: MARKET, BY REGION, 2018–2022 (KT)
                    TABLE 64 ADDITIVES: MARKET, BY REGION, 2023–2028 (KT)
    9.7 OTHER INGREDIENTS 
           TABLE 65 OTHER INGREDIENTS: AQUAFEED MARKET, BY REGION, 2018–2022 (USD MILLION)
           TABLE 66 OTHER INGREDIENTS: MARKET, BY REGION, 2023–2028 (USD MILLION)
           TABLE 67 OTHER INGREDIENTS: MARKET, BY REGION, 2018–2022 (KT)
           TABLE 68 OTHER INGREDIENTS: MARKET, BY REGION, 2023–2028 (KT)
 
10 AQUAFEED MARKET, BY LIFECYCLE (Page No. - 124)
     10.1 INTRODUCTION 
               FIGURE 37 AQUAFEED MARKET SIZE, BY LIFECYCLE, 2023 VS. 2028 (USD MILLION)
               TABLE 69 MARKET, BY LIFECYCLE, 2018–2022 (USD MILLION)
               TABLE 70 MARKET, BY LIFECYCLE, 2023–2028 (USD MILLION)
     10.2 GROWER FEED 
             10.2.1 GROWER FEED WITH NUTRIENT BALANCE OF PROTEINS, CARBS, AND FATS FOR FINGERLINGS TO BOOST MARKET
                       TABLE 71 GROWER FEED: AQUAFEED MARKET, BY REGION, 2018–2022 (USD MILLION)
                       TABLE 72 GROWER FEED: MARKET, BY REGION, 2023–2028 (USD MILLION)
     10.3 FINISHER FEED 
             10.3.1 FINISHER FEEDS TO ENHANCE PROTEIN INTAKE OF AQUATIC SPECIES
                       TABLE 73 FINISHER FEED: AQUAFEED MARKET, BY REGION, 2018–2022 (USD MILLION)
                       TABLE 74 FINISHER FEED: MARKET, BY REGION, 2023–2028 (USD MILLION)
     10.4 STARTER FEED 
             10.4.1 STARTER FEED TO IMPROVE DIGESTION AND NUTRITIONAL INTAKE OF SMALL AQUATIC ANIMALS
                       TABLE 75 STARTER FEED: AQUAFEED MARKET, BY REGION, 2018–2022 (USD MILLION)
                       TABLE 76 STARTER FEED: MARKET, BY REGION, 2023–2028 (USD MILLION)
     10.5 BROODER FEED 
             10.5.1 BOTH NATURAL AND ARTIFICIAL FEEDS TO ENSURE BETTER REPRODUCTION IN BROODERS
                       TABLE 77 BROODER FEED: AQUAFEED MARKET, BY REGION, 2018–2022 (USD MILLION)
                       TABLE 78 BROODER FEED: MARKET, BY REGION, 2023–2028 (USD MILLION)
 
11 AQUAFEED MARKET, BY SPECIES (Page No. - 131)
     11.1 INTRODUCTION 
               FIGURE 38 AQUAFEED MARKET SIZE, BY SPECIES, 2023 VS. 2028 (USD MILLION)
               TABLE 79 MARKET, BY SPECIES, 2018–2022 (USD MILLION)
               TABLE 80 MARKET, BY SPECIES, 2023–2028 (USD MILLION)
     11.2 FISH 
             11.2.1 FISH AS ANIMAL PROTEIN TO DRIVE DEMAND FOR AQUAFEED INGREDIENTS AMONG ALL SPECIES
                       TABLE 81 FISH: AQUAFEED MARKET, BY REGION, 2018–2022 (USD MILLION)
                       TABLE 82 FISH: MARKET, BY REGION, 2023–2028 (USD MILLION)
             11.2.2 TILAPIA
             11.2.3 SALMON
             11.2.4 CARP
             11.2.5 TROUT
             11.2.6 OTHER FISH SPECIES
                       TABLE 83 FISH: AQUAFEED MARKET, BY SUB-TYPE, 2018–2022 (USD MILLION)
                       TABLE 84 FISH: MARKET, SUB-TYPE, 2023–2028 (USD MILLION)
     11.3 CRUSTACEANS 
             11.3.1 GROWTH IN SHRIMP PRODUCTION TO BOOST AQUAFEED CONSUMPTION AMONG CRUSTACEANS
                       TABLE 85 CRUSTACEANS: AQUAFEED MARKET, BY REGION, 2018–2022 (USD MILLION)
                       TABLE 86 CRUSTACEANS: MARKET, BY REGION, 2023–2028 (USD MILLION)
             11.3.2 SHRIMPS
             11.3.3 CRABS
             11.3.4 KRILLS
             11.3.5 OTHER CRUSTACEANS
                       TABLE 87 CRUSTACEANS: AQUAFEED MARKET, BY SUB-TYPE, 2018–2022 (USD MILLION)
                       TABLE 88 CRUSTACEANS: MARKET, BY SUB-TYPE, 2023–2028 (USD MILLION)
     11.4 MOLLUSKS 
             11.4.1 OYSTERS AND MUSSELS TO PROPEL GROWTH
                       TABLE 89 MOLLUSKS: AQUAFEED MARKET, BY REGION, 2018–2022 (USD MILLION)
                       TABLE 90 MOLLUSKS: MARKET, BY REGION, 2023–2028 (USD MILLION)
             11.4.2 OYSTERS
             11.4.3 MUSSELS
             11.4.4 OTHER MOLLUSKS
                       TABLE 91 MOLLUSKS: AQUAFEED MARKET, BY SUB-TYPE, 2018–2022 (USD MILLION)
                       TABLE 92 MOLLUSKS: MARKET, BY SUB-TYPE, 2023–2028 (USD MILLION)
     11.5 OTHER SPECIES 
               TABLE 93 OTHER SPECIES: AQUAFEED MARKET, BY REGION, 2018–2022 (USD MILLION)
               TABLE 94 OTHER SPECIES: MARKET, BY REGION, 2023–2028 (USD MILLION)
 
12 AQUAFEED MARKET, BY REGION (Page No. - 142)
     12.1 INTRODUCTION 
               FIGURE 39 AQUAFEED MARKET, BY REGION, 2023 VS. 2028 (USD MILLION)
               FIGURE 40 VIETNAM TO BE FASTEST GROWING REGION DURING FORECAST PERIOD
               TABLE 95 AQUAFEED MARKET, BY REGION, 2018–2022 (USD MILLION)
               TABLE 96 MARKET, BY REGION, 2023–2028 (USD MILLION)
               TABLE 97 MARKET, BY REGION, 2018–2022 (KT)
               TABLE 98 MARKET, BY REGION, 2023–2028 (KT)
     12.2 NORTH AMERICA 
               TABLE 99 NORTH AMERICA: AQUAFEED MARKET, BY COUNTRY, 2018–2022 (USD MILLION)
               TABLE 100 NORTH AMERICA: MARKET, BY COUNTRY, 2023–2028 (USD MILLION)
               TABLE 101 NORTH AMERICA: MARKET, BY SPECIES, 2018–2022 (USD MILLION)
               TABLE 102 NORTH AMERICA: MARKET, BY SPECIES, 2023–2028 (USD MILLION)
               TABLE 103 NORTH AMERICA: MARKET, BY INGREDIENT, 2018–2022 (USD MILLION)
               TABLE 104 NORTH AMERICA: MARKET, BY INGREDIENT, 2023–2028 (USD MILLION)
               TABLE 105 NORTH AMERICA: MARKET, BY INGREDIENT, 2018–2022 (KT)
               TABLE 106 NORTH AMERICA: MARKET, BY INGREDIENT, 2023–2028 (KT)
               TABLE 107 NORTH AMERICA: MARKET, BY ADDITIVE, 2018–2022 (USD MILLION)
               TABLE 108 NORTH AMERICA: MARKET, BY ADDITIVE, 2023–2028 (USD MILLION)
               TABLE 109 NORTH AMERICA: MARKET, BY LIFECYCLE, 2018–2022 (USD MILLION)
               TABLE 110 NORTH AMERICA: MARKET, BY LIFECYCLE, 2023–2028 (USD MILLION)
               TABLE 111 NORTH AMERICA: MARKET, BY FORM, 2018–2022 (USD MILLION)
               TABLE 112 NORTH AMERICA: MARKET, BY FORM, 2023–2028 (USD MILLION)
             12.2.1 NORTH AMERICA: RECESSION IMPACT ANALYSIS
                       FIGURE 41 INFLATION: COUNTRY-LEVEL DATA (2018–2021)
                       FIGURE 42 NORTH AMERICA: RECESSION IMPACT ANALYSIS, 2022
             12.2.2 US
                       12.2.2.1 Increasing aquaculture production and consumption to drive growth
                                   TABLE 113 US: AQUAFEED MARKET, BY INGREDIENT, 2018–2022 (USD MILLION)
                                   TABLE 114 US: MARKET, BY INGREDIENT, 2023–2028 (USD MILLION)
                                   TABLE 115 US: MARKET, BY INGREDIENT, 2018–2022 (KT)
                                   TABLE 116 US: MARKET, BY INGREDIENT, 2023–2028 (KT)
             12.2.3 MEXICO
                       12.2.3.1 Government initiatives to promote consumption of seafood  and drive growth
                                   TABLE 117 MEXICO: AQUAFEED MARKET, BY INGREDIENT, 2018–2022 (USD MILLION)
                                   TABLE 118 MEXICO: MARKET, BY INGREDIENT, 2023–2028 (USD MILLION)
                                   TABLE 119 MEXICO: MARKET, BY INGREDIENT, 2018–2022 (KT)
                                   TABLE 120 MEXICO: MARKET, BY INGREDIENT, 2023–2028 (KT)
             12.2.4 CANADA
                       12.2.4.1 Rise in market exports to promote aquafeed market
                                   TABLE 121 CANADA: AQUAFEED MARKET, BY INGREDIENT, 2018–2022 (USD MILLION)
                                   TABLE 122 CANADA: MARKET, BY INGREDIENT, 2023–2028 (USD MILLION)
                                   TABLE 123 CANADA: MARKET, BY INGREDIENT, 2018–2022 (KT)
                                   TABLE 124 CANADA: MARKET, BY INGREDIENT, 2023–2028 (KT)
     12.3 EUROPE 
               FIGURE 43 EUROPE: AQUAFEED MARKET SNAPSHOT, 2022
               TABLE 125 EUROPE: MARKET, BY COUNTRY, 2018–2022 (USD MILLION)
               TABLE 126 EUROPE: MARKET, BY COUNTRY, 2023–2028 (USD MILLION)
               TABLE 127 EUROPE: MARKET, BY SPECIES, 2018–2022 (USD MILLION)
               TABLE 128 EUROPE: MARKET, BY SPECIES, 2023–2028 (USD MILLION)
               TABLE 129 EUROPE: MARKET, BY INGREDIENT, 2018–2022 (USD MILLION)
               TABLE 130 EUROPE: MARKET, BY INGREDIENT, 2023–2028 (USD MILLION)
               TABLE 131 EUROPE: MARKET, BY INGREDIENT, 2018–2022 (KT)
               TABLE 132 EUROPE: MARKET, BY INGREDIENT, 2023–2028 (KT)
               TABLE 133 EUROPE: MARKET, BY ADDITIVE, 2018–2022 (USD MILLION)
               TABLE 134 EUROPE: MARKET, BY ADDITIVE, 2023–2028 (USD MILLION)
               TABLE 135 EUROPE: MARKET, BY LIFECYCLE, 2018–2022 (USD MILLION)
               TABLE 136 EUROPE: MARKET, BY LIFECYCLE, 2023–2028 (USD MILLION)
               TABLE 137 EUROPE: MARKET, BY FORM, 2018–2022 (USD MILLION)
               TABLE 138 EUROPE: MARKET, BY FORM, 2023–2028 (USD MILLION)
             12.3.1 EUROPE: RECESSION IMPACT ANALYSIS
                       FIGURE 44 EUROPE: INFLATION RATES, BY KEY COUNTRY, 2017–2021
                       FIGURE 45 EUROPE: RECESSION IMPACT ANALYSIS, 2022
             12.3.2 NORWAY
                       12.3.2.1 Research and development activities related to aquafeed to drive growth
                                   TABLE 139 NORWAY: AQUAFEED MARKET, BY INGREDIENT, 2018–2022 (USD MILLION)
                                   TABLE 140 NORWAY: MARKET, BY INGREDIENT, 2023–2028 (USD MILLION)
                                   TABLE 141 NORWAY: MARKET, BY INGREDIENT, 2018–2022 (KT)
                                   TABLE 142 NORWAY: MARKET, BY INGREDIENT, 2023–2028 (KT)
             12.3.3 GREECE
                       12.3.3.1 Increase in seafood production to boost growth
                                   TABLE 143 GREECE: AQUAFEED MARKET, BY INGREDIENT, 2018–2022 (USD MILLION)
                                   TABLE 144 GREECE: MARKET, BY INGREDIENT, 2023–2028 (USD MILLION)
                                   TABLE 145 GREECE: MARKET, BY INGREDIENT, 2018–2022 (KT)
                                   TABLE 146 GREECE: MARKET, BY INGREDIENT, 2023–2028 (KT)
             12.3.4 UK
                       12.3.4.1 Rise in seafood consumption coupled with aquaculture trading to propel growth
                                   TABLE 147 UK: AQUAFEED MARKET, BY INGREDIENT, 2018–2022 (USD MILLION)
                                   TABLE 148 UK: MARKET, BY INGREDIENT, 2023–2028 (USD MILLION)
                                   TABLE 149 UK: MARKET, BY INGREDIENT, 2018–2022 (KT)
                                   TABLE 150 UK: MARKET, BY INGREDIENT, 2023–2028 (KT)
             12.3.5 RUSSIA
                       12.3.5.1 Government initiatives to propel market
                                   TABLE 151 RUSSIA: AQUAFEED MARKET, BY INGREDIENT, 2018–2022 (USD MILLION)
                                   TABLE 152 RUSSIA: MARKET, BY INGREDIENT, 2023–2028 (USD MILLION)
                                   TABLE 153 RUSSIA: MARKET, BY INGREDIENT, 2018–2022 (KT)
                                   TABLE 154 RUSSIA: MARKET, BY INGREDIENT, 2023–2028 (KT)
             12.3.6 SPAIN
                       12.3.6.1 Seafood trading with other countries along with country’s vast mollusk population to raise demand
                                   TABLE 155 SPAIN: AQUAFEED MARKET, BY INGREDIENT, 2018–2022 (USD MILLION)
                                   TABLE 156 SPAIN: MARKET, BY INGREDIENT, 2023–2028 (USD MILLION)
                                   TABLE 157 SPAIN: MARKET, BY INGREDIENT, 2018–2022 (KT)
                                   TABLE 158 SPAIN: MARKET, BY INGREDIENT, 2023–2028 (KT)
             12.3.7 REST OF EUROPE
                       TABLE 159 REST OF EUROPE: AQUAFEED MARKET, BY INGREDIENT, 2018–2022 (USD MILLION)
                       TABLE 160 REST OF EUROPE: MARKET, BY INGREDIENT, 2023–2028 (USD MILLION)
                       TABLE 161 REST OF EUROPE: MARKET, BY INGREDIENT, 2018–2022 (KT)
                       TABLE 162 REST OF EUROPE: MARKET, BY INGREDIENT, 2023–2028 (KT)
     12.4 ASIA PACIFIC 
               FIGURE 46 ASIA PACIFIC: AQUAFEED MARKET SNAPSHOT, 2022
               FIGURE 47 CHINA PROJECTED TO GROW FASTEST DURING FORECAST PERIOD
               TABLE 163 ASIA PACIFIC: AQUAFEED MARKET, BY COUNTRY, 2018–2022 (USD MILLION)
               TABLE 164 ASIA PACIFIC: MARKET, BY COUNTRY, 2023–2028 (USD MILLION)
               TABLE 165 ASIA PACIFIC: MARKET, BY SPECIES, 2018–2022 (USD MILLION)
               TABLE 166 ASIA PACIFIC: MARKET, BY SPECIES, 2023–2028 (USD MILLION)
               TABLE 167 ASIA PACIFIC: MARKET, BY INGREDIENT, 2018–2022 (USD MILLION)
               TABLE 168 ASIA PACIFIC: MARKET, BY INGREDIENT, 2023–2028 (USD MILLION)
               TABLE 169 AISA PACIFIC: MARKET, BY INGREDIENT, 2018–2022 (KT)
               TABLE 170 ASIA PACIFIC: MARKET, BY INGREDIENT, 2023–2028 (KT)
               TABLE 171 ASIA PACIFIC: MARKET, BY ADDITIVE, 2018–2022 (USD MILLION)
               TABLE 172 ASIA PACIFIC: MARKET, BY ADDITIVE, 2023–2028 (USD MILLION)
               TABLE 173 ASIA PACIFIC: MARKET, BY LIFECYCLE, 2018–2022 (USD MILLION)
               TABLE 174 ASIA PACIFIC: MARKET, BY LIFECYCLE, 2023–2028 (USD MILLION)
               TABLE 175 ASIA PACIFIC: MARKET, BY FORM, 2018–2022 (USD MILLION)
               TABLE 176 ASIA PACIFIC: MARKET, BY FORM, 2023–2028 (USD MILLION)
             12.4.1 ASIA PACIFIC: RECESSION IMPACT ANALYSIS
                       FIGURE 48 ASIA PACIFIC: INFLATION RATES, BY KEY COUNTRY, 2017–2021
                       FIGURE 49 ASIA PACIFIC: RECESSION IMPACT ANALYSIS, 2022
             12.4.2 CHINA
                       12.4.2.1 Growth in aquaculture industry to propel market growth
                                   TABLE 177 CHINA: AQUAFEED MARKET, BY INGREDIENT, 2018–2022 (USD MILLION)
                                   TABLE 178 CHINA: MARKET, BY INGREDIENT, 2023–2028 (USD MILLION)
                                   TABLE 179 CHINA: MARKET, BY INGREDIENT, 2018–2022 (KT)
                                   TABLE 180 CHINA: MARKET, BY INGREDIENT, 2023–2028 (KT)
             12.4.3 VIETNAM
                       12.4.3.1 Increased production and trading of shrimps and other seafood products to boost market
                                   TABLE 181 VIETNAM: AQUAFEED MARKET, BY INGREDIENT, 2018–2022 (USD MILLION)
                                   TABLE 182 VIETNAM: MARKET, BY INGREDIENT, 2023–2028 (USD MILLION)
                                   TABLE 183 VIETNAM: MARKET, BY INGREDIENT, 2018–2022 (KT)
                                   TABLE 184 VIETNAM: MARKET, BY INGREDIENT, 2023–2028 (KT)
             12.4.4 THAILAND
                       12.4.4.1 Rise in demand for exotic seafood products to drive market
                                   TABLE 185 THAILAND: AQUAFEED MARKET, BY INGREDIENT, 2018–2022 (USD MILLION)
                                   TABLE 186 THAILAND: MARKET, BY INGREDIENT, 2023–2028 (USD MILLION)
                                   TABLE 187 THAILAND: MARKET, BY INGREDIENT, 2018–2022 (KT)
                                   TABLE 188 THAILAND: MARKET, BY INGREDIENT, 2023–2028 (KT)
             12.4.5 INDONESIA
                       12.4.5.1 Maintenance of wellbeing of aquatic animals to drive demand for aquafeed
                                   TABLE 189 INDONESIA: AQUAFEED MARKET, BY INGREDIENT, 2018–2022 (USD MILLION)
                                   TABLE 190 INDONESIA: MARKET, BY INGREDIENT, 2023–2028 (USD MILLION)
                                   TABLE 191 INDONESIA: MARKET, BY INGREDIENT, 2018–2022 (KT)
                                   TABLE 192 INDONESIA: MARKET, BY INGREDIENT, 2023–2028 (KT)
             12.4.6 INDIA
                       12.4.6.1 Shift toward intensive aquafarming to propel market growth
                                   TABLE 193 INDIA: AQUAFEED MARKET, BY INGREDIENT, 2018–2022 (USD MILLION)
                                   TABLE 194 INDIA: MARKET, BY INGREDIENT, 2023–2028 (USD MILLION)
                                   TABLE 195 INDIA: MARKET, BY INGREDIENT, 2018–2022 (KT)
                                   TABLE 196 INDIA: MARKET, BY INGREDIENT, 2023–2028 (KT)
             12.4.7 REST OF ASIA PACIFIC
                       12.4.7.1 Seafood to be healthy dietary constituent and drive growth
                                   TABLE 197 REST OF ASIA PACIFIC: AQUAFEED MARKET, BY INGREDIENT, 2018–2022 (USD MILLION)
                                   TABLE 198 REST OF ASIA PACIFIC: MARKET, BY INGREDIENT, 2023–2028 (USD MILLION)
                                   TABLE 199 REST OF ASIA PACIFIC: MARKET, BY INGREDIENT, 2018–2022 (KT)
                                   TABLE 200 REST OF ASIA PACIFIC: MARKET, BY INGREDIENT, 2023–2028 (KT)
     12.5 SOUTH AMERICA 
             12.5.1 SOUTH AMERICA: RECESSION IMPACT ANALYSIS
                       FIGURE 50 SOUTH AMERICA: INFLATION RATES, BY KEY COUNTRY, 2017–2021
                       FIGURE 51 SOUTH AMERICA: RECESSION IMPACT ANALYSIS, 2022
                       TABLE 201 SOUTH AMERICA: AQUAFEED MARKET, BY COUNTRY, 2018–2022 (USD MILLION)
                       TABLE 202 SOUTH AMERICA: MARKET, BY COUNTRY, 2023–2028 (USD MILLION)
                       TABLE 203 SOUTH AMERICA: MARKET, BY SPECIES, 2018–2022 (USD MILLION)
                       TABLE 204 SOUTH AMERICA: MARKET, BY SPECIES, 2023–2028 (USD MILLION)
                       TABLE 205 SOUTH AMERICA: MARKET, BY INGREDIENT, 2018–2022 (USD MILLION)
                       TABLE 206 SOUTH AMERICA: MARKET, BY INGREDIENT, 2023–2028 (USD MILLION)
                       TABLE 207 SOUTH AMERICA: MARKET, BY INGREDIENT, 2018–2022 (KT)
                       TABLE 208 SOUTH AMERICA: MARKET, BY INGREDIENT, 2023–2028 (KT)
                       TABLE 209 SOUTH AMERICA: MARKET, BY ADDITIVE, 2018–2022 (USD MILLION)
                       TABLE 210 SOUTH AMERICA: MARKET, BY ADDITIVE, 2023–2028 (USD MILLION)
                       TABLE 211 SOUTH AMERICA: MARKET, BY LIFECYCLE, 2018–2022 (USD MILLION)
                       TABLE 212 SOUTH AMERICA: MARKET, BY LIFECYCLE, 2023–2028 (USD MILLION)
                       TABLE 213 SOUTH AMERICA: MARKET, BY FORM, 2018–2022 (USD MILLION)
                       TABLE 214 SOUTH AMERICA: MARKET, BY FORM, 2023–2028 (USD MILLION)
             12.5.2 CHILE
                       12.5.2.1 Suitable climatic conditions in large fish farms to drive growth
                                   TABLE 215 CHILE: AQUAFEED MARKET, BY INGREDIENT, 2018–2022 (USD MILLION)
                                   TABLE 216 CHILE: MARKET, BY INGREDIENT, 2023–2028 (USD MILLION)
                                   TABLE 217 CHILE: MARKET, BY INGREDIENT, 2018–2022 (KT)
                                   TABLE 218 CHILE: MARKET, BY INGREDIENT, 2023–2028 (KT)
             12.5.3 BRAZIL
                       12.5.3.1 Favorable government opportunities formulated to propel growth
                                   TABLE 219 BRAZIL: AQUAFEED MARKET, BY INGREDIENT, 2018–2022 (USD MILLION)
                                   TABLE 220 BRAZIL: MARKET, BY INGREDIENT, 2023–2028 (USD MILLION)
                                   TABLE 221 BRAZIL: MARKET, BY INGREDIENT, 2018–2022 (KT)
                                   TABLE 222 BRAZIL: MARKET, BY INGREDIENT, 2023–2028 (KT)
             12.5.4 REST OF SOUTH AMERICA
                       TABLE 223 REST OF SOUTH AMERICA: AQUAFEED MARKET, BY INGREDIENT,  2018–2022 (USD MILLION)
                       TABLE 224 REST OF SOUTH AMERICA: MARKET, BY INGREDIENT,  2023–2028 (USD MILLION)
                       TABLE 225 REST OF SOUTH AMERICA: MARKET, BY INGREDIENT, 2018–2022 (KT)
                       TABLE 226 REST OF SOUTH AMERICA: MARKET, BY INGREDIENT, 2023–2028 (KT)
     12.6 REST OF THE WORLD (ROW) 
             12.6.1 RECESSION IMPACT ANALYSIS, REST OF THE WORLD (ROW)
                       FIGURE 52 ROW: INFLATION RATES, BY KEY COUNTRY, 2018–2021
                       FIGURE 53 ROW: RECESSION IMPACT ANALYSIS, 2022
                       TABLE 227 ROW: AQUAFEED MARKET, BY COUNTRY, 2018–2022 (USD MILLION)
                       TABLE 228 ROW: MARKET, BY COUNTRY, 2023–2028 (USD MILLION)
                       TABLE 229 ROW: MARKET, BY SPECIES, 2018–2022 (USD MILLION)
                       TABLE 230 ROW: MARKET, BY SPECIES, 2023–2028 (USD MILLION)
                       TABLE 231 ROW: MARKET, BY INGREDIENT, 2018–2022 (USD MILLION)
                       TABLE 232 ROW: MARKET, BY INGREDIENT, 2023–2028 (USD MILLION)
                       TABLE 233 ROW: MARKET, BY INGREDIENT, 2018–2022 (KT)
                       TABLE 234 ROW: MARKET, BY INGREDIENT, 2023–2028 (KT)
                       TABLE 235 ROW: MARKET, BY ADDITIVE, 2018–2022 (USD MILLION)
                       TABLE 236 ROW: MARKET, BY ADDITIVE, 2023–2028 (USD MILLION)
                       TABLE 237 ROW: MARKET, BY LIFECYCLE, 2018–2022 (USD MILLION)
                       TABLE 238 ROW: MARKET, BY LIFECYCLE, 2023–2028 (USD MILLION)
                       TABLE 239 ROW: MARKET, BY FORM, 2018–2022 (USD MILLION)
                       TABLE 240 ROW: MARKET, BY FORM, 2023–2028 (USD MILLION)
             12.6.2 AFRICA
                       12.6.2.1 Lack of infrastructure and poor access to market to decrease aquaculture activity
                                   TABLE 241 AFRICA: AQUAFEED MARKET, BY INGREDIENT, 2018–2022 (USD MILLION)
                                   TABLE 242 AFRICA: MARKET, BY INGREDIENT, 2023–2028 (USD MILLION)
                                   TABLE 243 AFRICA: MARKET, BY INGREDIENT, 2018–2022 (KT)
                                   TABLE 244 AFRICA: MARKET, BY INGREDIENT, 2023–2028 (KT)
             12.6.3 MIDDLE EAST
                       12.6.3.1 Rise in demand for value-added processed seafood products to drive growth
                                   TABLE 245 MIDDLE EAST: AQUAFEED MARKET, BY INGREDIENT, 2018–2022 (USD MILLION)
                                   TABLE 246 MIDDLE EAST: MARKET, BY INGREDIENT, 2023–2028 (USD MILLION)
                                   TABLE 247 MIDDLE EAST: MARKET, BY INGREDIENT, 2018–2022 (KT)
                                   TABLE 248 MIDDLE EAST: MARKET, BY INGREDIENT, 2023–2028 (KT)
 
13 COMPETITIVE LANDSCAPE (Page No. - 221)
     13.1 OVERVIEW 
     13.2 MARKET SHARE ANALYSIS, 2022 
               TABLE 249 AQUAFEED MARKET: DEGREE OF COMPETITION
     13.3 STRATEGIES ADOPTED BY KEY PLAYERS 
               TABLE 250 STRATEGIES ADOPTED BY KEY PLAYERS
     13.4 SEGMENTAL REVENUE ANALYSIS OF KEY PLAYERS 
               FIGURE 54 SEGMENTAL REVENUE ANALYSIS OF KEY PLAYERS IN MARKET,  2018–2022 (USD BILLION)
     13.5 COMPANY EVALUATION MATRIX (KEY PLAYERS) 
             13.5.1 STARS
             13.5.2 EMERGING LEADERS
             13.5.3 PERVASIVE PLAYERS
             13.5.4 PARTICIPANTS
                       FIGURE 55 AQUAFEED MARKET: COMPANY EVALUATION MATRIX, 2022 (KEY PLAYERS)
             13.5.5 PRODUCT FOOTPRINT
                       TABLE 251 COMPANY FOOTPRINT, BY SPECIES
                       TABLE 252 COMPANY FOOTPRINT, BY FORM
                       TABLE 253 COMPANY FOOTPRINT, BY REGION
                       TABLE 254 OVERALL, COMPANY FOOTPRINT
     13.6 AQUAFEED MARKET, EVALUATION MATRIX  FOR STARTUPS/SMES, 2022 
             13.6.1 PROGRESSIVE COMPANIES
             13.6.2 STARTING BLOCKS
             13.6.3 RESPONSIVE COMPANIES
             13.6.4 DYNAMIC COMPANIES
                       FIGURE 56 AQUAFEED MARKET: COMPANY EVALUATION MATRIX, 2022 (STARTUPS/SMES)
             13.6.5 COMPETITIVE BENCHMARKING OF KEY STARTUPS/SMES
                       TABLE 255 AQUAFEED MARKET: DETAILED LIST OF KEY STARTUPS/SMES
                       TABLE 256 MARKET: COMPETITIVE BENCHMARKING OF KEY STARTUPS/SMES
     13.7 COMPETITIVE SCENARIO 
             13.7.1 PRODUCT LAUNCHES
                       TABLE 257 AQUAFEED MARKET: PRODUCT LAUNCHES
             13.7.2 DEALS
                       TABLE 258 AQUAFEED MARKET: DEALS
             13.7.3 OTHERS
                       TABLE 259 AQUAFEED MARKET: OTHERS
 
14 COMPANY PROFILES (Page No. - 238)
(Business overview, Products/Solutions/Services offered, Recent developments & MnM View)*
     14.1 KEY PLAYERS 
             14.1.1 ADM
                       TABLE 260 ADM: BUSINESS OVERVIEW
                       FIGURE 57 ADM: COMPANY SNAPSHOT
                       TABLE 261 ADM: PRODUCTS OFFERED
                       TABLE 262 ADM: PRODUCT LAUNCHES
                       TABLE 263 ADM: DEALS
                       TABLE 264 ADM: OTHERS
             14.1.2 CARGILL, INCORPORATED
                       TABLE 265 CARGILL, INCORPORATED: BUSINESS OVERVIEW
                       FIGURE 58 CARGILL, INCORPORATED: COMPANY SNAPSHOT
                       TABLE 266 CARGILL, INCORPORATED: PRODUCTS OFFERED
                       TABLE 267 CARGILL, INCORPORATED: OTHERS
             14.1.3 RIDLEY CORPORATION LIMITED
                       TABLE 268 RIDLEY CORPORATION LIMITED: BUSINESS OVERVIEW
                       FIGURE 59 RIDLEY CORPORATION LIMITED: COMPANY SNAPSHOT
                       TABLE 269 RIDELY CORPORATION LIMITED: PRODUCTS OFFERED
                       TABLE 270 RIDELY CORPORATION LIMITED: DEALS
                       TABLE 271 RIDLEY CORPORATION LIMITED: OTHERS
             14.1.4 NUTRECO
                       TABLE 272 NUTRECO: BUSINESS OVERVIEW
                       TABLE 273 NUTRECO: PRODUCTS OFFERED
                       TABLE 274 NUTRECO: DEALS
             14.1.5 ALLTECH
                       TABLE 275 ALLTECH: BUSINESS OVERVIEW
                       TABLE 276 ALLTECH: PRODUCTS OFFERED
                       TABLE 277 ALLTECH: DEALS
             14.1.6 PURINA ANIMAL NUTRITION
                       TABLE 278 PURINA ANIMAL NUTRITION: BUSINESS OVERVIEW
                       TABLE 279 PURINA ANIMAL NUTRITION: PRODUCTS OFFERED
             14.1.7 ADISSEO
                       TABLE 280 ADISSEO: BUSINESS OVERVIEW
                       TABLE 281 NUTRIAD: PRODUCTS OFFERED
             14.1.8 ALLER AQUA A/S
                       TABLE 282 ALLER AQUA A/S: BUSINESS OVERVIEW
                       TABLE 283 ALLER AQUA/S: PRODUCTS OFFERED
                       TABLE 284 ALLER AQUA A/S: DEALS
             14.1.9 BIOMIN
                       TABLE 285 BIOMIN: BUSINESS OVERVIEW
                       TABLE 286 BIOMIN: PRODUCTS OFFERED
             14.1.10 BIOMAR
                       TABLE 287 BIOMAR: BUSINESS OVERVIEW
                       TABLE 288 BIOMAR: PRODUCTS OFFERED
                       TABLE 289 BIOMAR: DEALS
             14.1.11 NOREL ANIMAL NUTRITION
                       TABLE 290 NOREL ANIMAL NUTRITION: BUSINESS OVERVIEW
                       TABLE 291 NOREL ANIMAL NUTRITION: PRODUCTS OFFERED
                       TABLE 292 NOREL ANIMAL NUTRITION: DEALS
             14.1.12 AVANTI FEEDS LIMITED
                       TABLE 293 AVANTI FEEDS LIMITED: BUSINESS OVERVIEW
                       FIGURE 60 AVANTI FEEDS LIMITED: COMPANY SNAPSHOT
                       TABLE 294 AVANTI FEEDS LIMITED: PRODUCTS OFFERED
                       TABLE 295 AVANTI FEEDS LIMITED: OTHERS
             14.1.13 DE HEUS ANIMAL NUTRITION B.V
                       TABLE 296 DE HEUS ANIMAL NUTRITION B.V: BUSINESS OVERVIEW
                       TABLE 297 DE HEUS ANIMAL NUTRITION B.V: PRODUCTS OFFERED
                       TABLE 298 DE HEUS ANIMAL NUTRITION B.V: OTHERS
             14.1.14 NOVUS INTERNATIONAL
                       TABLE 299 NOVUS INTERNATIONAL: BUSINESS OVERVIEW
                       TABLE 300 NOVUS INTERNATIONAL: PRODUCTS OFFERED
             14.1.15 BIOSTADT INDIA LIMITED
                       TABLE 301 BIOSTADT INDIA LIMITED: BUSINESS OVERVIEW
                       TABLE 302 BIOSTADT INDIA LIMITED: PRODUCTS OFFERED
     14.2 OTHER PLAYERS/STARTUPS/SMES 
             14.2.1 THE WATERBASE LIMITED
                       TABLE 303 THE WATERBASE LIMITED: BUSINESS OVERVIEW
                       TABLE 304 THE WATERBASE LIMITED: PRODUCTS OFFERED
             14.2.2 MARUBEIN NISSHIN FEED CO., LTD
                       TABLE 305 MARUBEIN NISSHIN FEED CO., LTD: BUSINESS OVERVIEW
                       TABLE 306 MARUBEIN NISSHIN FEED CO., LTD: PRODUCTS OFFERED
             14.2.3 MARVESA
                       TABLE 307 MARVESA: BUSINESS OVERVIEW
                       TABLE 308 MARVESA: PRODUCTS OFFERED
             14.2.4 BENEO
                       TABLE 309 BENEO: BUSINESS OVERVIEW
                       TABLE 310 BENEO: PRODUCTS OFFERED
             14.2.5 JAPFA COMFEED
                       TABLE 311 JAPFA COMFEED: BUSINESS OVERVIEW
                       TABLE 312 JAPFA COMFEED: PRODUCTS OFFERED
             14.2.6 CPF PLC
             14.2.7 GROWEL FEEDS
             14.2.8 SONAC
             14.2.9 KENT FEEDS
             14.2.10 LIFECIRCLE NUTRITION
*Details on Business overview, Products/Solutions/Services offered, Recent developments & MnM View might not be captured in case of unlisted companies.
 
15 ADJACENT & RELATED MARKETS (Page No. - 283)
     15.1 INTRODUCTION 
     15.2 COMPOUND FEED MARKET 
             15.2.1 LIMITATIONS
             15.2.2 MARKET DEFINITION
             15.2.3 MARKET OVERVIEW
             15.2.4 COMPOUND FEED MARKET, BY INGREDIENT
                       TABLE 313 COMPOUND FEED MARKET SIZE, BY INGREDIENT, 2018–2027 (USD MILLION)
             15.2.5 COMPOUND FEED MARKET, BY REGION
                       TABLE 314 COMPOUND FEED MARKET SIZE, BY REGION, 2018–2027 (USD MILLION)
     15.3 AQUACULTURE PRODUCTS MARKET 
             15.3.1 LIMITATIONS
             15.3.2 MARKET DEFINITION
             15.3.3 MARKET OVERVIEW
             15.3.4 AQUACULTURE MARKET, BY SPECIES
                       TABLE 315 AQUACULTURE PRODUCTS MARKET SIZE, BY SPECIES, 2019–2027 (USD MILLION)
             15.3.5 AQUACULTURE MARKET, BY REGION
                       TABLE 316 AQUACULTURE PRODUCT MARKET SIZE, BY REGION, 2019–2027 (USD MILLION)
 
16 APPENDIX (Page No. - 288)
     16.1 DISCUSSION GUIDE 
     16.2 KNOWLEDGESTORE: MARKETSANDMARKETS’  SUBSCRIPTION PORTAL 
     16.3 CUSTOMIZATION OPTIONS 
     16.4 RELATED REPORTS 
     16.5 AUTHOR DETAILS 


This research involves the extensive use of secondary sources; directories; and databases (Bloomberg and Factiva) to identify and collect information useful for a technical, market-oriented, and commercial study of the aquafeed market. In-depth interviews were conducted with various primary respondents, such as key industry participants, Subject Matter Experts (SMEs), C-level executives of key market players, and industry consultants, to obtain and verify critical qualitative and quantitative information and to assess prospects.

Secondary Research

In the secondary research process, various sources, such as the US Federal Food, Drug and Cosmetic Act (FD&C Act), Food and Agriculture Organization (FAO), Food and Drug Administration (FDA), Association of American Feed Control Officials (AAFCO), United States Department of Agriculture (USDA), Environmental Protection Agency (EPA), National Marine Fisheries Service (NMFS), National Service for Agri-Food Health, Safety, and Quality (SENASICA), European Food Safety Authority (EFSA), Ministry of Agriculture, Forestry and Fisheries (MAFF), and Australian Pesticides and Veterinary Medicines Authority were referred to identify and collect information for this study. The secondary sources also include journals, press releases, investor presentations of companies, whitepapers, certified publications, articles by recognized authors and regulatory bodies, trade directories, and paid databases.

Primary Research

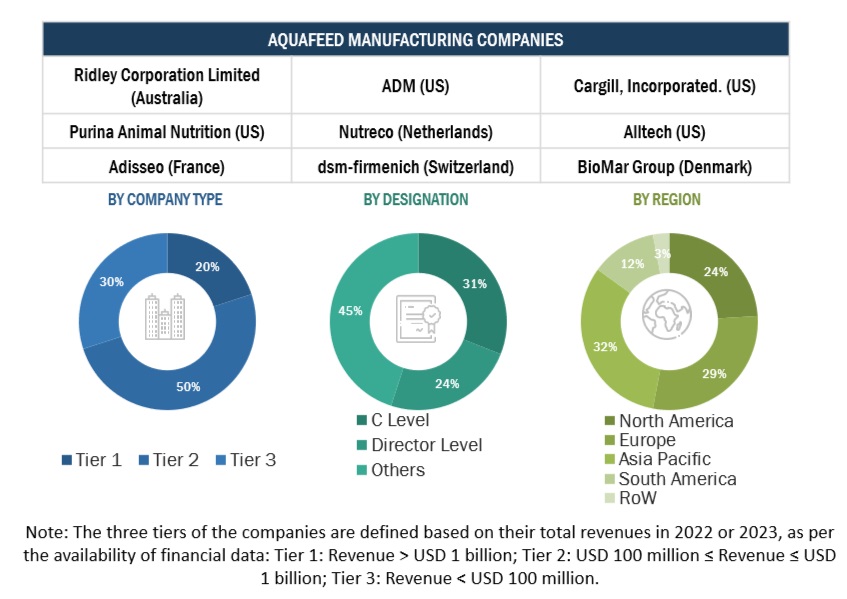
The aquafeed market comprises several stakeholders, including the finance/procurement department playing a crucial role in managing the financial aspects of purchasing aquafeed.  Various primary sources from both the supply and demand sides of the market were interviewed to obtain qualitative and quantitative information. Primary interviewees from the supply side include research institutions involved in R&D to introduce technology, aquafeed manufacturers and technology providers. Primary sources from the demand-side include key opinion leaders, executives, vice presidents, and CEOs of aqua farmers through questionnaires, emails, and telephonic interviews.

Aquafeed market: Breakdown of primary participants

Aquafeed Market  Size, and Share

To know about the assumptions considered for the study, download the pdf brochure

Aquafeed Market Size Estimation

Both the top-down and bottom-up approaches have been used to estimate and validate the total size of the aquafeed market. These approaches have also been used extensively to determine the size of the various sub-segments in the market. The research methodology used to estimate the market size includes the following details:

  • The key players in the industry and market have been identified through extensive secondary research.
  • The aquafeed value chain and market size in terms of value have been determined through primary and secondary research.
  • All percentage shares, splits, and breakdowns were determined using secondary sources and verified through primary sources.
  • All macroeconomic and microeconomic factors affecting the growth of the aquafeed market were considered while estimating the market size.
  • All the possible parameters that affect the market covered in this research study have been accounted for, viewed in extensive detail, verified through primary research, and analyzed to obtain the final quantitative and qualitative data.

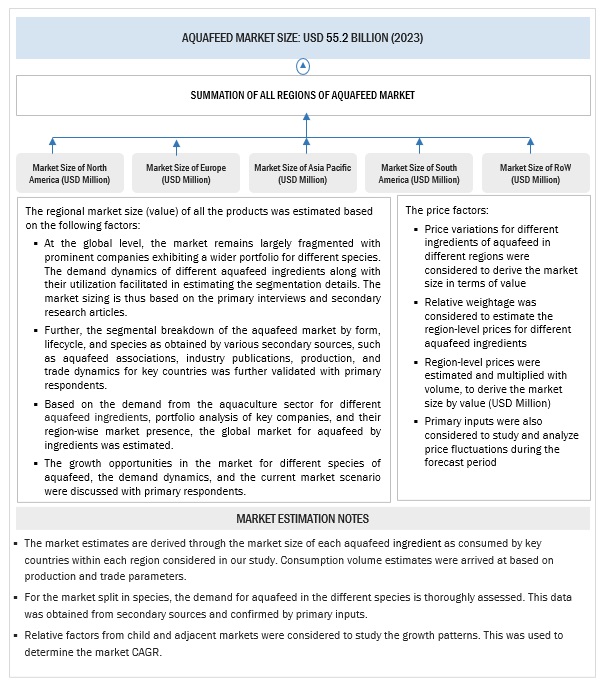
The following sections (bottom-up & top-down) depict the overall market size estimation process employed for this study.

Market size estimation: Bottom-up approach

  • In the bottom-up approach, ingredients, species, form, additives, lifecycle and region were added up to arrive at the global and regional market size and CAGR.
  • The bottom-up procedure has been employed to arrive at the overall size of the aquafeed market from the revenues of key players (companies) and their product share in the market.

Aquafeed Market size estimation: bottom-up approach

Aquafeed Market  Size, and Share

To know about the assumptions considered for the study, Request for Free Sample Report

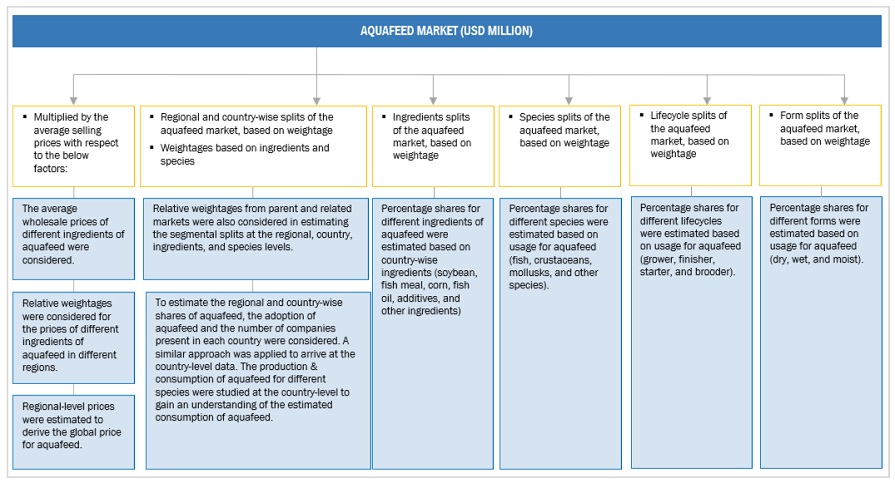
Market size estimation methodology: top-down approach

For the calculation of each type of specific market segment, the most appropriate, immediate parent and peer market sizes were used for implementing the top-down procedure.

Secondary reports from various sources like company revenues, associations, and regulatory bodies were considered. Further, appropriate weightage was assigned to the data derived from each parameter to arrive at the final shares for each region. The regional demand-supply trends, and regulatory scenario were also analyzed to further validate the shares arrived at. These shares were then confirmed with primary respondents from across regions.

Data Triangulation

After arriving at the overall market size from the estimation process explained above, the total market was split into several segments and subsegments. The data triangulation and market breakdown procedures were employed, wherever applicable, to estimate the overall aquafeed market and arrive at the exact statistics for all segments and subsegments. The data was triangulated by studying various factors and trends from the demand and supply sides. Along with this, the market size was validated using both the top-down and bottom-up approaches.

Market Definition

The commercial manufacture and sale of feed items especially created for aquatic animals reared in aquaculture operations is referred to as the "aquafeed market." Aquafeed is a unique kind of animal feed designed to satisfy the dietary needs of different aquatic animals, such as fish, prawns, mollusks and crabs. Due to the rising demand for seafood products and the depletion of wild fish stocks, aquaculture, or the growing of aquatic organisms, has seen tremendous growth in recent years. As a result, the aquaculture industry's aquafeed market has grown to be a key part, offering vital nutrients and encouraging the healthy growth and development of farmed aquatic creatures.

Key Stakeholders

  • Supply-side: Aquafeed manufacturers, suppliers, distributors, importers, and exporters
  • Feed additive manufacturers and traders
  • Demand-side: Fish farmers, farmer organizations, and seafood processors
  • Regulatory side: Concerned government authorities, commercial research & development (R&D) institutions, and other regulatory bodies.
  • Associations and industry bodies: Food and Agriculture Organization (FAO), International Feed Industry Federation (IFIF), and International Fishmeal and Fish Oil Organization (IFFO).

Report Objectives

Market Intelligence

  • Determining and projecting the size of the global aquafeed market, with respect to based on ingredients, species, additives and regional markets, over a five-year period, ranging from 2023 to 2028
  • Identifying the attractive opportunities in the market by determining the largest and fastest-growing segments across regions
  • Providing detailed information about the key factors influencing the growth of the market (drivers, restraints, opportunities, and industry-specific challenges)
  • Providing the regulatory framework for major countries related to the aquafeed market.
  • Analyzing the micro markets, with respect to individual growth trends, prospects, and their contribution to the total market

Competitive Intelligence

  • Identifying and profiling the key players in the global aquafeed market
  • Providing a comparative analysis of market leaders on the basis of the following:
    • Product offerings
    • Business strategies
    • Strengths and weaknesses
    • Key financials
  • Understanding the competitive landscape and identifying the major growth strategies adopted by players across the key regions
  • Analyzing the value chain and products across the key regions and their impact on the prominent market players
  • Providing insights on key product innovations and investments in the global aquafeed market

Available Customizations:

With the given market data, MarketsandMarkets offers customizations according to company-specific scientific needs.

The following customization options are available for the report:

Product Analysis

  • Product Matrix, which gives a detailed comparison of the product portfolio of each company

Geographic Analysis

With the given market data, MarketsandMarkets offers customizations according to the region-specific scientific needs.

  • Further breakdown of the Rest of European aquafeed market, by key country

Company Information

  • Detailed analyses and profiling of additional market players
Custom Market Research Services

We will customize the research for you, in case the report listed above does not meet with your exact requirements. Our custom research will comprehensively cover the business information you require to help you arrive at strategic and profitable business decisions.

Request Customization
Report Code
AGI 2681
Published ON
Jul, 2023
Choose License Type
BUY NOW
  • SHARE
X
Request Customization
Speak to Analyst
Speak to Analyst
OR FACE-TO-FACE MEETING
PERSONALIZE THIS RESEARCH
  • Triangulate with your Own Data
  • Get Data as per your Format and Definition
  • Gain a Deeper Dive on a Specific Application, Geography, Customer or Competitor
  • Any level of Personalization
REQUEST A FREE CUSTOMIZATION
LET US HELP YOU!
  • What are the Known and Unknown Adjacencies Impacting the Aquafeed Market
  • What will your New Revenue Sources be?
  • Who will be your Top Customer; what will make them switch?
  • Defend your Market Share or Win Competitors
  • Get a Scorecard for Target Partners
CUSTOMIZED WORKSHOP REQUEST
+1-888-600-6441
  • Call Us
  • +1-888-600-6441 (Corporate office hours)
  • +1-888-600-6441 (US/Can toll free)
  • +44-800-368-9399 (UK office hours)
CONNECT WITH US
ABOUT TRUST ONLINE
©2024 MarketsandMarkets Research Private Ltd. All rights reserved
DMCA.com Protection Status Website Feedback