Best Business Intelligence Platforms for Smart Decision-Making in 2025
October 07, 2025

Business intelligence platforms will transform how companies operate. The industry's projected value will reach $56.28 billion by 2030. This growth makes sense when you think about how essential evidence-based decisions have become in today's ever-changing business environment.


Business intelligence has become a vital pillar of success for organizations in virtually every industry. The right business intelligence software transforms raw data into useful insights that accelerate growth and innovation. The numerous business intelligence solutions available can overwhelm decision-makers, especially since each claims superiority.
Top business intelligence platforms stand out through their immediate updates. This capability lets businesses respond to developments instantly instead of playing catch-up. Organizations that make use of these advanced analytics and business intelligence platforms perform better than their competitors who stick to traditional reporting methods.
This piece examines the 12 best business intelligence platforms for 2025. You'll find detailed comparisons of features, pricing, strengths and weaknesses. Our insights will guide your selection process, whether you need sophisticated bi platforms or specialized solutions like ai sales assistant software.
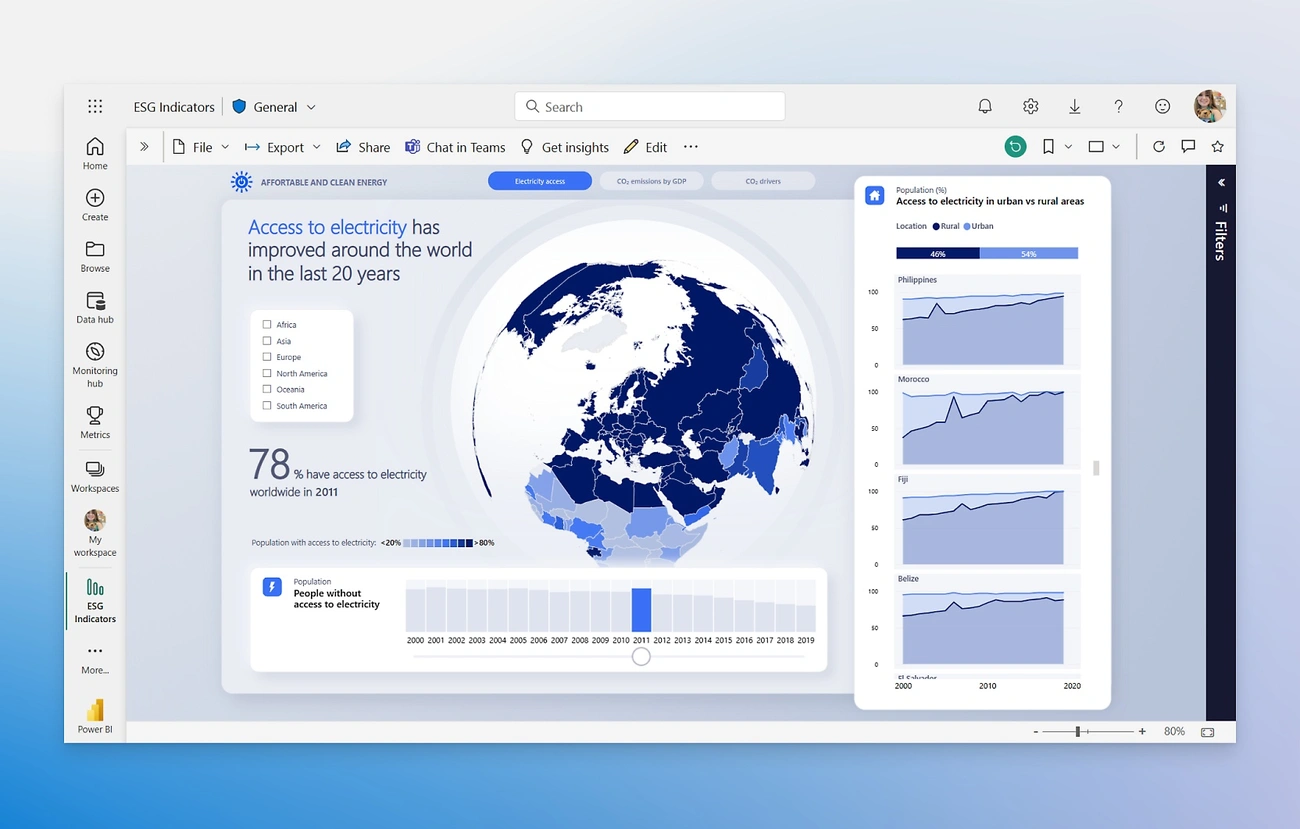
Image Source: Microsoft
Microsoft Power BI is the life-blood of business intelligence platforms, and 97% of Fortune 500 companies use it today. This dedicated analytics platform from Microsoft turns scattered data sources into clear, visually appealing insights that help make informed decisions.
Power BI connects data sources in many ways, which helps businesses build unified datasets from information that was previously isolated. The platform provides:
AI-powered analytics - Features like Copilot help non-technical users create visualizations through natural language queries
Custom visualizations - Access to marketplace visuals extends reporting capabilities beyond standard charts
Data transformation - Power Query makes complex data preparation tasks simpler
Mobile accessibility - Native apps for iOS, Android, and Windows devices keep insights available anywhere
Monthly updates - Regular feature improvements match evolving business needs
OneLake data hub integration creates a central repository for all data and establishes a single source of truth for organizations. Power BI's embedding features also let reports combine smoothly with applications, websites, and Microsoft 365 tools.
Pros:
Economical pricing model with free desktop version
Deep integration with Microsoft ecosystem (Excel, Teams, Azure)
Robust self-service analytics for non-technical users
Large global community and extensive learning resources
Powerful data compression that analyzes datasets with over 100 million rows
Cons:
Desktop app works only on Windows environments
Steep learning curve, especially with DAX (Data Analysis Expressions)
Performance issues with very large datasets
Limited responsiveness on different devices
Less NoSQL database support compared to competitors
Power BI has tiered pricing that fits various organizational needs:
Power BI Desktop: Free for individual data exploration and report authoring
Power BI Pro: USD 14.00 per user/month for sharing and collaboration capabilities
Power BI Premium Per User: USD 24.00 per user/month for advanced features
Power BI Premium: Starting at USD 4,995.00 per month for dedicated organizational capacity
Academic institutions, government agencies, and nonprofit organizations can get discounted pricing.
Power BI works well in multiple business intelligence scenarios:
Personal BI: Individual analysis with flexible report creation
Team BI: Collaborative analytics shared through Microsoft Teams
Departmental BI: Distribution of content to larger groups via Power BI apps
Enterprise BI: Large-scale deployment with Premium capacity for read-only users
The platform excels at financial reporting, sales scorecards, resource management, inventory optimization, and claims management. Organizations in healthcare, manufacturing, retail, and finance use Power BI to turn complex spreadsheets into useful visualizations that guide strategic decisions.
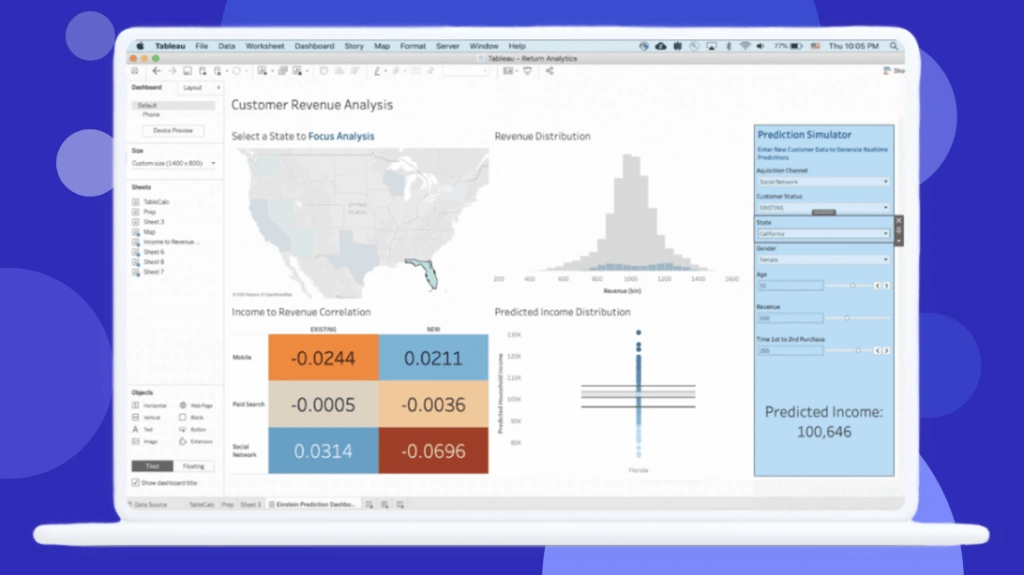
Image Source: www.tableau.com
Tableau has grown into a powerhouse in visual analytics since 2003. The platform helps organizations turn complex data into applicable information through its user-friendly interface. The company focuses on making data analysis detailed and interactive for users at every skill level.
Tableau turns raw numbers into compelling visual stories with these reliable features:
Interactive dashboards that let users participate with data using filters and editing tools for immediate insights
Broad data integration supporting connections to cloud services, databases, and web data connectors
Geospatial visualization capabilities for creating location-based reports with multiple layers
Data blending tools that combine information from different sources without manual reconciliation
Mobile adaptability letting users view visualizations from any device
Advanced analytics with statistical models, regression analysis, and trend forecasting
Integration with R and Python for custom analytics models and machine learning
Pros:
Data visualization capabilities that outperform competitors
User-friendly drag-and-drop interface available to non-technical users
Dashboard performance remains strong with millions of data rows
More data type integrations than most competitors
Excellent customer support and active online community
Cons:
Costs more than prominent rivals like Power BI
Users need SQL skills to make use of database connections
Limited data preparation tools need work in other applications
Report refreshing lacks scheduling options
Custom formatting takes considerable time and effort
Tableau Cloud (formerly Tableau Online) comes with three main subscription tiers:
Viewer: USD 15.00 per user/month - for dashboard viewing and basic interactivity
Explorer: USD 42.00 per user/month - adds web authoring capabilities
Creator: USD 75.00 per user/month - has Tableau Desktop, Prep Builder, and full authoring
Enterprise editions offer advanced management features at premium rates:
Enterprise Creator: USD 115.00 per user/month
Enterprise Explorer: USD 70.00 per user/month
Enterprise Viewer: USD 35.00 per user/month
Tableau Server uses similar subscription rates but adds infrastructure costs and needs at least one Creator license.
Tableau excels in analytics of all types:
Financial reporting and budget planning analysis
Marketing campaign tracking and web analytics
Healthcare analytics for patient demographics and departmental trends
Sales performance monitoring with pipeline coverage and win/loss analysis
Human resources for tracking employee turnover and satisfaction
Manufacturing process management with drillable dashboards for issue identification
Customer experience improvement through visualized customer data
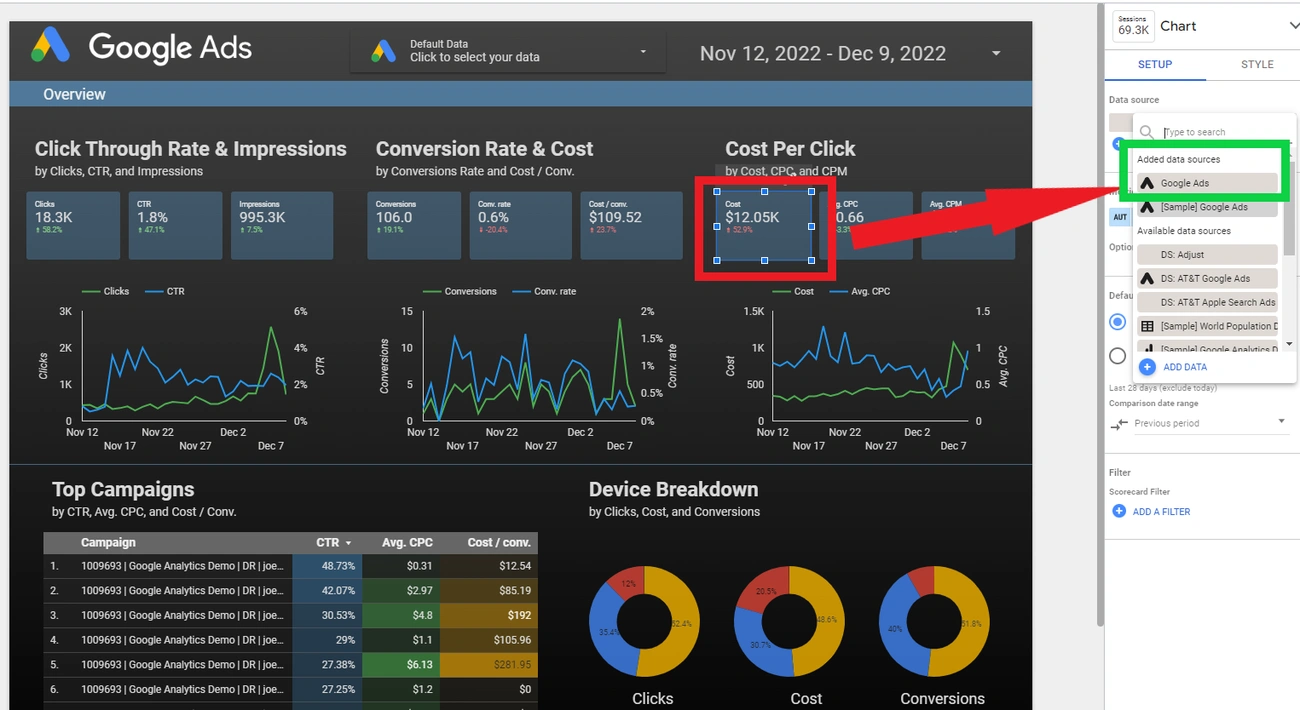
Image Source: Search Engine Journal
Looker Studio (formerly Google Data Studio) is a free data visualization tool that turns complex information into easy-to-understand, shareable dashboards and reports. This business intelligence platform has become popular among organizations looking for budget-friendly ways to visualize their data.
Looker Studio comes with powerful capabilities for business intelligence:
Drag-and-drop interface that makes report creation simple through user-friendly design elements
Customizable dashboards with extensive branding options including text, images, and interactive elements
Broad data integration with native connectors for Google services and over 800 data sources through third-party partners
Visualization variety including charts, maps, graphs, paginated tables, and pivot tables
Real-time collaboration lets team members work together on reports
Embedding options let you add reports directly to websites or applications
Pros:
Free for simple usage and Google data sources
Cloud-based service needs no infrastructure management
Smooth integration with Google's ecosystem (Analytics, BigQuery, Sheets)
Detailed access controls and sharing options
Easy learning curve for users who know Google products
Live data connections support
Cons:
Data blending limited to five sources
Dashboards cannot auto-refresh
Large datasets or complex functions slow down performance
Organizations with strict security requirements cannot deploy on-premise
Complex visualizations are limited compared to competitors like Tableau
Some common cloud-based sources like Hubspot lack native connector support
The pricing model is straightforward:
Looker Studio (Free): Creators and report viewers pay nothing for Google data sources
Looker Studio Pro: USD 9.00 per user per project monthly with extra administrative features
Third-party connectors: Monthly costs range from USD 20.00 to USD 350.00 based on the connector
Looker Studio works best in these business intelligence scenarios:
Marketing teams need to analyze campaign performance metrics
Small to medium-sized businesses already use Google's suite of tools
Educational institutions and non-profits can use the free tier for data visualization
Organizations with Google-centric data architecture need quick insights
Collaborative environments require multiple team members to access simultaneously
Image Source: Zoho
Zoho Analytics stands out as an AI-powered business intelligence platform that earned recognition in the 2025 Gartner Magic Quadrant for Analytics and Business Intelligence Platforms. This tool serves organizations that need budget-friendly yet complete data analysis capabilities through its self-service approach.
Zoho Analytics shines with several impressive capabilities:
Extensive data integration connecting to over 500+ sources
Visual pipeline builder that creates ETL data pipelines
AI-powered insights through Zia, the built-in AI assistant
Conversational analytics that lets you use natural language queries
Interactive dashboards with customizable visualization options
Collaborative features that enable team-based analysis and sharing
The platform includes predictive analytics capabilities, anomaly detection, and cluster visualization tools to help businesses spot patterns and predict trends.
Pros:
User-friendly interface that works well for non-technical users
Budget-friendly pricing compared to competitors
Rich selection of data visualization options
AI-driven insights that highlight relevant observations
Cons:
Data manipulation capabilities are limited for complex analysis
Large datasets can cause performance issues
New users face a steep learning curve
Premium competitors offer more advanced features
Customization options are restricted
Zoho Analytics comes with flexible pricing options:
Free Plan: 2 users and 10,000 rows
Basic Plan: Starting at USD 25.00/month for 2 users and 500,000 rows
Standard Plan: Perfect for growing teams with more data needs
Professional Plan: Suits advanced analytics requirements
Enterprise Plan: Designed for large-scale deployments
Annual billing brings a 20% discount on all paid plans.
Zoho Analytics proves valuable in many business scenarios:
Sales teams that need to track performance metrics and conversion rates
Marketing departments looking to measure campaign effectiveness
Finance teams wanting simpler reporting and expense tracking
Manufacturing operations that monitor production cycles
Small to medium businesses looking for budget-friendly BI solutions without sacrificing capabilities
Customer testimonials show that organizations using Zoho Analytics cut their report creation time by 50% and reduced software expenses by 30%.
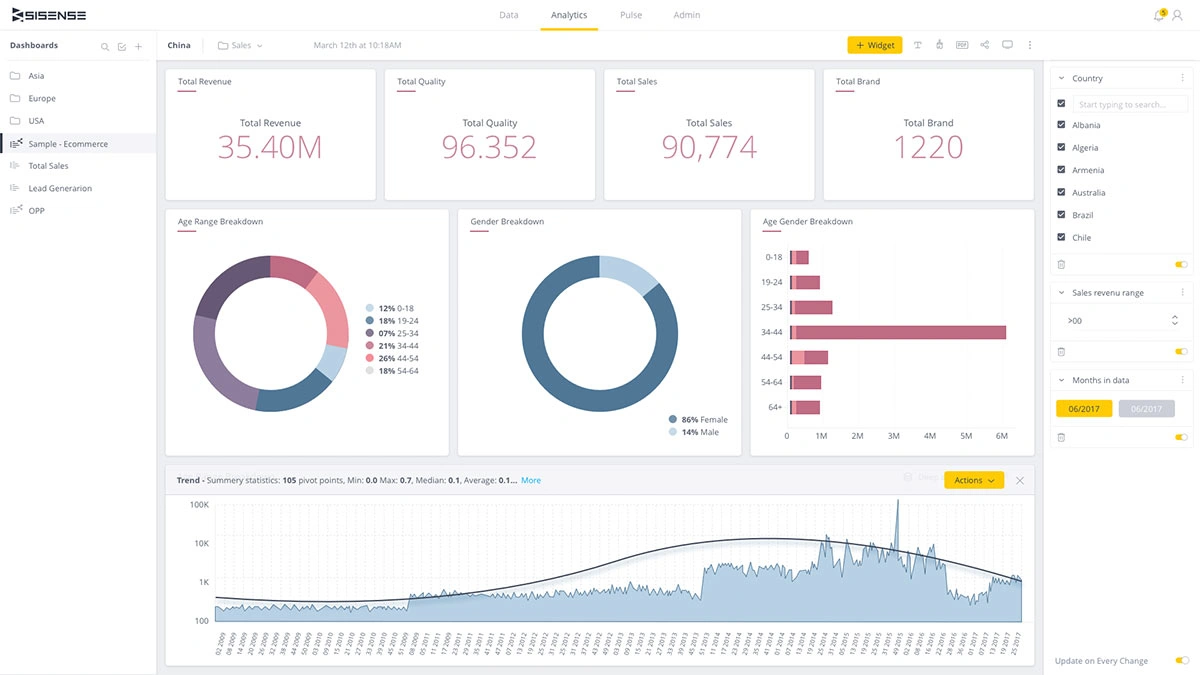
Image Source: Sisense
Sisense stands out as an AI-powered business intelligence platform with its unique analytical engine that processes large data volumes quickly. Organizations value this platform for its strong visualization features and advanced data modeling options.
The platform offers complete analytics through these notable capabilities:
Sisense Intelligence - A unified suite of AI capabilities that brings artificial intelligence to every layer of the platform
ElastiCube technology - Proprietary analytical database that uses columnar storage for faster processing of large datasets
Flexible deployment - Options for cloud, on-premises, or hybrid setups that meet business needs
Dashboard co-authoring - Makes shared dashboard building and editing possible in real time
Natural language interface - Users can ask questions about their data through apps like Slack

Pros:
Large datasets perform better with in-chip processing instead of in-memory processing
Reliable embedded analytics capabilities that integrate into other products
This full-stack tool needs less IT support or expert resources
Connects well with third-party applications and analytics tools
Advanced data visualization includes interactive multidimensional widgets for deeper analysis
Cons:
Learning takes longer compared to other self-service BI tools
Small organizations might find the higher prices challenging
Pricing details need lengthy sales discussions
Non-technical users struggle with ElastiCube's complex setup
Training, onboarding, and upgrades cost extra
The platform uses custom pricing based on each organization's needs:
Self-hosted solutions start at USD 10,000 yearly for five users
Cloud-based options begin at USD 21,000 per year for five users
Enterprise plans range from USD 25,000 to over USD 100,000 yearly
User count, data volume, deployment type, and usage intensity affect pricing
The company works with customers to create custom solutions without hidden costs
Sisense works best for:
Organizations that need quick analysis of large, complex datasets
Companies wanting to add analytics features to their products
Data-heavy industries like finance, healthcare, and logistics
Companies like Nasdaq, Philips Healthcare, Air Canada, NBC Universal, and ZoomInfo use it
Clinical trials and patient monitoring need quick translation of complex data into clear insights
Image Source: Qlik
Qlik Sense powers business intelligence with its unique associative engine. Users can explore data freely without the limitations of traditional query-based tools. The platform shows relationships, outliers, and connections that stay hidden in complex datasets.
Qlik Sense stands out with these innovative capabilities:
Associative model that shows selected values in green, associated values in white, and unrelated values in gray for easy data exploration
AI-powered augmented analytics that creates insights automatically, enables search-based discovery, and supports natural language interactions
Interactive dashboards that refresh instantly when users take action
Self-service creation with drag-and-drop features for non-technical users
Data storytelling tools that create compelling narratives from analytics
QIX engine that indexes and compresses data into binary format for better performance
Pros:
Easy-to-use associative data model that shows hidden connections
Many customization options through APIs and extensions
Mobile features with offline analysis and interactive notifications
Immediate data intelligence that helps make informed decisions
Strong visualization features that adapt to screen size changes
Cons:
New users face a steep learning curve
Large datasets cause performance issues
Costs more than some competitors with extra charges for add-ons
Few formatting options for visualizations and tables
Technical problems with iOS and large file handling
Qlik has several pricing tiers for different organizational needs:
Starter: USD 200.00/month for 10 users (billed annually)
Standard: USD 825.00/month for 25GB data (billed annually)
Premium: USD 2,750.00/month for 50GB data (billed annually)
Enterprise: Custom pricing for organizations that need maximum flexibility
Each plan includes different data capacity levels. Organizations can buy additional storage.
Qlik Sense works best in these business scenarios:
Financial analysis and budget planning with interactive visualizations
Manufacturing operations monitoring to spot production issues
Healthcare analytics for patient safety and clinical trials
Sales performance tracking with immediate metrics
Organizations that analyze complex data relationships from multiple sources
Large companies like Lenovo use Qlik to turn data into proactive analytics. Samsung uses its mobile features to focus on practical insights instead of noise.
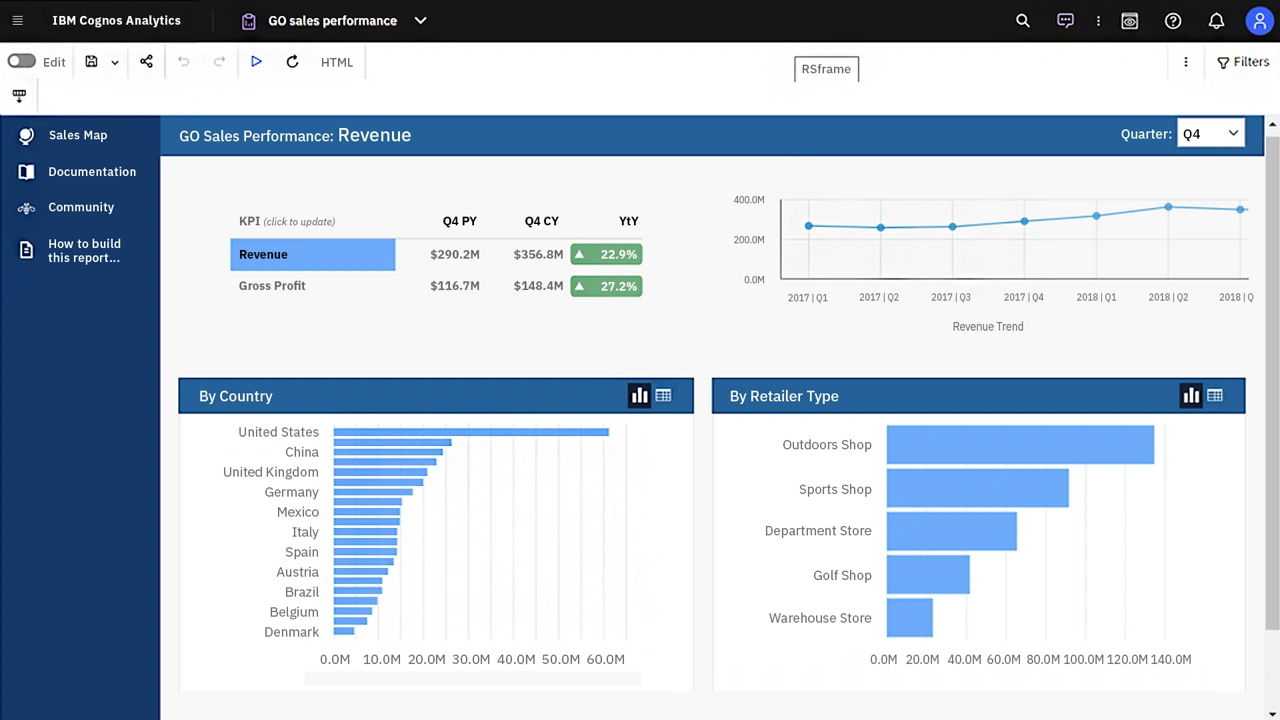
Image Source: IBM
IBM Cognos Analytics stands out as a complete web-based business intelligence suite built for organizations of all sizes. The platform earned its position as a Leader in the 2025 IDC MarketScape for Business Intelligence. Traditional BI capabilities combined with AI-driven features help deliver useful insights.
IBM Cognos Analytics provides a resilient set of tools for data analysis:
AI Assistant - Users can ask questions in natural language and receive answers with presentation-ready dashboards
Advanced reporting - Users create customizable, multipage reports in various formats including HTML, CSV, PDF, and Excel
Interactive dashboards - Quick creation of compelling, live visualizations through drag-and-drop functionality
Data exploration - Time series modeling predicts trends without requiring a data science background
Jupyter Notebook integration - Greater flexibility in data preparation and statistical analysis
The platform supports multiple deployment options. These include cloud-hosted, on-premises, containerized, and IBM Cloud Pak for Data.
Pros:
Makes shared and sharing features work smoothly for teams
Excellent report generation from data warehouses
User-friendly design simplifies employee training
Strong data governance capabilities among self-service analytics
Flexible deployment options support cloud and on-premises environments
Cons:
Performance slows during drill-down operations in reports
Users need proper training, especially those unfamiliar with SQL
Setup process involves a steeper learning curve
Higher cost compared to competing solutions
Reports and Dashboards modules lack full integration
IBM Cognos Analytics comes with a tiered pricing structure:
Free Trial: 5 users can access it monthly
Standard Plan: Prices start at USD 10.00 per user monthly
Premium Plan: Prices start at USD 40.00 per user monthly
This business intelligence tool excels in several scenarios:
Marketing analytics - Campaign analysis flows smoothly with clear metric visualization
Operational optimization - AI-driven tools predict trends and improve workflows
Sales performance - Teams access data live to achieve targets
Enterprise reporting - Scheduled distribution of standardized reports works efficiently
Financial analysis - Budget tracking and forecasting capabilities deliver detailed insights
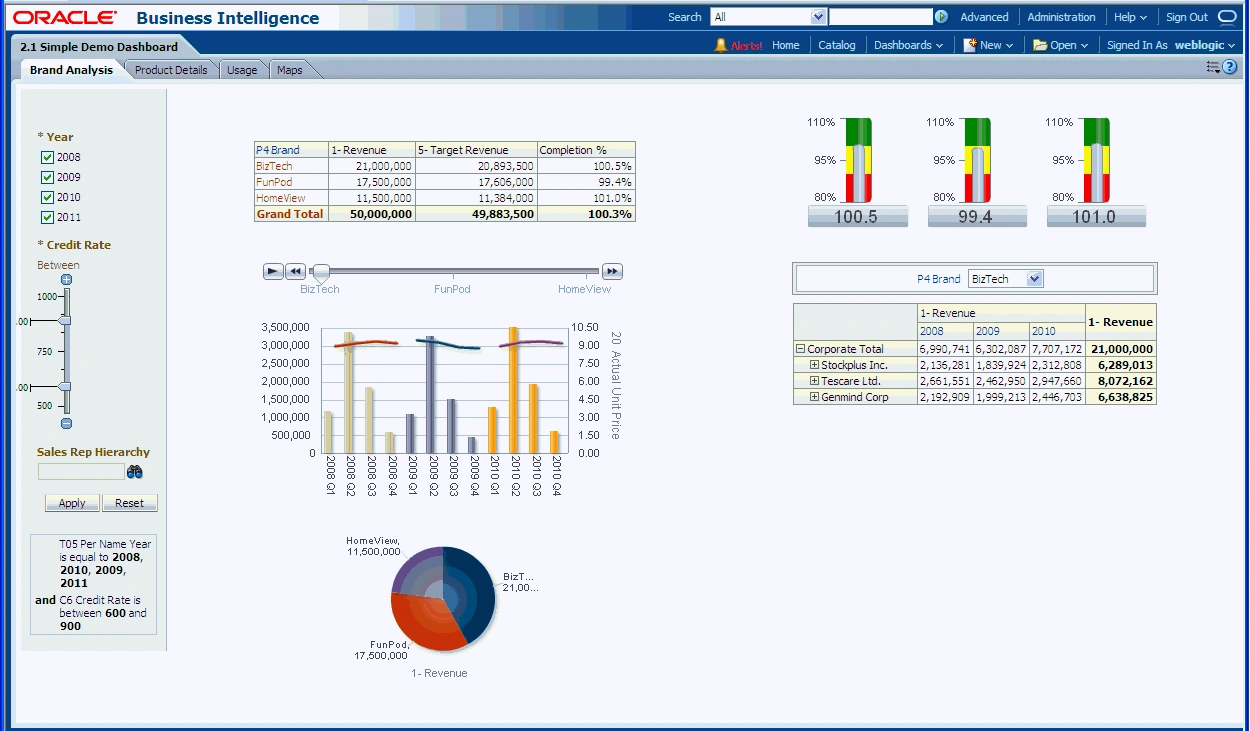
Image Source: Oracle Help Center
Oracle Business Intelligence provides a complete set of enterprise performance management tools that give users detailed data access and analysis capabilities. The platform blends data sources from a variety of locations into a single, useful framework that helps organizations make better decisions.
Oracle BI comes with several powerful components:
BI Server - A flexible infrastructure that optimizes concurrency and parallelism to access enterprise-wide data
BI Answers - The web architecture lets users create interactive charts and reports through genuine end-user ad hoc capabilities
Interactive Dashboards - Users get individual-specific, role-based access to live reports and visualizations
BI Publisher - Users can create flexible reporting solutions that work in complex environments
Real-Time Decisions - The system combines rules and predictive analytics to adapt enterprise decision management
Pros:
Exceptional flexibility in multiple environments
Smooth integration with other Oracle products and Microsoft Office
Resilient infrastructure for data modeling and metadata management
Detailed reporting features with many formatting options
Advanced data visualization that communicates insights clearly
Cons:
Premium pricing starts at USD 150.00 monthly
The interface looks outdated
Dashboard customization options are limited
Large datasets might cause slowdowns
Setup and maintenance need expert knowledge
The platform costs USD 150.00 per month to start. Oracle doesn't offer free trials or versions. Enterprise pricing changes based on deployment choices and company requirements.
Oracle BI works best for:
Company-wide performance management and strategy creation
Financial analysis and operations improvement
Teams sharing data across departments
Marketing campaign tracking and revenue predictions
Supply chain improvements and supplier performance monitoring
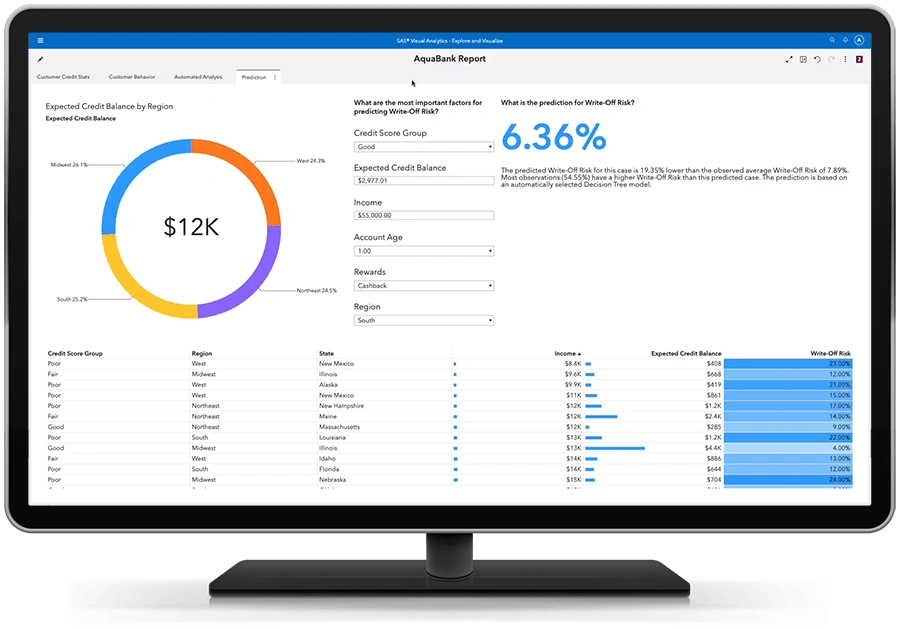
Image Source: SAS
SAS Business Intelligence combines powerful analytics with complete data management to provide insights from many data sources. SAS has been a key player in analytics for years and creates solutions that organizations need for deep statistical work.
SAS BI includes these complete tools:
Data consolidation from multiple sources into a single platform
Customizable reporting that supports PDF, Excel, and HTML formats
Interactive dashboards with charts and heat maps
Advanced analytics with predictive modeling and statistical analysis
Mobile applications for iOS and Android devices
Security through role-based access controls
Pros:
Strong statistical and predictive analytics capabilities
Adaptable solutions for organizations of all sizes
Complete data governance features
Reports load quickly through memory optimization
Cons:
High costs limit accessibility
New users face a steep learning curve
Cloud deployments struggle during internet outages
Systems need extra RAM to work well
File sharing has limitations
Users pay between USD 75.00 and USD 150.00 monthly. Enterprise users might spend up to USD 9,000.00 yearly.
SAS BI works best in environments that need:
Complex statistical analysis and regulatory compliance
Advanced predictive modeling
Processing large amounts of data
Financial and operational analytics
Healthcare and pharmaceutical research
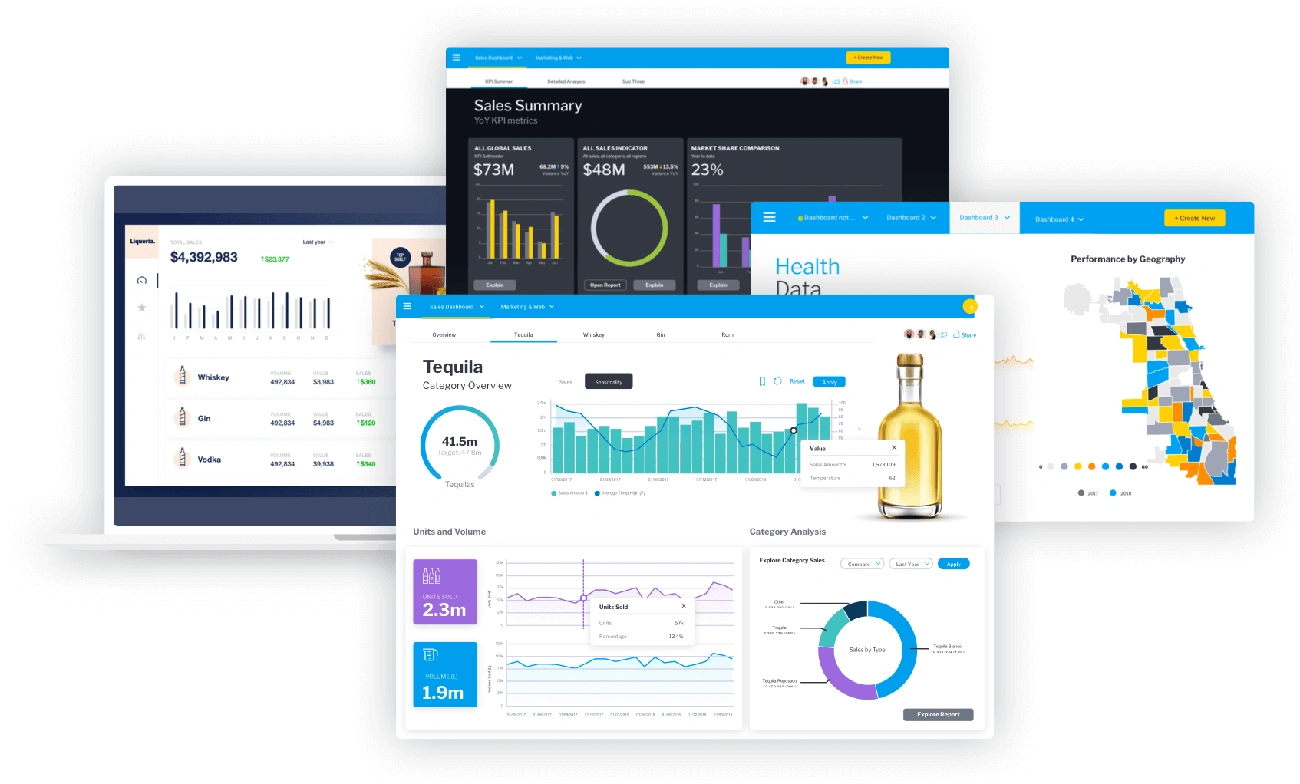
Image Source: Yellowfin
Yellowfin BI has specialized in data storytelling and embedded analytics since 2003. The platform helps organizations find opportunities hidden in their data and turns complex information into practical insights through a modular business intelligence approach.
Yellowfin provides a detailed suite of analytics tools:
Complete modules for creating and sharing analytic content without importing data
Data storytelling capabilities for creating long-form narratives that come alive with rich data content
Automated insights powered by machine learning that spot important patterns and anomalies
Customizable dashboards that show key performance indicators at a glance
White-label analytics with full control over presentation design elements
Pros:
Analytics easily embed into applications
AI-powered natural language queries help non-technical users
Brand-specific UI customization options
Mobile app feels like a familiar social platform
Powerful data visualization tools
Cons:
New users face a steep learning curve
Data warehousing support falls below industry average
Basic data preparation tools
Struggles with very large datasets
Yellowfin offers three flexible pricing models:
Aligned Utility Model: Prices match your analytics usage units
Revenue Share Model: Costs link to value from add-on analytics modules
Server Core: Fixed prices based on server deployment needs
Each option brings predictable costs without hidden fees.
Yellowfin works best for:
Embedded analytics for software companies that need white-label analytics
Enterprise analytics for management and operational reports
SaaS platforms that want premium analytics as upsell features
Data-focused organizations that need automated business monitoring
Image Source: www.clearanalyticsbi.com
Clear Analytics brings business intelligence directly into Microsoft Excel. The platform removes the typical software learning curve by connecting spreadsheets with advanced data analysis tools.
Clear Analytics makes data analysis simple through Excel:
Excel integration - Works within the existing Excel environment, requiring no migration or training
Self-service analytics - Users can access data without depending on IT teams
Governance controls - Maintains centralized storage with version control and full audit capabilities
Power BI integration - Combines data from multiple sources and uses Microsoft Power BI features
Query builder - Accessible interface helps non-technical users explore database information
Pros:
Excel's familiar interface reduces training needs
Departments can share data securely through sophisticated access controls
Complete audit trail with version control
Reports are easy to create with drag-and-drop features
Cons:
Works only with Windows environments
Limited options for mobile access
Users without Excel experience might face challenges
Clear Analytics comes with these pricing options:
Monthly subscriptions range from USD 8.00 to USD 11.00
Free trial available to test the platform
Small Business edition includes optional enterprise features at extra cost
The platform works best when:
Companies rely heavily on Excel for data analysis
Business users need to work with complex databases
Teams want to share and access data together
Departments must share information securely without IT delays
|
Platform |
Key Features |
Starting Price |
Main Pros |
Main Cons |
Best Use Cases |
|
Microsoft Power BI |
- AI-powered analytics with Copilot |
Free (Desktop) |
- Affordable pricing |
- Desktop app Windows-only |
- Financial reporting |
|
Tableau |
- Interactive dashboards |
$15/user/month (Viewer) |
- Superior visualization capabilities |
- Higher pricing |
- Financial reporting |
|
Looker Studio |
- Drag-and-drop interface |
Free (Basic) |
- Free for simple usage |
- Limited to 5 data sources |
- Marketing analytics |
|
Zoho Analytics |
- 500+ data sources |
Free (Limited) |
- User-focused interface |
- Limited data manipulation |
- Sales analytics |
|
Sisense |
- AI-powered analytics |
$10,000/year (5 users) |
- Exceptional large dataset handling |
- Steep learning curve |
- Large dataset analysis |
Your organization's needs, technical capabilities, and budget will determine the best business intelligence platform for you. In this piece, we looked at twelve leading BI solutions that turn raw data into useful insights.
Microsoft Power BI is an affordable solution that works great with Microsoft's ecosystem. Tableau leads the pack with its visualization features. Teams already using Google's ecosystem can start with Looker Studio for free. Zoho Analytics gives you detailed analytics at a good price, especially when you use other Zoho products.
Big companies dealing with huge datasets have solid options. Sisense uses ElastiCube technology while Qlik Sense relies on its unique associative model. Large organizations needing reliable statistical and enterprise features can look to IBM Cognos Analytics, Oracle BI, or SAS Business Intelligence.
Yellowfin BI stands out because of its storytelling features and embedded analytics. Clear Analytics works well for Excel-focused companies that want to improve their existing workflows.
AI-powered features are becoming common across platforms as the BI world changes faster than ever. Your choice should match both today's needs and tomorrow's growth. User adoption, training needs, and how well it connects with other tools should guide your decision.
Start by getting a full picture of your data sources, user skills, and what kind of analysis you need. Free trials and limited versions are a great way to get hands-on experience before making a big investment.
A good BI platform does more than crunch numbers - it becomes a key asset that enables your team to make smarter, informed decisions to stimulate growth and stay ahead of competitors.
The main differences lie in features, pricing, ease of use, and integration capabilities. For example, Microsoft Power BI offers deep Microsoft ecosystem integration and affordable pricing, while Tableau excels in data visualization. Sisense stands out for handling large datasets, and Looker Studio provides a free entry point for Google-centric organizations.
AI-powered features in BI tools, such as natural language processing and automated insights, help users quickly identify patterns, anomalies, and trends in data. They also enable non-technical users to query data using conversational language, making analytics more accessible across organizations.
Key factors include your organization's data sources, user skill levels, specific analytical needs, budget, scalability requirements, and integration capabilities. It's also important to consider the platform's visualization options, mobile accessibility, and collaboration features.
Yes, several platforms offer free or low-cost options. Microsoft Power BI has a free desktop version, Looker Studio (formerly Google Data Studio) is free for basic usage, and Zoho Analytics provides a free plan for limited use. These can be good starting points for small businesses or those new to BI.
Data visualization is crucial in BI platforms as it helps transform complex data into easily understandable visual formats. Strong visualization capabilities, like those found in Tableau or Power BI, enable users to create compelling, interactive dashboards that facilitate quick insights and decision-making.