
3D Camera Market Size, Share & Trends, 2025 To 2030

3D Camera Market Size, Share, Growth & Trends by Image Detection Technique (Time of Flight, Structured Light, Stereoscopic Vision), Type (Target, Target-free), Application (Still Photography, Video Recording), End Use (ADAS, Robotics, Machine Vision) - Global Forecast to 2030


3D CAMERA MARKET SIZE, SHARE & TRENDS
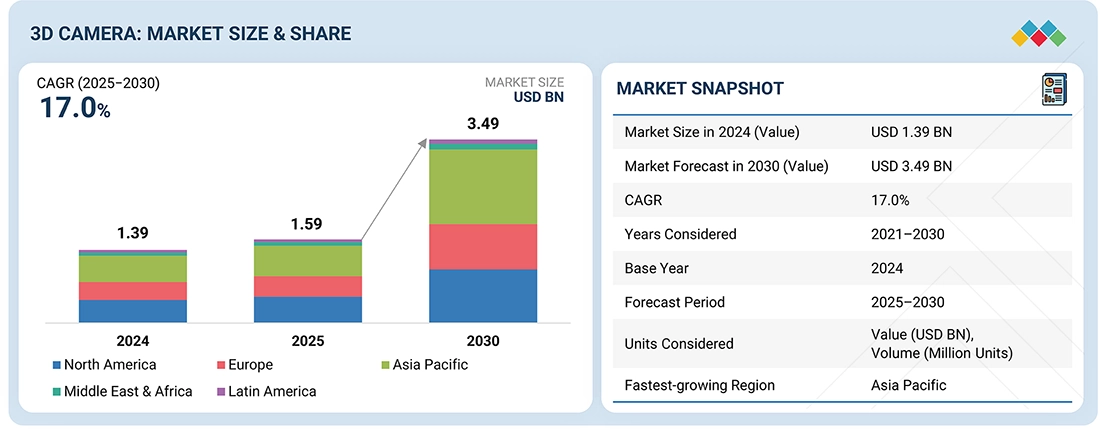
According to Marketsandmarkets, the global 3D camera market size was valued at USD 1.59 billion in 2025 and is projected to reach USD 3.49 billion by 2030, growing at a CAGR of 17.0% from 2025 to 2030. A 3D camera is an imaging device that captures depth information along with standard two-dimensional visuals, resulting in a three-dimensional view of a scene or object.
MARKET SNAPSHOT TABLE
| REPORT METRIC | DETAILS |
|---|---|
| Market Size Value in 2025 | USD 1.59 billion |
| Revenue Forecast in 2030 | USD 3.49 Billion |
| Growth Rate | CAGR of 17.0% from 2025-2030 |
| Years Considered | 2021-2030 |
| Base Year | 2024 |
| Forecast Period | 2025-2030 |
| Units Considered | Value (USD Million/Billion) and Volume (Million Units) |
| Report Coverage | Revenue forecast, company ranking, competitive landscape, growth factors, and trends |
| Segments Covered |
|
| Regional Scope | North America, Europe, Asia Pacific, Middle East & Africa, and South America |
| Top Companies |
|
| Growth Drivers |
|
Market Size & Forecast
KEY TAKEAWAYS
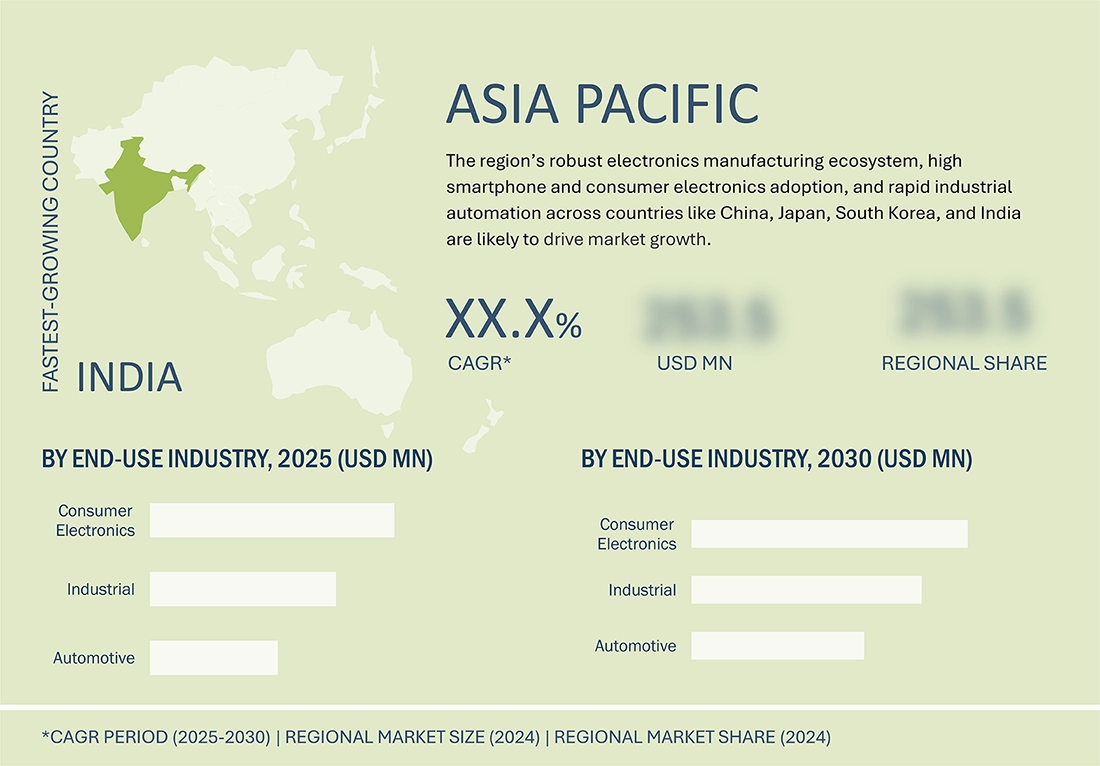
- Asia Pacific 3D camera market accounted for a 35.9% revenue share in 2024.
- By Image Detection Technique, the time of flight segment is expected to register the highest CAGR of 19.7%.
- By Type, the target camera segment is expected to dominate the market.
- By End-User Industry, the automotive segment will grow the fastest during the forecast period.
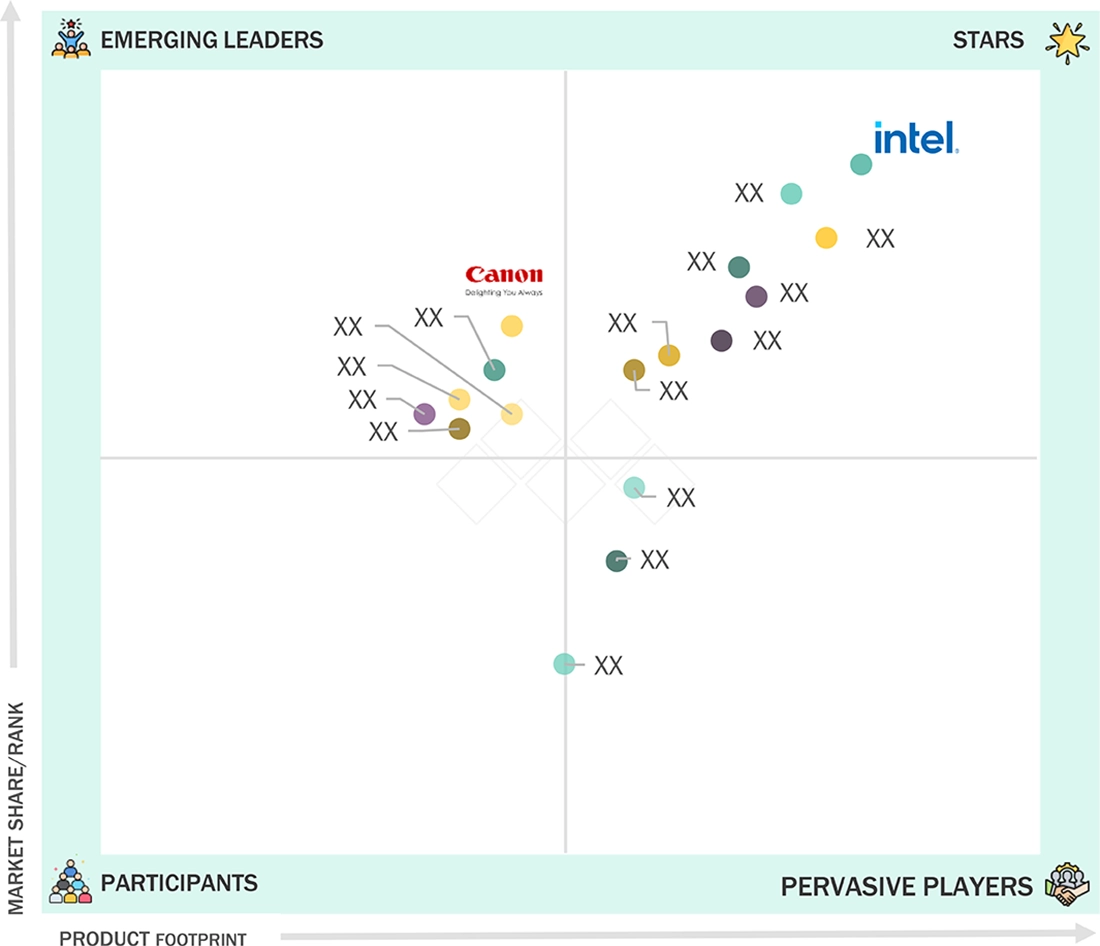
- Intel Corporation, Sony Corporation, and Hikrobot Co., Ltd. were identified as some of the star players in the 3D Camera Market (global), given their strong market share and product footprint.
- Realsee, Insta360, and Zivid among others, have distinguished themselves among startups and SMEs by securing strong footholds in specialized niche areas, underscoring their potential as emerging market leaders.
The 3D camera market size is expected to grow rapidly over the next decade, driven by the integration of 3D cameras into consumer devices like smartphones and gaming consoles. Major brands such as Apple (US) and Samsung (South Korea) are actively incorporating advanced 3D cameras into their latest smartphone models, which is likely to boost global consumer adoption. This trend indicates an increased demand for high-quality imaging and interactive user experiences, fueling market growth.
Source: Secondary Research, Interviews with Experts, MarketsandMarkets Analysis
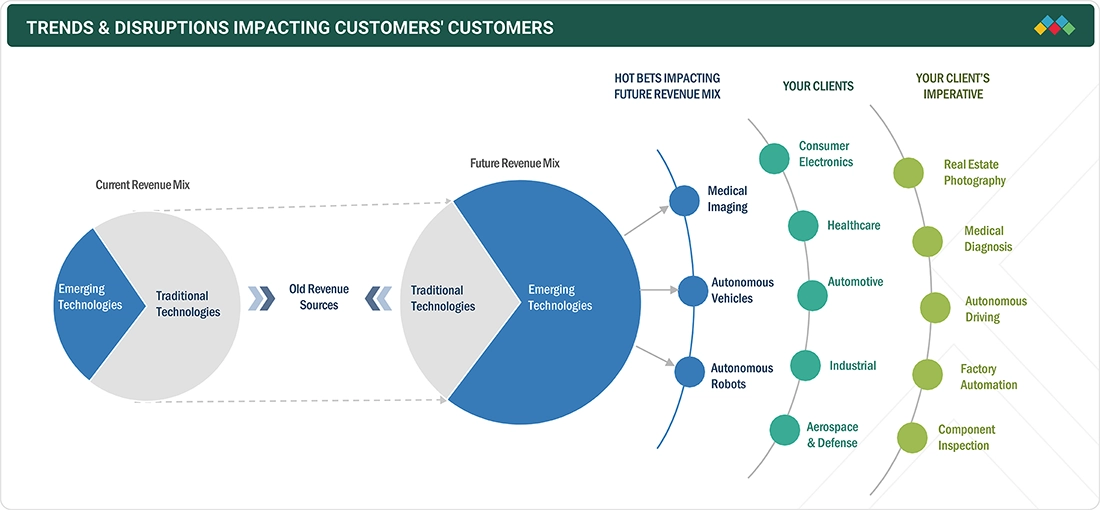
TRENDS & DISRUPTIONS IMPACTING CUSTOMERS' CUSTOMERS
Several notable trends and disruptions are impacting the market. Thanks to advances in 3D technology, the industry is continually evolving, with new innovations regularly emerging. This has driven up the demand for 3D cameras, particularly in entertainment, gaming, and virtual reality. As the need for higher quality images and videos grows, smartphone makers are adding 3D cameras to their devices, increasing consumer electronics demand. Healthcare is also a key market for 3D cameras, offering applications in medical imaging, surgical planning, and virtual reality simulations.
Source: Secondary Research, Interviews with Experts, MarketsandMarkets Analysis
MARKET DYNAMICS
Level
-
Wide applications of 3D imaging

-
Increasing adoption of industrial robots

Level
-
High product price due to limited demand

-
Technological limitations associated with 3D cameras

Level
-
Growth of AR/VR

-
Advancements in 3D printing

Level
-
Increase in 3D camera production cost due to use of specialized hardware and software

-
Significant barriers to enter 3D camera market

Source: Secondary Research, Interviews with Experts, MarketsandMarkets Analysis
Driver: Wide applications of 3D imaging
One of the primary drivers for the 3D camera market growth is the increasing demand for 3D imaging in various applications such as medical imaging, entertainment, automotive, and surveillance. For instance, using 3D cameras in healthcare can enhance the quality of care, improve patient outcomes by providing more accurate diagnostic and treatment information, enhance surgical planning, improve the design of medical devices, and improve access to healthcare services. In healthcare, 3D cameras are used for several applications, such as surgical planning, telemedicine, wound care, prosthetics, etc.
Restraint: High product price due to limited demand
3D cameras tend to be more expensive than traditional ones because they utilize advanced technology. The software and hardware needed to process and store 3D data also contribute to the higher cost; additionally, the market is limited by low demand for 3D cameras. While essential in certain industries and applications, such as robotics or computer vision, the wider consumer market has not yet fully embraced the technology. Consequently, the low production volume of 3D cameras can increase their price.
Opportunity: Growth of AR/VR
The growth of 3D cameras has been essential in advancing innovation and progress in augmented reality (AR) and virtual reality (VR). For instance, 3D cameras record detailed information, enabling more realistic and immersive AR/VR experiences. This makes users feel more connected to the virtual environment. Additionally, 3D cameras can track body movements and gestures, allowing for more natural and intuitive interactions with virtual objects, letting users use hand gestures to manipulate objects in AR/VR settings.
Challenge: Increase in 3D camera production cost due to use of specialized hardware and software
The production costs for 3D cameras tend to be high because of the specialized hardware and software needed to capture and process 3D images and videos. This often makes 3D cameras more expensive than traditional 2D cameras, which can limit their use in certain industries or applications. For instance, the sensors used in 3D cameras are generally more costly than those in 2D cameras. Time-of-flight (ToF) sensors, commonly found in 3D cameras, are expensive because of their high accuracy and speed. Also, the demand for 3D cameras is currently limited, leading to lower production volumes. This can drive up the cost for each unit.
3D Camera Market Trends: COMMERCIAL USE CASES ACROSS INDUSTRIES
| COMPANY | USE CASE DESCRIPTION | BENEFITS |
|---|---|---|
 |
Capturing 360-degree images of users’ outfits to provide personalized fashion recommendations | Enables users to make informed style choices with a fully interactive 3D view of their outfits |
 |
Capturing high-quality 2D and 3D aerial images and videos for immersive photography and videography | Provides users with professional-grade aerial imaging, enhancing visual detail and immersive viewing experiences |
 |
Capturing a 3D map of the user’s face for secure facial recognition and authentication in the iPhone X | Enhances device security and accuracy by preventing spoofing with 2D images or videos |
Logos and trademarks shown above are the property of their respective owners. Their use here is for informational and illustrative purposes only.
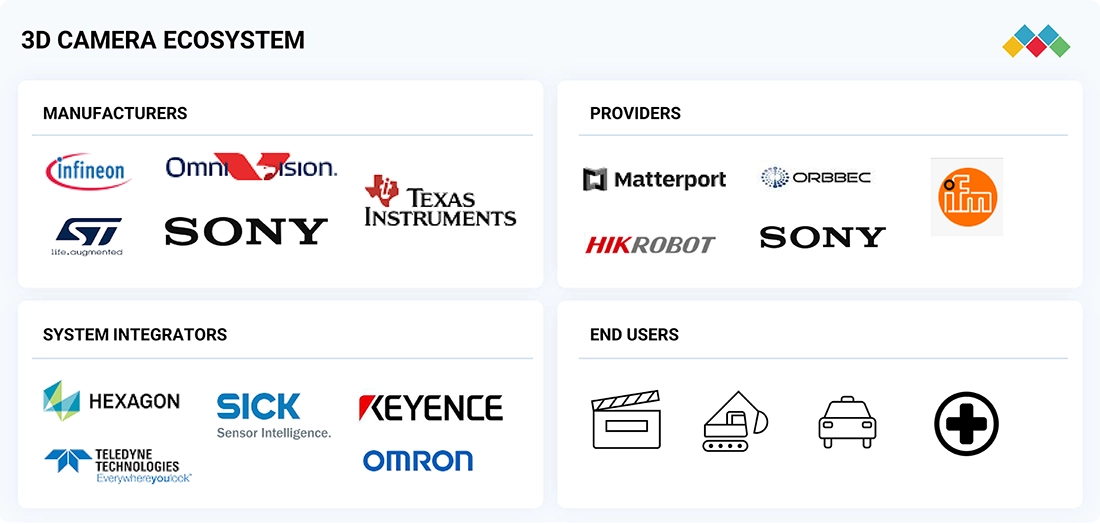
MARKET ECOSYSTEM
The 3D camera market ecosystem comprises a diverse network of component manufacturers, 3D camera providers, system integrators, and end users. Component manufacturers supply key parts such as image sensors, lenses, and processors that enable depth sensing and 3D imaging. 3D camera providers integrate these components with advanced software to deliver complete imaging solutions tailored for applications like industrial automation, consumer electronics, and autonomous vehicles. System integrators play a crucial role in embedding these cameras into broader systems such as robotics, surveillance, and AR/VR platforms ensuring seamless operation and compatibility. End users across sectors including entertainment, healthcare, and manufacturing leverage these technologies to enhance precision, visualization, and automation efficiency.
Logos and trademarks shown above are the property of their respective owners. Their use here is for informational and illustrative purposes only.
MARKET SEGMENTS
Source: Secondary Research, Interviews with Experts, MarketsandMarkets Analysis
3D Camera Market, By Image Detection Technique
Time of flight accounted for the largest share of the overall market in 2024, and this trend is expected to continue during the forecast period. The segment is driven by its ability to provide fast, accurate, and reliable depth sensing in real time, making it suitable for a wide range of applications such as smartphones, autonomous vehicles, robotics, and industrial automation. ToF cameras measure distance by calculating the time light takes to travel to and from an object, delivering precise depth maps even in low-light conditions.
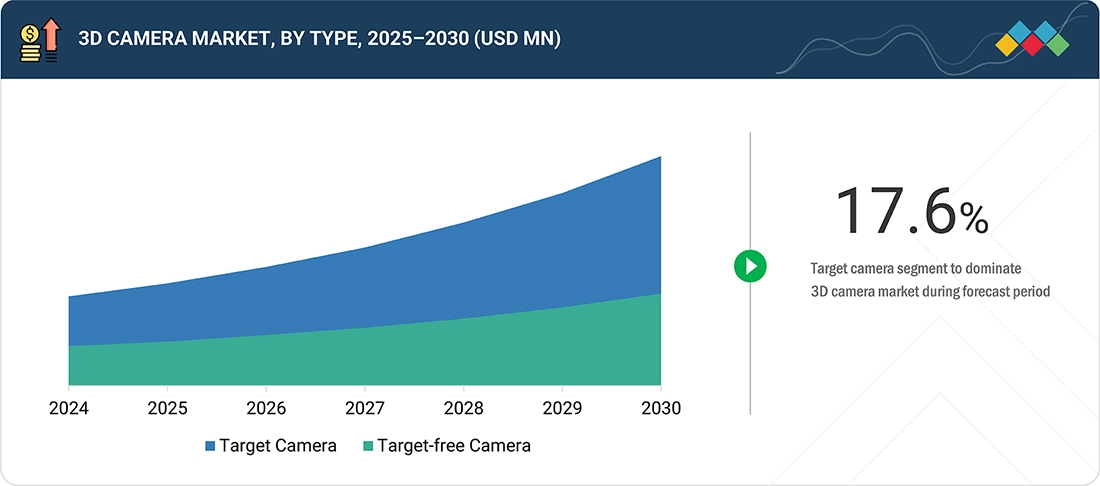
3D CameraMarket, By Type
The target camera segment is expected to dominate the overall 3D camera market during the forecast period, driven by their high precision and accuracy in depth sensing and distance measurement, making them ideal for applications in industrial automation, robotics, and quality inspection. Their ability to capture detailed 3D data of specific objects or scenes enables superior object recognition, defect detection, and dimensional analysis compared to target-free alternatives.
3D Camera Market, By End-User Industry
The consumer electronics segment is projected to lead the overall 3D camera market during the forecast period, driven by the widespread adoption of 3D sensing technologies in smartphones, tablets, gaming consoles, and wearable devices. Features like facial recognition, augmented reality (AR), gesture control, and enhanced photography have greatly increased consumer demand, making these devices a mainstream application for 3D cameras.
REGION
Asia Pacific is expected to be the fastest-growing region in the global 3D camera market during the forecast period.
The Asia Pacific region is projected to lead the 3D camera market growth, with the highest CAGR during the forecast period. The market growth is fueled by the area's strong electronics manufacturing sector, widespread adoption of smartphones and consumer electronics, and rapid industrial automation in China, Japan, South Korea, and India. Additionally, the presence of key 3D camera component suppliers, a skilled workforce, and government initiatives promoting smart manufacturing and AI adoption further boost growth.
3D Camera Market Share: COMPANY EVALUATION MATRIX
In the 3D camera market matrix, Intel Corporation (Star) leads with a strong market presence and a broad product portfolio, fueling large-scale adoption across industries like security and surveillance. Canon (Axis Communications AB) (Emerging Leader) is gaining momentum with mobile video surveillance solutions.
Source: Secondary Research, Interviews with Experts, MarketsandMarkets Analysis
WHAT IS IN IT FOR YOU: 3D Camera Market REPORT CONTENT GUIDE
DELIVERED CUSTOMIZATIONS
We have successfully delivered the following deep-dive customizations:
| CLIENT REQUEST | CUSTOMIZATION DELIVERED | VALUE ADDS |
|---|---|---|
| US-based Consumer Electronics 3D Camera Manufacturer |
|
|
| Europe Smart City 3D Surveillance Provider |
|
|
| Asian Industrial Automation Company |
|
|
| Middle East Security & Defense Agency |
|
|
| European Public Transport 3D Surveillance Provider |
|
|
RECENT DEVELOPMENTS
- October 2024 : Orbbec Inc. (China) partnered with Advantech Co., Ltd. (Taiwan) to deliver an out-of-the-box AI vision solution tailored for autonomous mobile robot (AMR) developers. This collaboration integrates Orbbec’s Gemini 335Lg stereo vision 3D camera, featuring GMSL2 and FAKRA connectors, with Advantech’s MIC-733-AO edge AI system powered by NVIDIA Jetson AGX Orin.
- July 2024 : Insta360 (China) partnered with Mistika VR (Spain) to enhance the post-production capabilities for users of its professional Insta360 Pro camera. This collaboration integrates the Insta360 Pro’s native calibration libraries directly into Mistika VR, allowing for high-precision stitching of 360° footage. A standout feature of Mistika VR is its ability to dynamically adjust stitch lines, enabling creators to avoid placing them over important objects within a scene.
- March 2024 : MatterPort, LLC. (US) partnered with Resi (UK), a leading home extension company, to enhance the efficiency and accuracy of home surveys using Matterport's Pro3 camera and Digital Twin Platform. This collaboration enabled Resi to reduce the average survey times by 25% and decrease hardware costs by 85%, allowing their team to complete more projects in less time.
- October 2022 : Intel Corporation (US) announced a collaboration with Connect Tech Inc. (Canada). As a part of this collaboration, Connect Tech will support Intel’s newly announced Intel RealSense Depth Camera D457. The Intel RealSense Depth Camera D457 will be interchangeable on Connect Tech Jetson Hardware without the need for additional development.
Table of Contents
 Exclusive indicates content/data unique to MarketsandMarkets and not available with any competitors.
Methodology
The research process for this study included systematic gathering, recording, and analysis of data about customers and companies operating in the 3D camera market. This process involved the extensive use of secondary sources, directories, and databases (Factiva and Oanda) to identify and collect valuable information for the comprehensive, technical, market-oriented, and commercial study of the 3D camera market. In-depth interviews were conducted with primary respondents, including experts from core and related industries and preferred manufacturers, to obtain and verify critical qualitative and quantitative information and assess growth prospects. Key players in the 3D camera market were identified through secondary research, and their market rankings were determined through primary and secondary research. This research included studying annual reports of top players and interviewing key industry experts such as CEOs, directors, and marketing executives.
Secondary Research
Various sources were used in the secondary research process to identify and collect information important for this study. These include company annual reports, press releases, investor presentations, white papers, technology journals, certified publications, articles by recognized authors, directories, and databases.
Secondary research was mainly used to obtain key information about the industry’s value chain, the total pool of market players, the market classification according to industry trends to the bottom-most level, regional markets, and key developments from market and technology-oriented perspectives.
Primary Research
Primary research was also conducted to identify the segmentation types, key players, competitive landscape, and key market dynamics, such as drivers, restraints, opportunities, challenges, and industry trends, along with key strategies adopted by players operating in the 3D camera market. Extensive qualitative and quantitative analyses were performed on the complete market engineering process to list key information and insights throughout the report.
Extensive primary research has been conducted after acquiring knowledge about 3D camera market scenarios through secondary research. Several primary interviews have been conducted with experts from the demand (end use and region) and supply side (image detection technique, type) across four major geographic regions: North America, Europe, Asia Pacific, and RoW. Approximately 60% and 40% of the primary interviews were conducted from the supply and demand sides. These primary data have been collected through questionnaires, emails, and telephonic interviews.

Note: The three tiers of the companies have been defined based on their total/segmental revenue as of 2024: Tier 1 = >USD 1 billion, Tier 2 = USD 1 billion–USD 500 million, and Tier 3 = USD 500 million. ‘Others’ include sales, marketing, and product managers.
To know about the assumptions considered for the study, download the pdf brochure
Market Size Estimation
In the complete market engineering process, top-down and bottom-up approaches and several data triangulation methods were implemented to estimate and validate the size of the 3D camera market and various other dependent submarkets. Key players in the market were identified through secondary research, and their market share in the respective regions was determined through primary and secondary research. This entire research methodology included the study of annual and financial reports of the top players, as well as interviews with experts (such as CEOs, VPs, directors, and marketing executives) for key insights (quantitative and qualitative).
All percentage shares, splits, and breakdowns were determined using secondary sources and verified through primary sources. All the possible parameters that affect the markets covered in this research study were accounted for, viewed in detail, verified through primary research, and analyzed to obtain the final quantitative and qualitative data. This data was consolidated and supplemented with detailed inputs and analysis from MarketsandMarkets and presented in this report.
3D Camera Market : Top-Down and Bottom-Up Approach

Data Triangulation
After arriving at the overall market size from the market size estimation process, as explained above, the total market has been split into several segments and subsegments. To complete the overall market engineering process and arrive at the exact statistics for all segments and subsegments, market breakdown and data triangulation procedures have been employed, wherever applicable. The data have been triangulated by studying various factors and trends from the demand and supply sides. Along with this, the market has been validated using top-down and bottom-up approaches.
Market Definition
A 3D camera can capture three-dimensional images or videos, which can be viewed from different angles to provide a sense of depth and spatial information. These cameras use various technologies, such as stereoscopic imaging, depth mapping, and structured light scanning, to capture 3D images. They are commonly used in industries such as entertainment, gaming, virtual reality, and medical imaging to create 3D models and maps in various fields, including engineering, architecture, and surveying. In the consumer electronics industry, 3D cameras are often used to capture 3D photos and videos to share on social media or view on 3D-capable televisions and monitors.
In addition to their applications in various industries, 3D cameras have become increasingly popular in recent years in the consumer market. They are used by hobbyists, enthusiasts, and professionals alike to capture 3D photos and videos of landscapes, people, animals, and more.
Key Stakeholders
- Government and financial institutions and investment communities
- Analysts and strategic business planners
- 3D camera product designers and fabricators
- 3D camera hardware providers
- 3D camera providers
- 3D camera integrated solution providers
- Business providers
- Professional service/solution providers
- Research organizations
- Technology standard organizations, forums, alliances, and associations
- Technology investors
Report Objectives
- To define, describe, and forecast the 3D camera market size, by image detection technique, type, end use, and region, in terms of value
- To forecast the 3D camera market size, by image detection technique, in terms of volume
- To forecast the size of the market segments for four major regions—North America, Europe, Asia Pacific, and RoW
- To provide detailed information regarding the major drivers, restraints, opportunities, and challenges influencing the growth of the market
- To strategically analyze micromarkets with respect to individual growth trends, prospects, and contributions to the total market
- To study the complete value chain and allied industry segments and perform a value chain analysis of the market
- To strategically profile the key players and comprehensively analyze their market shares and core competencies
- To analyze the opportunities in the market for stakeholders and describe the competitive landscape of the market
- To analyze competitive developments such as joint ventures, collaborations, agreements, contracts, partnerships, mergers & acquisitions, product developments, and research & development (R&D) in the market
- To understand the macroeconomic outlook for each region and the impact of AI/Gen AI and 2025 US tariff on the 3D camera market
Customization Options
With the given market data, MarketsandMarkets offers customizations according to the company’s specific needs. The following customization options are available for the report:
Key Questions Addressed by the Report
What is the current size of the 3D Camera Market?
The global 3D Camera Market was valued at USD 1.39 billion in 2024 and is estimated to reach USD 1.59 billion in 2025. (MarketsandMarkets)
What is the projected market size of the 3D Camera Market by 2030?
The market is projected to grow to USD 3.49 billion by 2030, driven by increasing adoption across industrial automation, robotics, automotive, and consumer electronics applications. (MarketsandMarkets)
What is the expected CAGR of the 3D Camera Market?
The 3D Camera Market is expected to register a CAGR of 17.0% during 2025–2030. (MarketsandMarkets)
What are the key growth drivers of the 3D Camera Market?
Major growth drivers include increasing adoption of industrial robots, rising demand for 3D imaging applications, growing use of 3D cameras in construction, and integration of 3D sensing technologies in consumer electronics and smart devices. (MarketsandMarkets)
Which region dominates the 3D Camera Market?
Asia Pacific held the largest market share, accounting for 35.9% of global revenue in 2024, supported by strong electronics manufacturing and industrial automation investments. (MarketsandMarkets)
Which region is expected to grow the fastest in the 3D Camera Market?
Asia Pacific is also projected to record the highest CAGR during the forecast period due to rapid adoption of AI, robotics, smart manufacturing, and consumer electronics across China, Japan, South Korea, and India. (MarketsandMarkets)
Which technology segment is expected to grow the fastest in the 3D Camera Market?
The Time-of-Flight (ToF) segment is expected to achieve the highest growth, with a projected CAGR of 19.7%, due to its superior depth-sensing capabilities and expanding use in robotics, automotive, and AR/VR applications. (MarketsandMarkets)
Which industry is expected to witness the highest growth in the 3D Camera Market?
The automotive industry is expected to record the fastest growth, driven by increasing deployment of 3D cameras in advanced driver assistance systems (ADAS), autonomous vehicles, and in-cabin monitoring systems. (MarketsandMarkets)
Who are the leading companies in the 3D Camera Market?
Key players include Intel Corporation, Sony Corporation, Hikrobot Co., Ltd., Ricoh, and Basler AG. (MarketsandMarkets)
What major trends are shaping the 3D Camera Market?
Key trends include AI-powered machine vision, AR/VR integration, autonomous robotics, smart manufacturing, edge computing-enabled cameras, advanced depth-sensing technologies, and increasing adoption of 3D imaging in healthcare and industrial automation. (MarketsandMarkets)
Need a Tailored Report?
Customize this report to your needs
Get 10% FREE Customization
Customize This ReportPersonalize This Research
- Triangulate with your Own Data
- Get Data as per your Format and Definition
- Gain a Deeper Dive on a Specific Application, Geography, Customer or Competitor
- Any level of Personalization
Let Us Help You
- What are the Known and Unknown Adjacencies Impacting the 3D Camera Market
- What will your New Revenue Sources be?
- Who will be your Top Customer; what will make them switch?
- Defend your Market Share or Win Competitors
- Get a Scorecard for Target Partners

Custom Market Research Services
We Will Customise The Research For You, In Case The Report Listed Above Does Not Meet With Your Requirements
Get 10% Free CustomisationTESTIMONIALS

Tetsuya Ohhira
Business Development Manager-Technology Business
Nikon Corporation,
Leading Japanese MNC specializing in optics and imaging productswww.nikon.com
MarketsandMarkets™ response
is quick. Their attitude is flexible and positive. Analyst Insights are globally considered and
significant. Client Services quickly respond to our inquiry and demand. Their wide range of global
surveys help us make our strategic plan.
We hope Knowledge Store will be easier to search
for a report.
VP - Marketing & Business Development
Leading Provider of Process Control Solutions
We engaged with MarketsandMarkets on a study to perform an analysis and recommend a Go-To-Market strategy for metrology and process control in the semiconductor market. The study was tailored to our targets and needs with well-defined milestones. Our overall experience with the MarketsandMarkets team was very good throughout the project in all aspects including the analysis methodologies used, the quality and depth of primary and secondary data sets, the professionalism and flexibility of the team and the ability to meet the target schedule and milestones. We want to thank MarketsandMarkets team for a job well done.


Growth opportunities and latent adjacency in 3D Camera Market