3D Printing Construction Market by Material Type (Concrete, Metal, Composite), Construction Method (Extrusion, Powder Bonding), End-Use Sector (Building, Infrastructure), Region (North America, Europe, APAC, ROW) - Global Forecast to 2030


The global 3D printing construction market was valued at USD 1.58 billion in 2024 and is estimated to reach USD 54.62 billion by 2030, at a CAGR of 81.4% between 2025 and 2030.
The 3D printing construction market is driven by the growing demand for faster, cost-effective, and sustainable building solutions amidst rapid urbanization and housing shortages globally. The technology enables significant reductions in construction time and material waste compared to traditional methods, making it attractive for commercial, residential, and infrastructure projects. Increasing adoption of digital tools like Building Information Modeling (BIM) facilitates collaboration and design precision, further boosting 3D printing use in the construction industry. Technological advances in robotics, automation, and composite materials enhance the capabilities and efficiency of large-scale 3D printed construction. Government initiatives promoting affordable housing and smart city developments provide additional momentum by encouraging innovation and investments in 3D printing technologies. These factors collectively position 3D printing as a pivotal solution for addressing labor shortages, environmental sustainability, and customized architectural demands, particularly in regions like Asia-Pacific, North America, and Europe.

3D Printing Construction, also known as 3D Construction Printing (3DCP) is an innovative technology that uses large-scale 3D printing methods to fabricate buildings and construction components layer by layer. It primarily involves extrusion of construction materials such as concrete, mortar, or other composite mixtures through a computer-controlled nozzle that deposits the material precisely following a digital 3D model created in CAD software. This method eliminates the need for traditional formwork and molds, enabling complex architectural designs with greater efficiency and reduced material waste. 3D construction printing significantly lowers construction time, labor costs, and environmental impact, while also improving constructability and sustainability in infrastructure and civil engineering projects.
Market by End-use Industry
Building
The building industry holds a major share in the 3D printing construction market because it encompasses a broad range of applications such as residential, commercial, and institutional buildings, which represent the highest volume of construction activities globally. The demand for faster, cost-effective, and sustainable building methods drives the adoption of 3D printing in this sector. 3D printing allows for rapid construction of complex architectural designs with reduced labor and material costs, leading to significant savings and efficiency improvements. With ongoing urbanization and the global housing crisis, governments and developers are increasingly investing in affordable and quickly constructed housing solutions, which 3D printing effectively supports. The versatility of 3D printing in creating customized, scalable building components combined with increasing integration with smart city initiatives further boosts its application in the building industry.
Infrastructure
The infrastructure sector plays an important role in the 3D printing construction market due to the increasing demand for rapid, cost-effective, and sustainable urban development. As cities expand and smart city initiatives gain traction worldwide, there is a heightened need for fast construction of critical infrastructure such as modular housing, bridges, public utilities, and adaptable urban spaces. 3D printing technology enables the production of large-scale, complex, and customized infrastructure components with reduced material waste and labor costs, making it highly suitable for infrastructure projects. 3D printing supports integration with smart technologies like IoT sensors and energy-efficient materials, essential for modern infrastructure systems. Governments and urban planners are increasingly adopting these technologies to meet rapid urbanization and sustainability goals, especially in regions like Asia-Pacific where infrastructure development is booming.
Market by Construction Method
Extrusion
Extrsuion is among the primary construction method in the 3D printing construction market due to its numerous advantages that align well with industry needs. It is highly cost-effective, especially for large production runs, because the technology requires relatively less expensive equipment compared to other methods like powder bonding. Extrusion offers accurate control over dimensions and shapes while efficiently utilizing materials, resulting in low waste. It supports a wide range of traditional building materials such as concrete, clay, geopolymer, and plaster, making it adaptable to various construction projects. Additionally, extrusion enables the creation of complex architectural profiles with high customization, including curved walls, textures, and organic shapes, which are otherwise difficult or expensive to produce by conventional means. The method also contributes to faster and more sustainable construction with reduced labor and machining requirements.
Power Bonding
Power Bonding method plays a pivotal role in the 3D printing construction market due to its cost-effectiveness, speed, and ability to produce highly durable and complex structures. This method involves selectively bonding layers of powdered materials like concrete, sand, ceramics, or metal using liquid binders or thermal energy. It offers high design flexibility and reduces material waste, making it ideal for residential, commercial, and industrial construction projects. The powder bonding technique is energy-efficient and supports the use of advanced, eco-friendly materials such as geopolymers with carbon-neutral properties, which align well with growing environmental sustainability demands. Additionally, automation and AI integration in powder bonding enhance process control, defect detection, and quality, enabling faster, accurate, and reliable construction with reduced labor needs.
Market by Material Type
Concrete
Concrete holds the largest share in the 3D printing construction market primarily because of its favorable properties and suitability for large-scale construction. Concrete is widely available, cost-effective, and versatile, making it an ideal material for automated, large-format 3D printing systems used in building structures. It allows for the manufacture of complex shapes and customized designs that traditional concrete formwork cannot easily achieve. Moreover, concrete mixtures can be optimized specifically for 3D printing through adjustments in composition to enhance flowability, setting time, and structural strength, which supports faster construction cycles and improved durability.
Metal
Metal plays a major role in the 3D printing construction market due to their superior mechanical properties such as high strength, durability, corrosion resistance, and elasticity, which are essential for structural and functional components in construction. Metals like titanium exhibit a unique combination of strength and lightweight characteristics, making them ideal for applications requiring high-performance and precision, particularly in infrastructure and industrial construction sectors. Growing innovations in metal alloys and advances in 3D printing technologies such as Wire Arc Additive Manufacturing (WAAM) and powder bonding enables the production of complex geometries with less material waste and faster build times.
Composite
Composite holds the second-largest share in the 3D printing construction market because they offer superior mechanical properties like high strength, stiffness, durability, and resistance to environmental factors compared to traditional materials. The combination of reinforcing fibers (e.g., carbon fiber, glass fiber, Kevlar) with polymer matrices creates lightweight yet high-performance materials ideal for construction applications that demand structural integrity and longevity. 3D printing enables precise placement of these reinforcements within the composite matrix, allowing for complex geometries and customized building components that enhance design flexibility and reduce material waste. Composite materials are especially favored in demanding sectors like aerospace and defense, which drive innovation and adoption in construction.
Market by Geography:
Geographically, the 3D printing construction market is experiencing widespread adoption across North America, Europe, Asia Pacific, and Rest of the World. The Asia-Pacific region is projected to register the highest growth rate in the 3D printing construction market. This growth is fueled by rapid urbanization and rising population which creates a strong demand for affordable and fast housing and infrastructure development. Rest of the World follows, driven by smart city projects and visionary urban development plans that align well with 3D printing technologies, offering faster construction times, cost savings, and reduced labor dependency in the Saudi Arabia and UAE. Europe holds a significant share, supported by robust manufacturing base and significant R&D investments, supported by favorable regulatory frameworks promoting advanced manufacturing technologies. The North America has smaller but growing demand in pilot projects for affordable housing, and innovation hubs particularly in the U.S.
Market Dynamics
Driver: Rising infrastructural projects
The rapid expansion of infrastructural projects across both developed and emerging economies is a major driver for the 3D printing construction market. Governments and private developers are increasingly investing in large-scale housing, urban development, and infrastructure renewal initiatives, which demand faster, cost-effective, and sustainable building methods. The U.S. and Canadian governments are actively supporting affordable housing initiatives using 3D printing through significant funding programs such as HUD grants, which mitigate private sector risks and promote innovation in construction. 3D printing construction reduces material waste, shortening project timelines, and enabling complex architectural designs that traditional methods cannot easily achieve. As nations push for affordable housing and smart city developments, particularly in regions like Asia-Pacific, the adoption of automated and additive construction technologies continues to accelerate, reinforcing 3D printing’s role as a transformative solution in modern infrastructure development.
Restraint: High Capital Investment
High capital investment is a major restraint to the 3D printing construction market. The technology requires large-format 3D printers, making initial adoption expensive, especially for small to mid-sized construction firms. Additionally, the specialized materials and software needed for 3D printing further add to the upfront costs. Beyond the machines and materials, investments in training personnel, upgrading infrastructure, and developing custom material formulations are necessary, increasing the total expenditure required to implement this technology. These high costs are a significant barrier in price-sensitive markets and limit adoption mainly to well-funded companies or government-backed projects. Moreover, the lack of affordable financing and leasing options further slows diffusion among smaller enterprises.
Opportunity: Revolutionizing Sustainable Construction with 3D Printing
3D printing in construction offers significantly advances sustainable and waste-efficient building practices. Unlike traditional construction methods, which often generate substantial material waste sent to landfills, 3D printing employs a highly precise layer-by-layer approach that uses only the exact amount of material needed, resulting in a drastic reduction in waste up to 90% less. This precision not only minimizes debris but also reduces the environmental footprint associated with leftover materials. Additionally, 3D printing supports the use of eco-friendly and recycled materials, such as recycled plastics, concrete, and advanced composites, which further enhances sustainability by lowering reliance on virgin resources and reducing greenhouse gas emissions. The technology also lowers carbon emissions since it requires fewer heavy machines and workers on-site, cutting fuel consumption and associated pollution. Beyond just construction, 3D-printed buildings are often designed with integrated insulation and energy-efficient features that reduce energy needs for heating and cooling over their lifetime, contributing to long-term environmental benefits.
Challenge: Limited Size of Printers
Limited size of 3D printers is a notable challenge in the construction market, as current printers often have physical constraints that restrict the maximum size of structures they can create in one piece. Large-scale gantry systems and robotic arm printers, although designed for bigger builds, are still limited by their frame size or arm reach, respectively. This necessitates printing buildings in smaller sections that must be transported and assembled on-site, increasing logistical complexity and costs. Additionally, transporting and setting up these large machines on construction sites can be difficult, especially in urban or constrained environments. These size limitations also affect the ability to scale printing for large or multi-story buildings, thus limiting the full potential of 3D printing in construction.
Future Outlook
The 3D printing construction market is projected to grow significantly from 2025 to 2030 driven by the growing global shortage of affordable housing coupled with a shortage of skilled labor, which has created an urgent need for faster, more efficient building methods that rely less on manual labor. The increasing role of automation in construction enhances speed, accuracy, and safety while reducing costs and human error. The Asia-Pacific region, led by China, will continue to lead growth, while North America and Europe remain significant markets supported by technological innovation and regulatory frameworks. Despite challenges such as structural and material integrity concerns and regulatory hurdles, the market is on track to transform traditional construction practices by enabling innovative, faster, and more sustainable building solutions.
Key Market Players
Key 3D printing construction companies Apis Cor Inc. (US), COBOD International A/S (Denmark), Contour Crafting Corporation (US), CyBe Construction (Netherlands), ICON Technology, Inc. (US) and among others.
Key Questions addressed in this report:
- What are the global trends in demand for the market?
- What are the upcoming technologies/product areas that will have a significant impact on the market in the future?
- What will be the revenue pockets for the market players in the next 10 years?
- What are the prime strategies followed by key players in the market?
To speak to our analyst for a discussion on the above findings, click Speak to Analyst
 Exclusive indicates content/data unique to MarketsandMarkets and not available with any competitors.
Table of Contents
1 Introduction (Page No. - 15)
1.1 Objectives of the Study
1.2 Market Definition
1.3 Market Scope
1.3.1 Regions Covered
1.3.2 Years Considered for the Study
1.4 Currency
1.5 Unit Considered
1.6 Stakeholders
2 Research Methodology (Page No. - 18)
2.1 Research Data
2.1.1 Secondary Data
2.1.1.1 Key Data From Secondary Sources
2.1.2 Primary Data
2.1.2.1 Key Data From Primary Sources
2.1.2.2 Key Industry Insights
2.1.2.3 Breakdown of Primary Interviews
2.2 Market Size Estimation
2.2.1 Bottom-Up Approach
2.2.1.1 Top-Down Approach
2.3 Data Triangulation
2.4 Assumptions
2.5 Limitations
3 Executive Summary (Page No. - 25)
4 Premium Insights (Page No. - 29)
4.1 Attractive Opportunities in the 3D Printing Construction Market
4.2 By Material Type and Region
4.3 By End-Use Sector
4.4 By Construction Method
4.5 By Country
5 Market Overview (Page No. - 32)
5.1 Introduction
5.2 Market Dynamics
5.2.1 Drivers
5.2.1.1 Potential for Mass Customization and Enhanced Architectural Flexibility
5.2.1.2 Reduction in Health & Safety Risks and Rate of Accidents
5.2.1.3 Inherently Green Technology
5.2.2 Restraints
5.2.2.1 High Capital Investment
5.2.3 Opportunities
5.2.3.1 Rise in Demand for New Construction Projects Across Regions
5.2.3.2 Rapid Urbanization
5.2.4 Challenges
5.2.4.1 Increase the Awareness About Automation Techniques in the Construction Industry
5.2.4.2 Smooth Surface Finish
5.2.4.3 Limited Size of the Printers
5.2.4.4 Partially Built Houses
5.3 Porter’s Five Forces Analysis
5.3.1 Threat of Substitutes
5.3.2 Threat of New Entrants
5.3.3 Bargaining Power of Suppliers
5.3.4 Bargaining Power of Buyers
5.3.5 Intensity of Competitive Rivalry
5.4 Macroeconomic Indicators
5.4.1 Introduction
5.4.2 Rising Population
5.4.3 Increase in Middle-Class Population, 2009–2030
5.4.4 Trends and Forecast of GDP
5.4.5 Contribution of the Construction Industry to the GDP, By Country
6 By Material Type (Page No. - 42)
6.1 Introduction
6.2 Concrete
6.2.1 Concrete Material Dominates the 3D Printing Construction Market
6.3 Metal
6.3.1 Metal Provides Higher Mechanical Strength and Cost-Benefit in 3D Printing Construction
6.4 Composite
6.4.1 Composite is the Second-Largest Segment in the 3D Printing Construction Market
6.5 Others
7 By Construction Method (Page No. - 49)
7.1 Introduction
7.2 Extrusion
7.2.1 Extrusion is One of the Most Widely Used 3D Printing Construction Methods
7.3 Powder Bonding
7.3.1 Powder Bonding Construction Method is Highly Suitable for Off-Site Process
8 By End-Use Sector (Page No. - 55)
8.1 Introduction
8.2 Building
8.2.1 The Ability of 3D Printing Technology to Develop Complex Building Geometries is Driving Its Demand in the Segment
8.3 Infrastructure
8.3.1 Design Flexibility is A Key Feature Driving the Market in the Infrastructure Segment
9 By Region (Page No. - 60)
9.1 Introduction
9.2 Europe
9.2.1 Russia
9.2.1.1 Increasing Government’s Focus on the Development of Affordable Housing is Positively Influencing the Market in Russia
9.2.2 France
9.2.2.1 France is One of the Most Dominant Economies in Europe
9.2.3 Denmark
9.2.3.1 Growing Demand for New Residential Construction Activities and Time-Saving Building Solutions are Likely to Drive the Market in Denmark
9.2.4 Spain
9.2.4.1 Increasing Demand for Affordable Houses is Driving the Market in the Building Segment in Spain
9.2.5 Netherlands
9.2.5.1 Increased Private and Government Investments in Various Sectors are Likely to Drive the Market in the Country
9.2.6 Italy
9.2.6.1 Growing Demand for Cost-Effective and Time-Saving Construction Methods is Resulting in the Market Growth in Italy
9.3 RoW
9.3.1 UAE
9.3.1.1 The UAE Represents Vast 3D Printing Technology in the Construction Sector
9.3.2 Saudi Arabia
9.3.2.1 Saudi Arabia is the Largest and Fastest-Growing 3D Printing Construction Market in RoW
9.4 APAC
9.4.1 China
9.4.1.1 China Dominates the 3D Printing Construction Market in the APAC Region
9.4.2 Thailand
9.4.2.1 3D Printing Construction is at the Initial Stage in Thailand
9.5 North America
9.5.1 US
9.5.1.1 Need for Affordable and Safe Housing Drives the 3D Printing Construction Market in the US
9.5.2 El Salvador
9.5.2.1 El Salvador is the Potential 3D Printing Construction Market in the North American Region
9.6 Other Potential Markets
9.6.1 India
9.6.2 Japan
9.6.3 Brazil
9.6.4 Egypt
10 Competitive Landscape (Page No. - 84)
10.1 Introduction
10.1.1 Competitive Leadership Mapping
10.1.1.1 Visionary Leaders
10.1.1.2 Dynamic Differentiators
10.1.1.3 Emerging Companies
10.1.1.4 Innovators
10.1.2 Strength of Product Portfolio
10.1.3 Business Strategy Excellence
10.1.4 Market Ranking
10.2 Competitive Scenario
10.2.1 New Project
10.2.2 Partnership
10.2.3 Expansion
10.2.4 Joint Venture
10.2.5 Agreement
10.2.6 Product Launch
10.2.7 Investment
10.2.8 Contract
11 Company Profiles (Page No. - 98)
(Business Overview, Products Offered, Recent Developments, SWOT Analysis, MnM View)*
11.1 Yingchuang Building Technique (Winsun)
11.2 Xtreee
11.3 Apis Cor
11.4 Monolite UK (D-Shape)
11.5 Csp S.R.L. (Centro Sviluppo Progetti)
11.6 Cybe Construction
11.7 Sika
11.8 Mx3D
11.9 Contour Crafting
11.10 Icon
11.11 Other Players
11.11.1 Betabram
11.11.2 Rohaco
11.11.3 Imprimere Ag
11.11.4 Beijing Huashang Luhai Technology
11.11.5 Total Kustom
11.11.6 Spetsavia
11.11.7 Lifetec Construction Group Inc
11.11.8 Be More 3D
11.11.9 3D Printhuset
11.11.10 Acciona
*Details on Business Overview, Products Offered, Recent Developments, SWOT Analysis, MnM View Might Not Be Captured in Case of Unlisted Companies.
12 Appendix (Page No. - 124)
12.1 Discussion Guide
12.2 Knowledge Store: Marketsandmarkets Subscription Portal
12.3 Available Customizations
12.4 Related Reports
12.5 Author Details
List of Tables (74 Tables)
Table 1 GDP (Current Prices), By Country, 2024–2022 (USD Billion)
Table 2 North America: Contribution of the Construction Industry to GDP, By Country, 2024–2030 (USD Billion)
Table 3 Europe: Contribution of Construction Industry to GDP, By Country, 2024–2030 (USD Billion)
Table 4 APAC: Contribution of Construction Industry to GDP, By Country, 2024–2030 (USD Billion)
Table 5 Middle East & Africa: Contribution of Construction Industry to GDP, By Country, 2024–2030 (USD Billion)
Table 6 Size, By Material Type, 2024–2030 (USD Thousand)
Table 7 Size, By Material Type, 2024–2030 (Square Meter)
Table 8 Concrete Size, By Region, 2024–2030 (USD Thousand)
Table 9 Concrete Size, By Region, 2024–2030 (Square Meter)
Table 10 Metal Size, By Region, 2024–2030 (USD Thousand)
Table 11 Metal Size, By Region, 2024–2030 (Square Meter)
Table 12 CompositeSize, By Region, 2024–2030 (USD Thousand)
Table 13 CompositeSize, By Region, 2024–2030 (Square Meter)
Table 14 Other 3D Printing Construction Materials Market Size, By Region, 2024–2030 (USD Thousand)
Table 15 Other 3D Printing Construction Materials Market Size, By Region, 2024–2030 (Square Meter)
Table 16 Size, By Construction Method, 2024–2030 (USD Thousand)
Table 17 Size, By Construction Method, 2024–2030 (Square Meter)
Table 18 3D Printing Extruded Construction Market Size, By Region, 2024–2030 (USD Thousand)
Table 19 3D Printing Extruded Construction Market Size, By Region, 2024–2030 (Square Meter)
Table 20 3D Printing Powder-Bonding Construction Market Size, By Region, 2024–2030 (USD Thousand)
Table 21 3D Printing Powder-Bonding Construction Market Size, By Region, 2024–2030 (Square Meter)
Table 22 Size, By End-Use Sector, 2024–2030 (USD Thousand)
Table 23 Size, By End-Use Sector, 2024–2030 (Square Meter)
Table 24 Size in Building, By Region, 2024–2030 (USD Thousand)
Table 25 Size in Building, By Region, 2024–2030 (Square Meter)
Table 26 Size in Infrastructure, By Region, 2024–2030 (USD Thousand)
Table 27 Size in Infrastructure, By Region, 2024–2030 (Square Meter)
Table 28 Size, By Region, 2024–2030 (USD Thousand)
Table 29 Size, By Region, 2024–2030 (Square Meter)
Table 30 Europe: Size, By Country, 2024–2030 (USD Thousand)
Table 31 Europe: Size, By Country, 2024–2030 (Square Meter)
Table 32 Europe: Size, By End-Use Sector, 2024–2030 (USD Thousand)
Table 33 Europe: Size, By End-Use Sector, 2024–2030 (Square Meter)
Table 34 3D-Printed Projects in Russia
Table 35 3D-Printed Projects in France
Table 36 France: Size, By End-Use Sector, 2024–2030 (USD Thousand)
Table 37 France: Size, By End-Use Sector, 2024–2030 (Square Meter)
Table 38 3D-Printed Projects in Denmark
Table 39 3D-Printed Projects in Spain
Table 40 3D-Printed Projects in the Netherlands
Table 41 Netherlands: Size, By End-Use Sector, 2024–2030 (USD Thousand)
Table 42 Netherlands: Size, By End-Use Sector, 2024–2030 (Square Meter)
Table 43 3D-Printed Projects in Italy
Table 44 RoW: Size, By Country, 2024–2030 (USD Thousand)
Table 45 RoW: Size, By Country, 2024–2030 (Square Meter)
Table 46 RoW: Size, By End-Use Sector, 2024–2030 (USD Thousand)
Table 47 RoW: Size, By End-Use Sector, 2024–2030 (Square Meter)
Table 48 3D-Printed Projects in UAE
Table 49 UAE: Size, By End-Use Sector, 2024–2030 (USD Thousand)
Table 50 UAE: Size, By End-Use Sector, 2024–2030 (Square Meter)
Table 51 Saudi Arabia: Size, By End-Use Sector, 2024–2030 (USD Thousand)
Table 52 Saudi Arabia: Size, By End-Use Sector, 2024–2030 (Square Meter)
Table 53 APAC: Size, By Country, 2024–2030 (USD Thousand)
Table 54 APAC: Size, By Country, 2024–2030 (Square Meter)
Table 55 APAC: Size, By End-Use Sector, 2024–2030 (USD Thousand)
Table 56 APAC: Size, By End-Use Sector, 2024–2030 (Square Meter)
Table 57 3D-Printed Projects in China
Table 58 China: Size, By End-Use Sector, 2024–2030 (USD Thousand)
Table 59 China: Size, By End-Use Sector, 2024–2030 (Square Meter)
Table 60 North America: Size, By Country, 2024–2030 (USD Thousand)
Table 61 North America: Size, By Country, 2024–2030 (Square Meter)
Table 62 North America: Size, By End-Use Sector, 2024–2030 (USD Thousand)
Table 63 North America: Size, By End-Use Sector, 2024–2030 (Square Meter)
Table 64 3D-Printed Projects in the Us
Table 65 US: Size, By End-Use Sector, 2024–2030 (USD Thousand)
Table 66 US: Size, By End-Use Sector, 2024–2030 (Square Meter)
Table 67 New Project, 2024–2030
Table 68 Partnership, 2024–2030
Table 69 Expansion, 2024–2030
Table 70 Joint Venture, 2024–2030
Table 71 Agreement, 2024–2030
Table 72 Product Launch, 2024
Table 73 Investment, 2024
Table 74 Contract, 2030
List of Figures (34 Figurs)
Figure 1 Segmentation
Figure 2 3D Printing Construction: Research Design
Figure 3 Market Size Estimation: Bottom-Up Approach
Figure 4 Market Size Estimation: Top-Down Approach
Figure 5 Data Triangulation
Figure 6 Building Sector to Grow at A Faster CAGR During the Forecast Year
Figure 7 Extrusion Segment is Estimated to Dominate the 3D Printing Construction Market
Figure 8 Concrete Material is Estimated to Dominate the 3D Printing Construction Market in 2030
Figure 9 Europe Accounted for the Largest Share in the 3D Printing Construction Market in 2030
Figure 10 Saudi Arabia to Be the Fastest-Growing 3D Printing Construction Market
Figure 11 High Demand From the Building Sector to Drive the Market
Figure 12 Europe Accounted for the Largest Market Share
Figure 13 Building Sector to Dominate the Overall 3D Printing Construction Market
Figure 14 Extrusion Accounts for the Larger Share of the Overall 3D Printing Construction Market
Figure 15 Saudi Arabia to Register the Highest CAGR
Figure 16 Drivers, Restraints, Opportunities, and Challenges
Figure 17 Porter’s Five Forces Analysis
Figure 18 Concrete Remains the Widely Used Material Type for 3D Printing Construction
Figure 19 APAC to Register the Highest CAGR in the Concrete Material Segment
Figure 20 Extrusion to Be the Widely Used Construction Method for 3D Construction Printing
Figure 21 APAC to Register A High CAGR for Extrusion Construction Method
Figure 22 Building to Be the Leading End-User Segment in the Market
Figure 23 APAC to Be the Second-Fastest Growing Market in the Building Segment
Figure 24 Saudi Arabia is Projected to Be the Fastest-Growing Country-Level Market, 2024–2030
Figure 25 Europe: Snapshot
Figure 26 APAC: Snapshot
Figure 27 North America: Snapshot
Figure 28 New Project is the Most Adopted Key Growth Strategy Between 2024 and 2030
Figure 29 : Competitive Leadership Mapping, 2030
Figure 30 Yingchuang Building Technique (Winsun): SWOT Analysis
Figure 31 Xtreee: SWOT Analysis
Figure 32 Apis Cor: SWOT Analysis
Figure 33 Monolite UK (D-Shape): SWOT Analysis
Figure 34 Sika: Company Snapshot
The study involved four major activities in estimating the current 3D printing construction market size. Exhaustive secondary research was done to collect information on the market, peer market, and parent market. The next step was to validate these findings, assumptions, and sizing with industry experts across the value chain through primary research. Both top-down and bottom-up approaches were employed to estimate the complete market size. After that, market breakdown and data triangulation procedures were used to estimate the size of market segments and subsegments.
Secondary Research
In the secondary research process, various secondary sources such as Hoovers, Bloomberg BusinessWeek, and Dun & Bradstreet were referred to identify and collect information for this study. These secondary sources included annual reports, press releases & investor presentations of companies; white papers; certified publications; articles by recognized authors; gold standard & silver standard websites; regulatory bodies; trade directories; and databases.
Primary Research
The 3D printing construction market comprises several stakeholders such as raw material suppliers, processors, end-product manufacturers, and regulatory organizations in the supply chain. The demand side of this market is characterized by the development of various industry sectors such as building, and infrastructure. Advancements in technology across diverse applications characterize the supply side. Various primary sources from both the supply and demand sides of the market were interviewed to obtain qualitative and quantitative information.
Following is the breakdown of primary respondents:
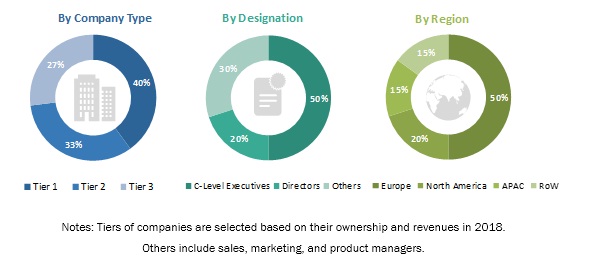
To know about the assumptions considered for the study, download the pdf brochure
Market Size Estimation
Both the top-down and bottom-up approaches were used to estimate and validate the total 3D printing construction market size. These methods were also used extensively to estimate the size of various subsegments in the market. The research methodology used to estimate the market size included the following:
- The key players in the industry and markets were identified through extensive secondary research.
- The industry’s supply chain and market size, in terms of value, were determined through primary and secondary research processes.
- All percentage shares, splits, and breakdowns were determined using secondary sources and verified through primary sources.
Data Triangulation
After arriving at the overall market size using the market size estimation process, as explained above, the market was split into several segments and subsegments. To complete the overall market engineering process and arrive at the exact statistics of each market segment and subsegment, the data triangulation, and market breakdown procedures were employed, wherever applicable. The data was triangulated by studying various factors and trends from both the demand and supply sides in building and infrastructure end-use sectors.
Objectives of the Report
- To define, describe, and forecast the market size of 3D printing construction, in terms of value and volume
- To provide detailed information about the key factors (drivers, restraints, opportunities, and challenges) influencing the growth of the market
- To provide detailed information about the technological advancements influencing the growth of the market
- To forecast the market based on the construction method, material type, and end-use sector
- To define, describe, and forecast the market based on five regions, namely, North America, Europe, Asia Pacific (APAC), and Rest of the World (RoW)
- To strategically analyze micro-markets with respect to individual growth trends, prospects, and their contribution to the overall market
- To analyze the opportunities in the market for stakeholders and provide a competitive landscape for the market leaders
- To analyze recent developments such as expansion, new projects, investment, partnership, new product launch, contract and a joint venture in the market
- To strategically profile the key players and comprehensively analyze their market share and core competencies
Available Customizations
With the given market data, MarketsandMarkets offers customizations according to the company’s specific needs.
The following customization options are available for the report:
Product Analysis
- Product matrix, which gives a detailed comparison of the product portfolio of each company
Regional Analysis
- Further breakdown of Rest of North America 3D printing construction market
- Further breakdown of Rest of Europe 3D printing construction market
- Further breakdown of the Rest of Asia Pacific 3D printing construction market
- Further breakdown of RoW Others 3D printing construction market
Company Information
- Detailed analysis and profiling of additional market players (up to five)


Growth opportunities and latent adjacency in 3D Printing Construction Market