
3D Printing Materials Market

3D Printing Materials Market by Type (Plastics, Metals, Ceramics, Other Types), Form (Filament, Powder, Liquid), Technology (FDM, SLA, SLS, DMLS, Other Technologies), Application (Prototyping, Manufacturing, Others), End-use Industry (Aerospace & Defense, Healthcare, Automotive, Consumer Goods, Other End-use Industry), & Region - Global Forecast to 2030


3D PRINTING MATERIALS MARKET SIZE & SHARE
Source: Secondary Research, Interviews with Experts, MarketsandMarkets Analysis | Updated on : April 20, 2026
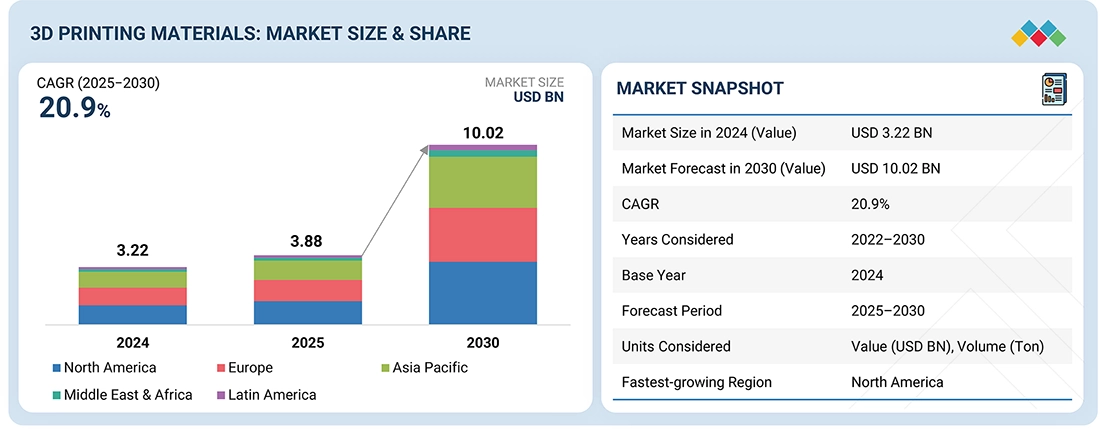
The 3D printing materials market size is projected to reach USD 10.02 billion by 2030 from USD 3.88 billion in 2025, at a CAGR of 20.9% from 2025 to 2030. The 3D printing materials market is primarily driven by factors such as ease in the development of customized products and reduction in manufacturing costs and process downtime. 3D printing is being adopted at a very high rate across various end-use industries owing to the mass customization offered by this process.
KEY TAKEAWAYS
-
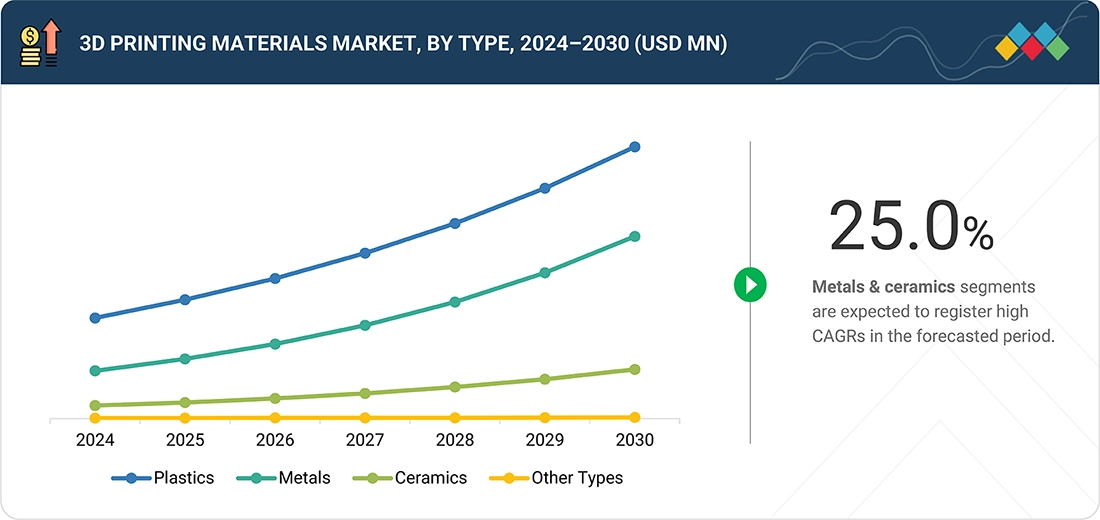
BY TYPEThe 3D printing materials market comprises plastics, metals, ceramics, and other types. Metals and ceramics are expected to register the highest CAGR in terms of value during the forecasted period.
-
BY FORMThe form segment of 3D printing materials includes filament, powder, and liquid. The filament segment accounted for the largest market share in 2024, while the powder segment is projected to register the highest CAGR during the forecast period.
-
BY TECHNOLOGYThe technology segment comprises FDM, SLS, SLA, DMLS, and other technologies. The DMLS technology is expected to register the highest growth in the forecasted period, due to the increasing demand for 3D printing metals.
-
BY APPLICATIONThe applications include prototyping, manufacturing, and others. The manufacturing segment is expected to register the highest CAGR in the forecasted period.
-
BY END-USE INDUSTRYKey end-use industries of 3D printing materials include aerospace & defense, healthcare, automotive, consumer goods, and other end-use industries. The automotive segment is projected to register the highest CAGR during the forecast period, as 3D printing technology is widely used in this industry for rapid prototyping and testing of automotive components.
-
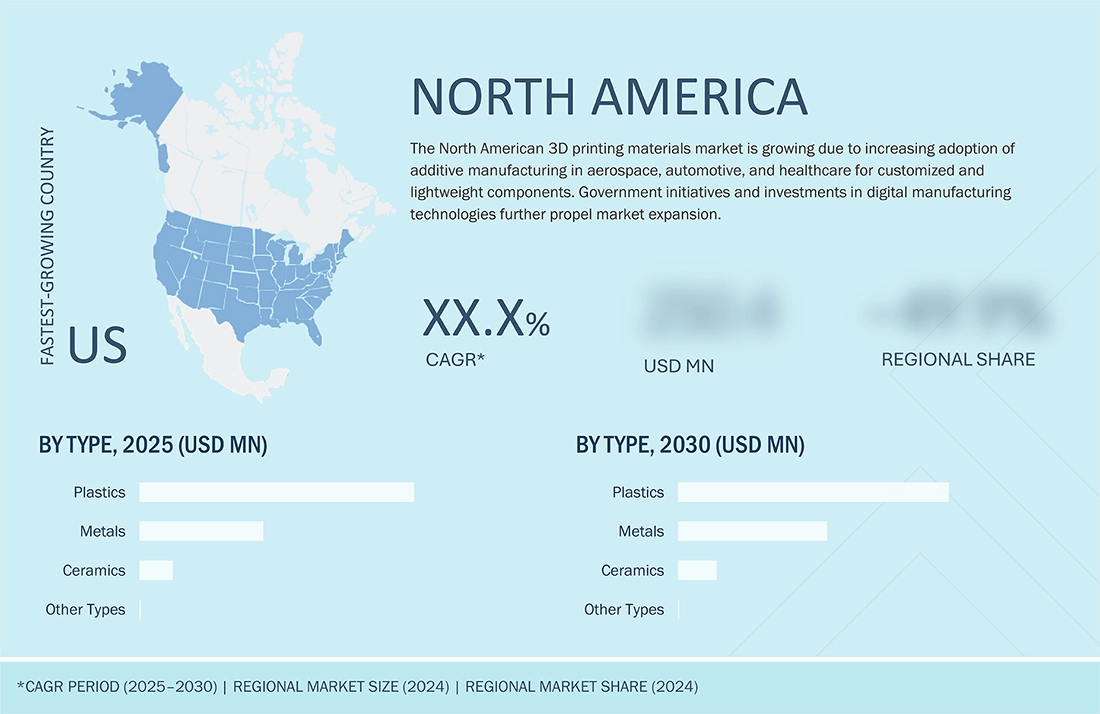
BY REGIONThe 3D printing materials market covers Europe, North America, Asia Pacific, Latin America, and the Middle East & Africa. North America is the largest market for 3D printing materials. The region is also projected to register the highest CAGR during the forecast period.
-
COMPETITIVE LANDSCAPEMajor market players have adopted both organic and inorganic strategies, including partnerships and investments. For instance, GE Aerospace (US), 3D Systems, Inc. (US), and Stratasys (US) have entered into a number of agreements and partnerships to cater to the growing demand for 3D printing materials across innovative applications.
Mass customization is the current revolution in the 3D printing industry. 3D printing has made life easier as consumers can create designs and develop new paradigms by crafting creative designs on the computer and printing the same with the use of a printer. For plastic objects, the printers can be located at retail stores, and for metal and other materials, the printers can be placed at specialized offsite facilities. In either case, the final product cost will be affordable for customers. Mass customization enabled by 3D printing has led to the increased demand for different 3D printing materials. Owing to the advancements in 3D printing technology and the development of new 3D printing materials, various new application areas have been discovered for 3D printing. These new areas include home decor, fashion, and jewelry. The use of 3D printing in these applications is expected to boost the growth of the 3D printing materials market.
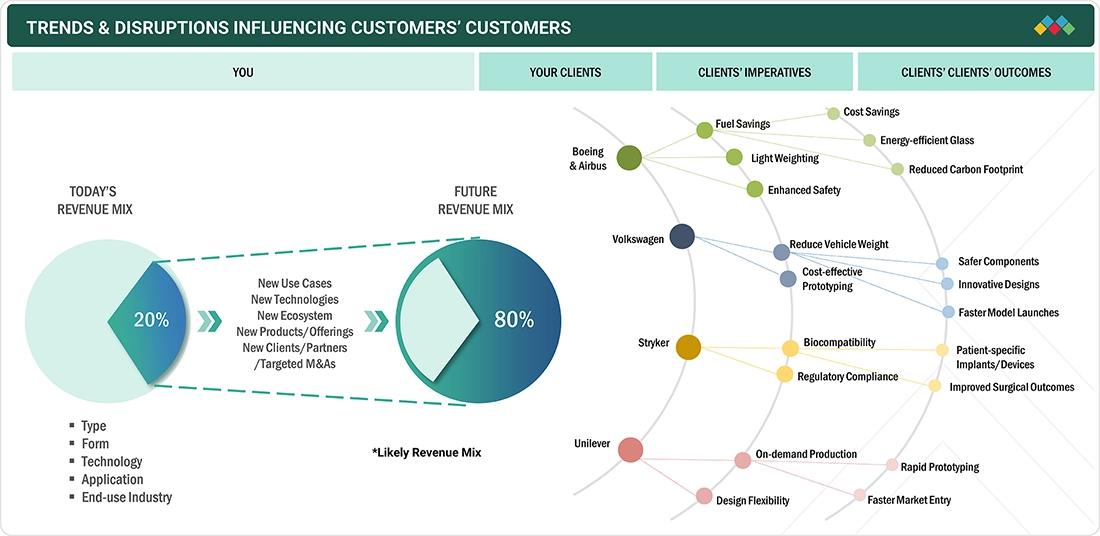
TRENDS & DISRUPTIONS IMPACTING CUSTOMERS' CUSTOMERS
Changes in customer trends or disruptions impact consumers’ businesses. These shifts impact the revenues of end users. Consequently, the revenue impact on end users is expected to affect the revenues of 3D printing material suppliers, which, in turn, impacts the revenues of 3D printing material manufacturers.
Source: Secondary Research, Interviews with Experts, MarketsandMarkets Analysis
MARKET DYNAMICS
Level
-
Government initiatives to increase adoption of 3D printing technologies

-
Development of new industrial-grade 3D printing materials

Level
-
Lack of mass production to drive large players out

-
Lack of standard process control

Level
-
Penetration of 3D printing in emerging countries

-
Emerging applications of 3D printing metals

Level
-
High cost and lack of scalability

-
Reducing lead time

Source: Secondary Research, Interviews with Experts, MarketsandMarkets Analysis
Driver: Government initiatives to increase adoption of 3D printing technologies
In December 2020, the Government of India’s Ministry of Electronics and Information Technology implemented a 3D printing policy aimed at developing a supportive ecosystem for local firms. 3D Systems and Stratasys are also investing in promotional activities and establishing 3D printing centers in countries like Japan, China, and India to tap into the promising market in these regions. Government initiatives such as reimbursement policies, funding, and various mergers and acquisitions between small and large firms for technological advancement are boosting the 3D printing materials market. Initiatives by the governments of different European and Asia Pacific countries to improve 3D printing technologies have increased the demand for 3D printing materials in various sectors.
Restraint: Lack of standard process control
The consistency of each 3D printing process varies due to the uncontrolled process variables and material differences based on machine and manufacturer. Currently, very few monitoring techniques meet specific criteria by rectifying the process inconsistencies of 3D printing. The capacity to develop detailed and accurate mathematical models through 3D printing is difficult, especially in complex and sophisticated applications (such as aerospace, military/defense, and healthcare) due to the limited data available for process control. Limitations in the planning phase, process control, and pre- and post-production procedures may lead to manufacturing failures and erroneous outputs.
Opportunity: Penetration of 3D printing in emerging countries
Emerging markets like India, South Korea, Singapore, Thailand, and Mexico are really stepping up when it comes to metal 3D printing across various industries, including automotive, aerospace, and manufacturing. Companies like GE Aerospace are using additive manufacturing to make their production processes more efficient, save on materials, and stay ahead of the competition. With strong government backing and partnerships between research institutions and manufacturers, countries like South Korea are nurturing a culture of innovation. Meanwhile, Thailand is putting a lot of emphasis on developing a skilled workforce and promoting industrial adoption of these technologies.
Challenge: High cost and lack of scalability
One of the greatest challenges within the 3D printing materials market is that the advanced materials are very expensive, highly non-scalable, and non-standardized. While polymers like PLA and ABS remain inexpensive and widely utilized for prototyping, the aerospace, automotive, and healthcare industries increasingly require proprietary materials like titanium alloys, carbon-fiber composites, and biocompatible resins. Not only are these advanced materials expensive, but they also have production and certification limitations.
3D Printing Materials Market: COMMERCIAL USE CASES ACROSS INDUSTRIES
| COMPANY | USE CASE DESCRIPTION | BENEFITS |
|---|---|---|
 |
GE uses metal powder 3D printing to manufacture fuel nozzle tips for its LEAP engines, consolidating many parts into a single printed component | Achieves ~25 % weight reduction, fewer parts to assemble, and greater durability than conventionally manufactured equivalents |
 |
Stryker produces orthopedic implants (e.g., titanium knee and spinal implants) using additive manufacturing to create porous, bone-integrating geometries. | Enables better osseointegration, customization, lower waste, and scalability of complex implant designs |
 |
Align uses 3D printing (resins) to produce molds and is planning to shift toward direct 3D printing of clear aligner trays | Improves production speed, reduces material waste, and enables scaling of custom appliance manufacture |
Logos and trademarks shown above are the property of their respective owners. Their use here is for informational and illustrative purposes only.
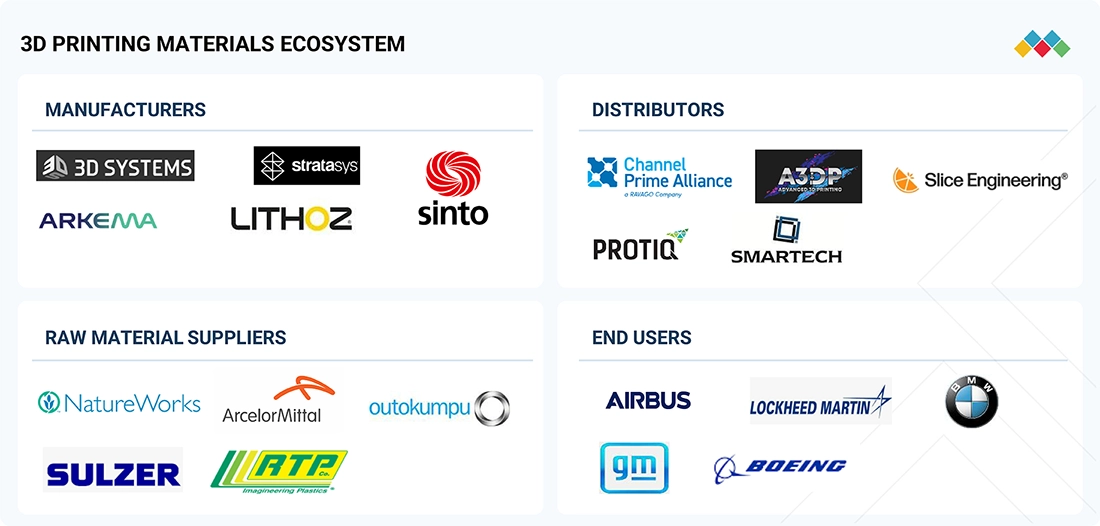
MARKET ECOSYSTEM
The 3D printing materials market ecosystem consists of raw material suppliers (NatureWorks, ArcelorMittal), 3D printing material manufacturers (3D Systems, Inc., Arkema, Stratasys), distributors (PROTIQ, Slice Engineering), and end users (Boeing, Airbus). The raw material suppliers provide polymers, metal ores, and ceramics to 3D printing material manufacturers. The distributors and suppliers establish contact between the manufacturing companies and end users to streamline the supply chain, increasing operational efficiency and profitability.
Logos and trademarks shown above are the property of their respective owners. Their use here is for informational and illustrative purposes only.
MARKET SEGMENTS
Source: Secondary Research, Interviews with Experts, MarketsandMarkets Analysis
3D Printing Materials Market, by Type
Plastics rule the materials market for 3D printing because they are versatile, inexpensive, and broadly available for multiple additive manufacturing technologies (FDM, SLA, and SLS). Affordable materials like ABS, PLA, nylon, and photopolymers are extensively used for prototyping, tooling, and end-use parts because they provide easy processing, design flexibility, and a balance of strength and durability for end-use parts. Their lower costs compared to metals and ceramics have led to their preference in applications across industries, such as consumer goods, automotive, healthcare, and education. Engineering-grade and biocompatible plastics are the latest options that expand applicability and maintain market leadership.
3D Printing Materials Market, by Form
The powder category is anticipated to generate the highest growth rate in the 3D printing materials market. This is largely due to the pivotal role powder-based materials play with newer technologies such as Selective Laser Sintering (SLS), Direct Metal Laser Sintering (DMLS), Selective Laser Melting (SLM), and Binder Jetting which are seeing more acceptance in properties for scaling to commercial forms. These materials can create components out of polymers, metals, or ceramics while achieving enhanced accuracy, durability, and intricate complexity to meet performance requirements in aerospace, automotive, medical, and industrial applications. The transition from prototyping to end-use part production provides a growing application of advantages with powder-based materials and will lead to higher growth in powder-based materials than any other material.
3D Printing Materials Market, by Technology
Fused deposition modeling (FDM) accounts for the largest market share in the 3D printing materials market as it is the most widely used and lowest cost option for prototyping and small production. FDM uses thermoplastic filaments, such as ABS, PLA, PETG, and high-performance polymers, which are affordable, readily available and easy to process. The simplicity, reliability, and accessibility of FDM printers continue to attract users in industries such as automotive, aerospace, healthcare, and education. Additionally, the ongoing development of engineering-grade and composite filaments has improved the ability of FDM to produce functional parts and tooling and has solidified its position as the strongest technology in the materials market.
3D Printing Materials Market, by Application
Prototyping accounts for the largest market share in the 3D printing materials market, as additive manufacturing was originally used as a rapid prototyping tool in which companies can quickly design, test, and validate new products before they are manufactured in volume. The ability to produce complex geometries, shorten development time, and reduce costs compared to conventional methods of prototyping have made 3D printing essential to many industries, including automotive, aerospace, healthcare, and consumer goods. The extensive reliance on 3D printing to support the acceleration of innovation and shorten the product development cycle has resulted in prototyping becoming the largest application segment.
3D Printing Materials Market, by End-use Industry
The aerospace and defense industry holds the largest share of the 3D printing materials market. This is largely due to additive manufacturing's ability to produce lightweight, durable, and high-performance components more efficiently than traditional manufacturing methods. 3D printing enables the creation of highly complex geometries and optimized structures with minimal material waste and lower overall manufacturing costs, which is crucial in the aerospace sector. Metal powders, commonly consisting of titanium, aluminum, and nickel-based materials, as well as high-performance polymers, are used for printing parts such as engine components, tooling, and structural elements. As the industry continues to focus on reducing fuel consumption, improving performance, and enhancing supply chain resilience, the adoption of 3D printing materials has become widespread. Consequently, the aerospace & defense industry is expected to remain the largest end-use market for 3D printing for the foreseeable future.
REGION
North America to be fastest-growing region for 3D printing materials market during forecast period
North America is projected to be the fastest-growing region during the forecast period, particularly in the 3D printing materials market. This growth can be attributed to significant research efforts in the region, coupled with the widespread adoption and production of products utilizing 3D printing technology. In 2024, the US is expected to hold a major share of the North American 3D printing materials market in terms of value. The demand for 3D printing materials is increasing significantly across various industries, including aerospace & defense, healthcare, and automotive. Additionally, strong government support for 3D printing materials over traditional materials, along with the presence of key manufacturers in the region, is anticipated to drive market growth. Prominent companies such as Stratasys, Ltd. and 3D Systems, Inc. are leading the way by investing in the development of advanced materials that offer superior strength, heat resistance, and biocompatibility. These companies provide integrated solutions that include materials, printers, and software, helping to streamline the adoption of 3D printing technologies and ensure optimal performance across various applications.
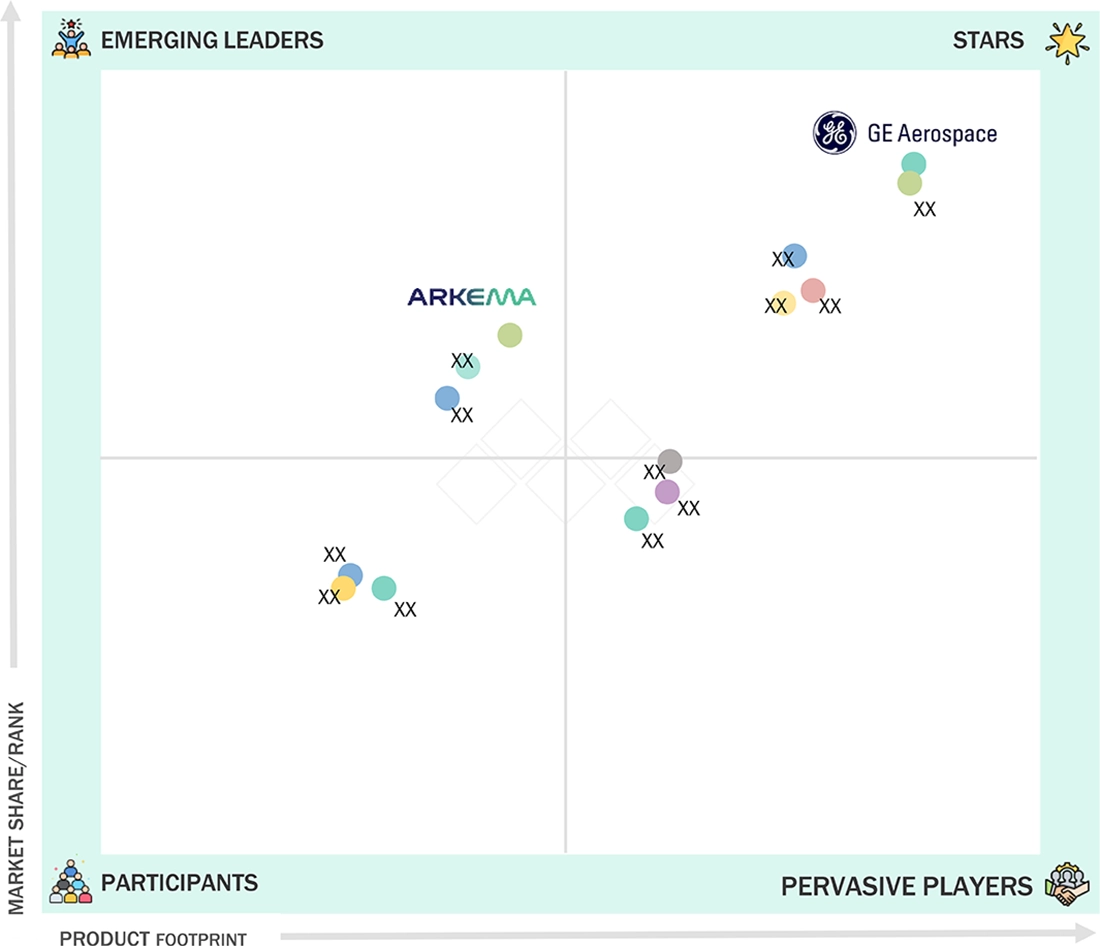
3D Printing Materials Market: COMPANY EVALUATION MATRIX
In the 3D printing materials market, GE Aerospace (Star) leads with a strong market share and extensive product footprint, driven by its collaborations and partnerships with end users. Arkema (Emerging Leader) is gaining visibility because of its strong portfolio of advanced polymers and resins, including bio-based and high-performance materials. While GE Aerospace dominates through scale and a diverse portfolio, Arkema shows significant potential to move toward the leaders’ quadrant as the demand for 3D printing materials continues to rise.
Source: Secondary Research, Interviews with Experts, MarketsandMarkets Analysis
KEY MARKET PLAYERS
MARKET SCOPE
| REPORT METRIC | DETAILS |
|---|---|
| Market Size in 2024 (Value) | USD 3.22 Billion |
| Market Forecast in 2030 (Value) | USD 10.02 Billion |
| Growth Rate | CAGR of 20.9% from 2025-2030 |
| Years Considered | 2022–2030 |
| Base Year | 2024 |
| Forecast Period | 2025–2030 |
| Units Considered | Value (USD Million/Billion), Volume (Ton) |
| Report Coverage | Revenue Forecast, Company Ranking, Competitive Landscape, Growth Factors, and Trends |
| Segments Covered |
|
| Regions Covered | North America, Asia Pacific, Europe, Latin America, and the Middle East & Africa |
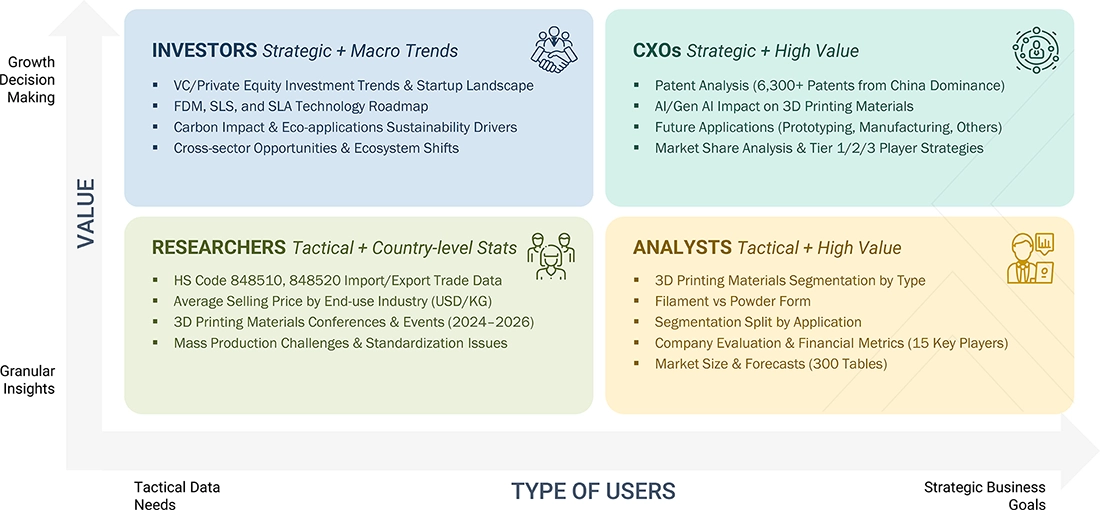
WHAT IS IN IT FOR YOU: 3D Printing Materials Market REPORT CONTENT GUIDE
DELIVERED CUSTOMIZATIONS
We have successfully delivered the following deep-dive customizations:
| CLIENT REQUEST | CUSTOMIZATION DELIVERED | VALUE ADDS |
|---|---|---|
| Raw Material Supplier (Plastics, Metals, Ceramics, Composites) |
|
|
| 3D Printer OEMs |
|
|
| 3D Printed Parts Manufacturers (Service Providers) |
|
|
| End-user Industries (Aerospace, Automotive, Healthcare, Consumer Goods) |
|
|
RECENT DEVELOPMENTS
- April 2025 : 3D Systems, Inc. partnered with the University Hospital Basel to create the world’s first in-hospital manufacturing process for 3D-printed facial implants using PEEK material. The solution uses 3D Systems’ EXT 220 MED printer and software to design and produce implants directly at the hospital, reducing lead time, improving patient customization, and ensuring compliance with EU MDR medical regulations.
- July 2024 : NAMI, an additive manufacturing company based in Saudi Arabia, partnered with 3D Systems, Inc. to acquire the company’s various 3D printing technologies, including DMP Factory 500, DMP Flex 350 Dual, and SLS 380, to utilize 3D printing for creating a localized supply chain for spare parts for Saudi Electricity Company (SEC), the largest producer, transmitter, and distributor of electrical energy in the Middle East and North Africa.
- January 2024 : Sandvik AB signed a distributor agreement with KBM Advanced Materials to manage the sales and distribution of its Osprey metal powders for additive manufacturing (AM) throughout the US. This partnership aims to significantly enhance the accessibility and availability of Sandvik’s high-quality metal powders, including titanium alloys, copper powder, nickel-based superalloys, cobalt-chrome, and ultrahard maraging steel, to US customers.
Table of Contents
 Exclusive indicates content/data unique to MarketsandMarkets and not available with any competitors.
Methodology
The study involves two major activities in estimating the current market size for the 3D printing materials market. Exhaustive secondary research was done to collect information on the market, peer market, and parent market. The next step was to validate these findings, assumptions, and sizing with industry experts across the value chain through primary research. Both top-down and bottom-up approaches were employed to estimate the complete market size. After that, market breakdown and data triangulation were used to estimate the market size of segments and subsegments.
Secondary Research
Secondary sources referred to for this research study include financial statements of companies offering 3D printing materials and information from various trade, business, and professional associations. Secondary research has been used to obtain critical information about the industry’s value chain, the total pool of key players, market classification, and segmentation according to industry trends, to the bottom-most level, and regional markets. The secondary data was collected and analyzed to arrive at the overall size of the 3D printing materials market, which was validated by primary respondents.
Primary Research
Extensive primary research was conducted after obtaining information regarding the 3D printing materials market scenario through secondary research. Several primary interviews were conducted with market experts from both the demand and supply sides across major countries of North America, Europe, Asia Pacific, the Middle East & Africa, and Latin America. Primary data was collected through questionnaires, emails, and telephonic interviews. The primary sources from the supply side included various industry experts, such as chief experience officers (CXOs), vice presidents (VPs), business development/marketing directors, product development/innovation teams, related key executives from the 3D printing materials industry, system integrators, component providers, distributors, and key opinion leaders. Primary interviews were conducted to gather insights such as market statistics, data on revenue collected from the products and services, market breakdowns, market size estimations, market forecasting, and data triangulation. Primary research also helped in understanding the various trends related to type, form, technology, application, end-use industry, and region. Stakeholders from the demand side, including CIOs, CTOs, CSOs, and installation teams of customers/end users for 3D printing materials services, were interviewed to understand the buyer’s perspective on the suppliers, products, component providers, and their current usage of 3D printing materials and future outlook of their business, which will affect the overall market.
Breakup of Primary Research:

To know about the assumptions considered for the study, download the pdf brochure
Market Size Estimation
The research methodology used to estimate the size of the 3D printing materials market includes the following details. The market size was determined from the demand side. The market was upsized based on the demand for 3D printing materials in different applications at the regional level. Such procurements provide information on the demand aspects of the 3D printing materials industry for each application. For each application, all possible segments of the 3D printing materials market were integrated and mapped.

Data Triangulation
After arriving at the overall size from the market size estimation process explained above, the total market was split into several segments and subsegments. The data triangulation and market breakdown procedures explained below were implemented, wherever applicable, to complete the overall market engineering process and arrive at the exact statistics for various market segments and subsegments. The data was triangulated by studying various factors and trends from the demand and supply sides. Along with this, the market size was validated using both the top-down and bottom-up approaches.
Market Definition
According to the US Food and Drug Administration, 3D printing is a process that creates a three-dimensional object by building successive layers of raw material. Each new layer is attached to the previous one until the object is complete. Objects are produced from a digital 3D file, such as a computer-aided design (CAD) drawing or a magnetic resonance image (MRI).
The technology of printing a 3D object from a digital file using materials such as plastic, metal, and ceramic is called 3D printing, and the materials used are called 3D printing materials. Plastics, metals (including powders), resins, and ceramics are among the materials used in 3D printing. 3D printing materials are available in a variety of shapes and sizes. Designers and engineers prefer to create functional prototypes using 3D printing materials that have the same or similar material properties as those of the final product. Plastics are the most commonly used 3D printed materials, and they are available in filament, resin, granule, and powder forms.
The development of the latest technologies and innovative materials has enabled 3D printing to become a revolutionary technology that can completely alter the dynamics of the manufacturing sector. 3D printing finds major applications in printing parts or objects in industries such as aerospace & defense, healthcare, consumer goods, and automotive.
Stakeholders
- 3D Printing Material Manufacturers
- 3D Printing Material Distributors and Suppliers
- Universities, Governments, and Research Organizations
- Associations and Industrial Bodies
- R&D Institutes
- Environmental Support Agencies
- Investment Banks and Private Equity Firms
- Research and Consulting Firms
Report Objectives
- To define, describe, and forecast the 3D printing materials market size in terms of volume and value
- To provide detailed information regarding the key factors, such as drivers, restraints, opportunities, and challenges influencing market growth
- To analyze and project the global 3D printing materials market by type, form, technology, application, end-use industry, and region
- To forecast the market size concerning five main regions (along with country-level data), namely, North America, Europe, Asia Pacific, the Middle East & Africa, and Latin America, and analyze the significant region-specific trends
- To strategically analyze micromarkets with respect to individual growth trends, prospects, and contributions of the submarkets to the overall market
- To analyze the market opportunities and the competitive landscape for stakeholders and market leaders
- To assess recent market developments and competitive strategies, such as agreements, contracts, acquisitions, and product developments/product launches, to draw the competitive landscape
- To strategically profile the key market players and comprehensively analyze their core competencies
Key Questions Addressed by the Report
What are the key applications of the 3D Printing Materials Market?
The 3D Printing Materials Market plays a crucial role across industries such as automotive, aerospace, construction, and consumer goods where advanced materials and technologies are required for performance and efficiency.
What factors are driving the growth of the 3D Printing Materials Market?
The growth of the 3D Printing Materials Market is driven by rising industrial demand, increasing adoption of advanced technologies, and expanding applications across multiple end-use industries globally.
Which regions dominate the 3D Printing Materials Market?
Asia-Pacific, North America, and Europe are leading regions in the 3D Printing Materials Market due to strong manufacturing activities, technological advancements, and increasing investments in industrial infrastructure.
Who are the major end-users in the 3D Printing Materials Market?
Key end-users in the 3D Printing Materials Market include industries such as automotive, aerospace, construction, electronics, healthcare, and packaging that require high-performance materials and solutions.
What challenges are affecting the 3D Printing Materials Market?
Major challenges in the 3D Printing Materials Market include fluctuating raw material prices, regulatory compliance requirements, supply chain disruptions, and the need for continuous product innovation.
Need a Tailored Report?
Customize this report to your needs
Get 10% FREE Customization
Customize This ReportPersonalize This Research
- Triangulate with your Own Data
- Get Data as per your Format and Definition
- Gain a Deeper Dive on a Specific Application, Geography, Customer or Competitor
- Any level of Personalization
Let Us Help You
- What are the Known and Unknown Adjacencies Impacting the 3D Printing Materials Market
- What will your New Revenue Sources be?
- Who will be your Top Customer; what will make them switch?
- Defend your Market Share or Win Competitors
- Get a Scorecard for Target Partners

Custom Market Research Services
We Will Customise The Research For You, In Case The Report Listed Above Does Not Meet With Your Requirements
Get 10% Free CustomisationTESTIMONIALS

We at Nissan Chemicals Corporation have been clients of MarketsandMarkets for more than a year now. We recently consulted MarketsandMarkets for a study, the team at MarketsandMarkets was extremely professional and organized. The business insights were very detailed and aligned well with our expectations that really helped us formulate the Business Plans and device new strategies for development themes. MarketsandMarkets offers a unique combination of expertise and dedicated engagement model. Their research findings have helped us in designing our Pricing Strategy which will make it easier for us to predict the future sales and profits for the next ten years. We look forward to working with MarketsandMarkets in the future.
VP of Strategy & New Business Development
Leading Specialty Chemical Company
The MarketsandMarkets Engagement Model, composed of both the Knowledge Store and advisory custom research, has greatly helped us in understanding our markets and making strategic decisions. The Knowledge Store is a fast way to allow everyone in our organization to understand more about most any market they are interested in. The ability to then get custom research done and get answers to specific strategic questions and market insight has been spectacular. The Markets and Markets team feel more like colleagues than vendors and their services have helped us change our culture where statements of things like growth opportunities and competitive position are always backed by industry research.

Rich Gibson,
Director, Corporate Strategy
Milliken & Company,
Leading Industrial Manufacturer of specialty chemical, floor covering, performance and protective textile materials, and healthcaremilliken.com
MarketsandMarkets is a trusted resource that helps us to better understand markets that are near-adjacencies-whether its technology, value chain or geography. Their Knowledge Store platform provides a dashboard of markets and their characteristics which is easy to use and saves us time.
Adam Shaw,
Market Development and Strategy Manager
AdvanSix Inc. USA,
An American Leader in Chemicalswww.advansix.com
The Knowledge Store from MarketsandMarkets is a valuable tool which has helped my team acquire greater insight in to the end markets that our business serves. This has enabled us to help our company build stronger strategies throughout our planning process.
TOSHIO KINOSHITA
Senior Chif Consultion Research & Consulting Division
Mitsubishi Chemical Research Corporation,
Leading Manufacturer of Chemical Productswww.mitsubishichem-res.co.jp/en/

We recently engaged with MarketsandMarkets for a study, the team not only clearly understood our business objectives but was also extremely professional in the way they handled the entire project. The study was efficiently conducted in a phase-wise manner, and the engagement model furnished us with high-quality business insights that far exceeded our expectations at each phase. We were especially happy that MarketsandMarkets could provide us with both, an English as well as a Japanese version of the study. A special thanks to the Analyst Team and Client Services Team, whose fluency in Japanese enhanced our comfort level, as we could converse with them in our preferred language.
Independent entrepreneurs
Arrow Precision
We approached MarketsandMarkets for study on Proppants Market, and their work exceeded our expectations. The study conducted was comprehensive and enabled us to view the market through the various dimensions. In addition, the team was extraordinarily responsive throughout the process and resolved our queries on time. I strongly recommend MarketsandMarkets and will certainly consider them for additional market assessments we will need in the future.
Global engineering company, Japan
Deputy Manager,
Strategic Planning OfficeThe high-quality insights shared by the MarketsandMarkets team helped us understand the pharmaceutical plant designers in a specific geography. It also captured the risks that we may likely face in communicating with our potential partners. The study would enable us identify partners, which would impact our future growth.
Growth opportunities and latent adjacency in 3D Printing Materials Market


selvaraj
Nov, 2014
Rapid prototyping material supply & demand Analysis .
Jianmeng
Feb, 2015
Specific information on Nylon application in 3D Printing Materials .
gihan
Mar, 2014
Market data for global 3D printing materials market.
Natsuko
Feb, 2016
Focus on Composites market by plastics, metals, ceramic type.
Charles
Jan, 2014
Applications of chemical resistant nulon based filament and market share by region.
Jesse
Aug, 2019
In 3D printing provide raw material analysis of metal based additive.
PANI
Jan, 2018
General information on technical ceramics.
Dorothy
Jan, 2015
Specific Information on 3d printing materials market size (current & up to 2020) worldwide and by regions (America, Europe, Asia, etc).and material providers with rankings.
Timo
May, 2014
Report title not mentioned.
Corbin
Mar, 2019
Market data on PEEK/PEKK market with filament market segment.
Rootesh
Sep, 2014
3D printing material market .
Rootesh
Sep, 2014
Looking for information on 3D printing in metals, PEEK, ceramic, plastic for luxury industry, medical industry and engineering industries..
Bill
Mar, 2018
Customized request for 3D PRINTING PLASTIC MATERIALS tables and information on PEEK that represent the plastic market .
Jorge
Feb, 2017
Market estimation for Mexican 3D Material market.
Kee
Apr, 2015
Materials for 3D printing and its market size in Asia. Possibiility of establishing a trading hub in singapore.
Artur
Oct, 2015
Global and Europe(Central and Eastern) Filaments (by types, by companies and brands) materials to be used in filaments production .
pramod
Oct, 2014
3D printing material supply in pune India.
Jason
May, 2015
Interested in 3D Printing market in Asia-Pacific region.
Andrea
Apr, 2016
Interested in 3D Printing Materials market.
Alexander
Mar, 2019
Benchmarking companys growth expectations (in 3D printing materials market) with market expectations.
Robert
Mar, 2015
Need technical information on polymers and players in supply chain (stake holders).
gamze
Feb, 2015
Request on 3D Printing Materials Market report.