
3D Printing Ceramics Market

3D Printing Ceramics Market by Type (Oxides, Non-oxides), Form (Filament, Powder, Liquid), End-use Industry (Aerospace & Defense, Healthcare, Automotive, Consumer Goods & Electronics, Other End-use Industry), and Region - Global Forecast to 2030


OVERVIEW
Source: Secondary Research, Interviews with Experts, MarketsandMarkets Analysis
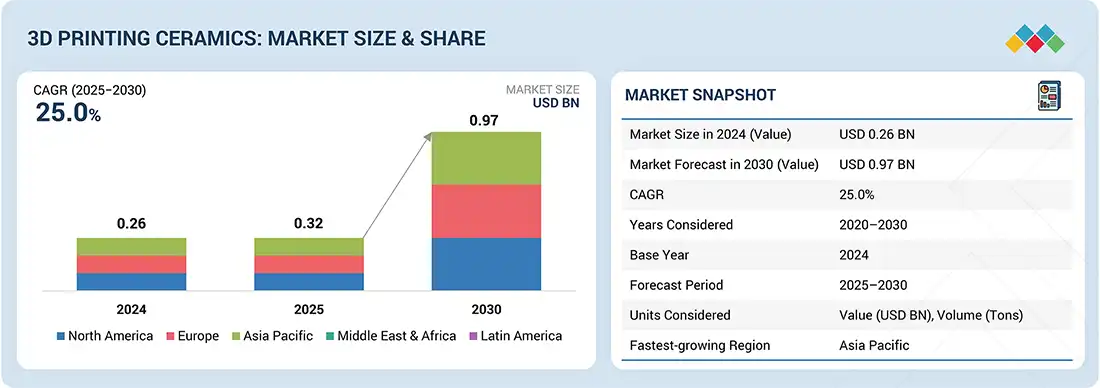
The 3D printing ceramics market is projected to reach USD 0.97 billion by 2030 from USD 0.32 billion in 2025, at a CAGR of 25.0% from 2025 to 2030. The market for 3D printing ceramics is experiencing strong growth owing to a combination of factors, including the presence of many small and large players and increasing research and development activities in key markets.
KEY TAKEAWAYS
-
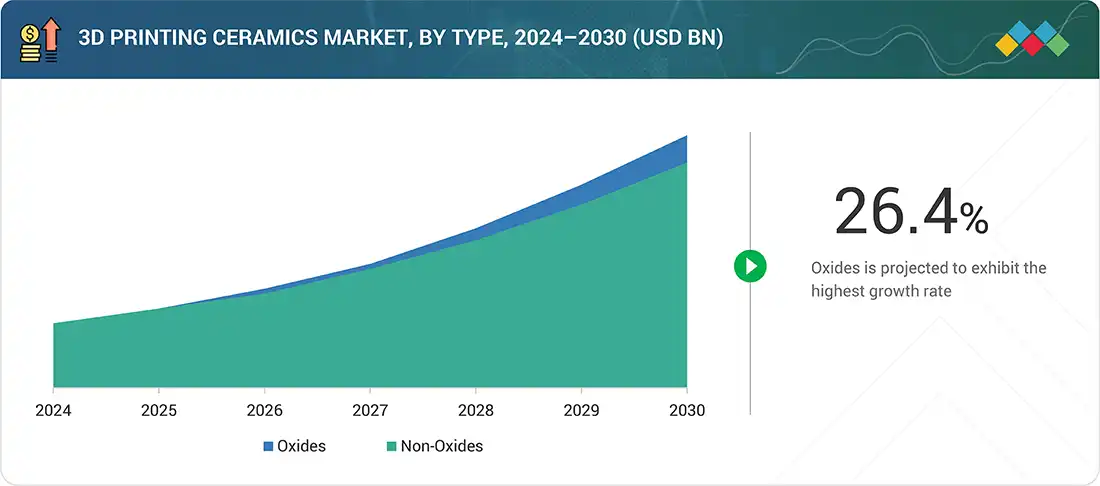
BY TYPEThe 3D printing ceramics market comprises Oxides and Non-oxides. The Oxides consist of Zirconia, Alumina, and other oxide types, whereas Non-oxides consist of Silicon Carbide, Silicon Nitride, and other non-oxide types.
-
BY FORM3D printing ceramics are available in three forms: powder, liquid, and filament. The filament form is expected to have the highest growth in the forecasted period.
-
BY END-USE INDUSTRYKey applications of 3D printing ceramics span the aerospace & defense, healthcare, automotive, consumer goods, and other end-use industries.
-
BY REGIONThe 3D printing ceramics market covers Europe, North America, Asia Pacific, South America, the Middle East, and Africa. Europe is the largest market for 3D printing ceramics and is home to several prominent aerospace companies. It is also witnessing new aircraft projects that are contributing to the increasing adoption of 3D-printed ceramics products.
-
COMPETITIVE LANDSCAPEMajor market players have adopted both organic and inorganic strategies, including partnerships and investments. For instance, Sintokogio, Ltd. (Japan), Lithoz GmbH (Austria), and SGL Carbon (France) have entered into a number of agreements and partnerships to cater to the growing demand for 3D printing ceramics across innovative applications.
The growing necessity for precise high-performance components in the aerospace, healthcare, and electronic industries serves as a major factor pushing the 3D printing ceramics market forward. Ceramic 3D printing demonstrates the capability to create intricate shapes and minimize material usage while enabling personalized solutions, which drives its increasing adoption. The increasing adoption of artificial intelligence (AI) by companies enables them to boost both their operational efficiency and product quality. For instance, 3DCeram launched the CERIA Set, which uses AI technology to enhance part design while optimizing placement and scraping parameters to achieve perfect prints with minimal waste.
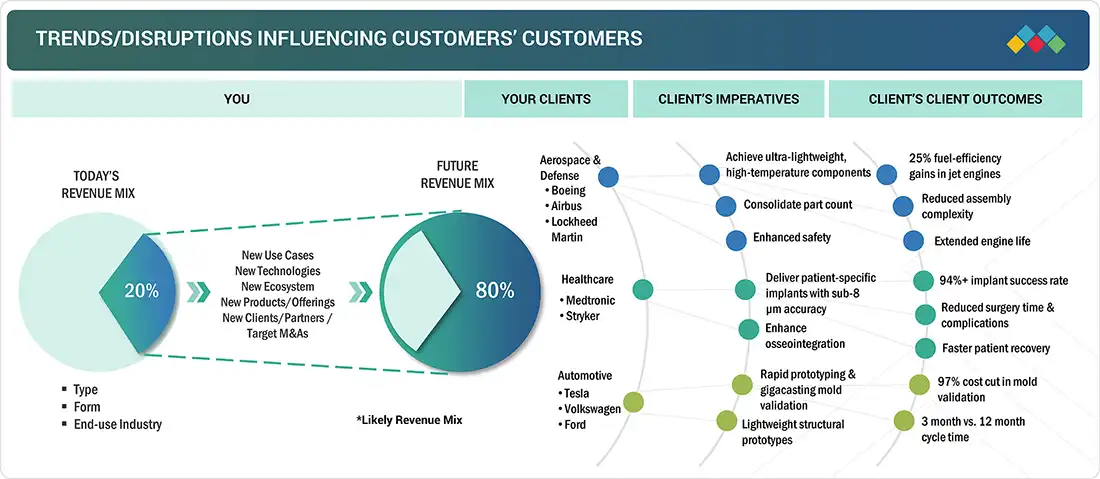
TRENDS & DISRUPTIONS IMPACTING CUSTOMERS' CUSTOMERS
The impact on consumers' business emerges from customer trends or disruptions. Hotbets are clients of 3D printing ceramics manufacturers, and target applications are clients of 3D printing ceramics manufacturers. Shifts, which are changing trends or disruptions, will impact the revenues of end users. The revenue impact on end users will affect the revenue of hotbets, which will further affect the revenues of 3D printing ceramic manufacturers.
Source: Secondary Research, Interviews with Experts, MarketsandMarkets Analysis
MARKET DYNAMICS
Level
-
Ongoing research & development

-
Increasing partnerships & collaborations among players in the ecosystem

Level
-
High cost compared to other 3D printing materials

-
Economy of scale not achieved

Level
-
Increasing investments in 3D printing ceramics manufacturing

-
Development of advanced printers compatible with ceramics

Level
-
Availability of substitutes

-
Capital-intensive production and complex manufacturing processes

Source: Secondary Research, Interviews with Experts, MarketsandMarkets Analysis
Driver: Increasing partnerships and collaborations among players in the ecosystem
The expansion of technology partnerships between providers, material developers, and equipment manufacturers is a vital force behind the 3D printing ceramics market growth. These partnerships allow companies to exchange knowledge while accelerating innovation speed and creating solutions that match industrial market needs. For instance, Lithoz made a strategic financial investment in AMAREA Technology, which develops a multi-material 3D printer that uses six different materials during a single print operation. The partnership between Lithoz and AMAREA Technology allows the creation of functionally graded parts that integrate ceramics with metals and polymers within a single structure, thus expanding potential applications for electronics, defense, and energy sectors. The partnerships between companies advances technological development while shortening market introduction time, enhancing product quality, and promoting ceramic 3D printing usage throughout various industrial sectors.
Restraint: High cost compared to other 3D printing materials
The growth of 3D printing ceramics faces significant obstacles because ceramic materials and their processing costs exceed the expenses of using polymers and certain metals in 3D printing. Technical ceramics, including alumina, along with zirconia and silicon carbide, need high-purity starting materials and complex production processes that make their manufacturing costs substantially higher. The process of ceramic 3D printing needs special machinery along with extra phases of debinding and sintering at high temperatures, which result in increased operational expenses and extended production duration.
Opportunity: Increased investments in 3D printing ceramics manufacturing
The growth of 3D printing ceramics depends heavily on rising investments because it enables technological progress alongside scalable applications and expanded industrial use. The increasing need for sophisticated ceramic components in aerospace, healthcare, and electronics industries leads businesses to invest resources in creating better printing equipment, alongside improved ceramic substances and complete production systems. The growing investment stream drives faster development of binder jetting, together with stereolithography and material jetting printing methods, because these approaches handle ceramic printing issues, including shrinkage, porosity, and brittleness, more effectively. For instance, XJet has secured substantial investment funds to advance its NanoParticle Jetting technology, representing an advanced material jetting technique that produces high-quality ceramic parts with high-resolution printing while eliminating the requirement for extensive post-processing.
Challenge: Availability of substitutes
Substitute materials present a major obstacle to the 3D printing ceramics market expansion because industries frequently choose polymers and metals over ceramics as their preferred alternative material wherever applicable. Ceramics deliver better thermal resistance, chemical inertness, and hardness than other materials, but their complex processing, expensive materials, and extended post-processing time discourage mass adoption when lower-cost or more flexible substitutes fulfill performance needs. The broad availability of functionally equivalent and cost-effective substitutes hinders the growth of ceramic 3D printing, especially in industries that focus on cost reduction and applications that do not require ceramic performance.
3D Printing Ceramics Market: COMMERCIAL USE CASES ACROSS INDUSTRIES
| COMPANY | USE CASE DESCRIPTION | BENEFITS |
|---|---|---|
 |
Integrating 3D-printed ceramic matrix composite components in Advance3 and UltraFan jet engines, including turbine blades, combustion chambers, and structural elements | 25% improvement in fuel efficiency, reduced weight, higher operating temperatures up to 1,650°C, reduced cooling air requirements, and improved engine reliability |
 |
Utilizing 3D-printed sand casting molds for gigacasting automotive components, enabling rapid prototyping of large structural parts for Model Y and other vehicles | 97% cost reduction in design validation, 3-month development cycle vs 6-12 months with metal molds, enables gigacasting of 1.5m+ components |
 |
Developing TiONIC technology for 3D-printed spinal implants with enhanced surface textures and honeycomb structures for fusion surgery | Enhanced osteoconductivity, improved bone fusion rates, customizable angles, and reduced surgery time |
Logos and trademarks shown above are the property of their respective owners. Their use here is for informational and illustrative purposes only.
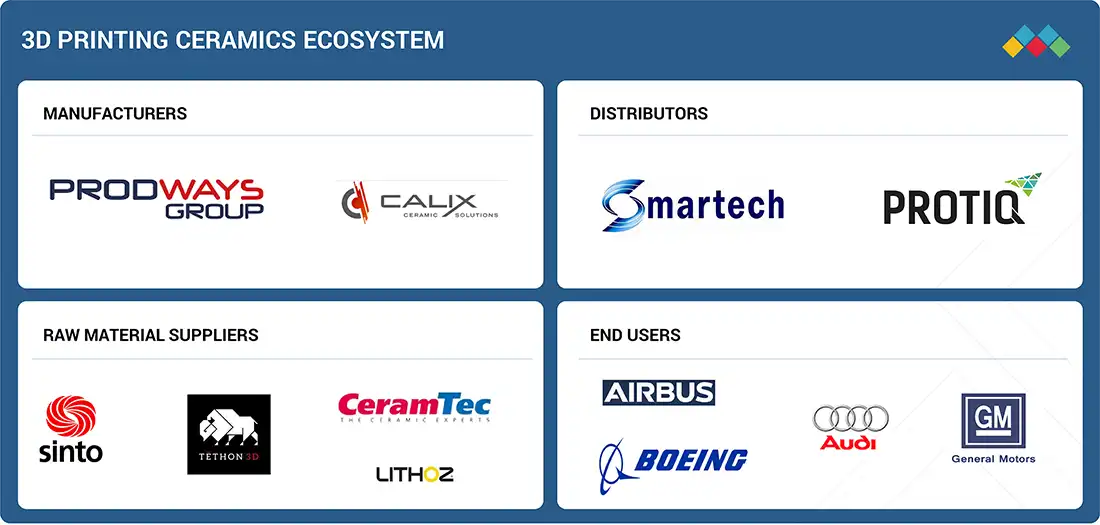
MARKET ECOSYSTEM
The 3D printing ceramics market ecosystem consists of 3D printing ceramic suppliers (Sintokogio, Ltd., Tethon 3D), 3D-printed part manufacturers (Prodways Group, Calix), distributors (PROTIQ, Smartech), and end users (Boeing, Airbus). The raw material suppliers provide ceramics to 3D printing ceramics component manufacturers. The distributors and suppliers establish contact between the manufacturing companies and end users to streamline the supply chain, increasing operational efficiency and profitability.
Logos and trademarks shown above are the property of their respective owners. Their use here is for informational and illustrative purposes only.
MARKET SEGMENTS
Source: Secondary Research, Interviews with Experts, MarketsandMarkets Analysis
3D Printing Ceramics Market, by Type
The 3D printing ceramics market shows a strong preference for oxide ceramics because these materials exist in abundance and provide excellent performance, together with versatile industrial applications. Three key oxide ceramics consisting of zirconia (ZrO2), alumina (Al2O3), and silica (SiO2) provide excellent properties such as high thermal stability and corrosion resistance, together with biocompatibility and electrical insulation. Their properties suit various applications between medical implants and dental prosthetics, as well as electronics and industrial machinery. The processing of oxides proves simpler than non-oxides since these materials maintain stability during sintering without the need for controlled atmospheres or inert conditions. The main ceramic 3D printing material producers, Lithoz, 3DCeram, and Tethon 3D, specialize in oxide-based materials because these substances deliver reliable performance in end-use applications.
3D Printing Ceramics Market, by Form
Filaments are expected to record the highest CAGR among the 3D printing ceramics market due to their cost-effectiveness, simplicity, and compatibility with standard FDM/FFF printers available on a large scale, reducing the barrier of entry compared to powders and resins that need costly, specialized equipment. Their ability to be used across industries including healthcare, aerospace, electronics, and design, coupled with the increasing development of composite ceramic filaments that are building strength and accuracy and moving their use from prototyping into finished parts, is rapidly making filaments the most scalable and ubiquitous route for the growth of ceramic 3D printing.
3D Printing Ceramics Market, by End-use Industry
The aerospace and defense sector will lead the market for 3D printing ceramics by 2030 because of the increasing need for high-performance, lightweight, and high-temperature-resistant components capable of handling very stringent operating conditions. Ceramic materials exhibit high thermal stability, resistance to corrosion, and strength, which makes them suitable for engineering applications like thermal barrier coatings, turbine parts, nozzles, radomes, and insulating components utilized in aircraft and spacecraft. 3D printing makes it possible to create complex, weight-optimized geometries that cannot or are hard to produce with conventional manufacturing technologies, contributing to better fuel efficiency and overall performance. With the growing emphasis on next-generation aircraft, reusable space systems, hypersonic missiles, and unmanned air vehicles (UAVs), the demand for enhanced materials such as technical ceramics is gaining momentum.
REGION
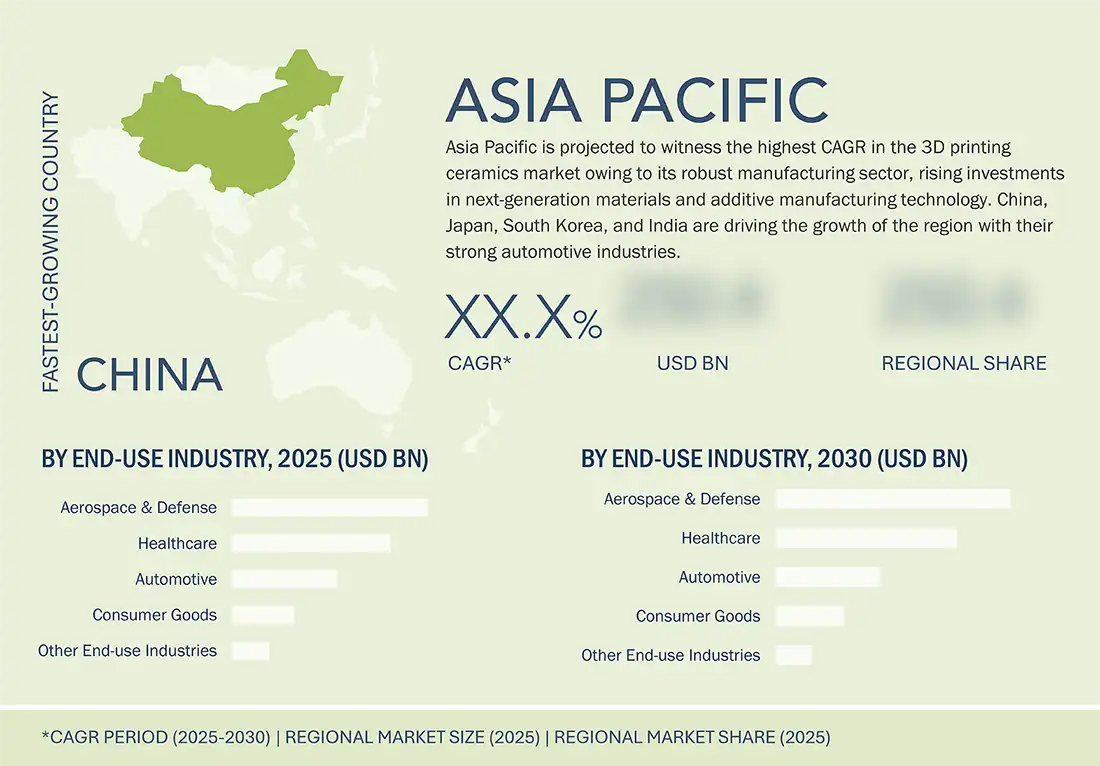
Asia Pacific to be fastest-growing region in global 3D printing ceramics market during forecast period
Asia Pacific is projected to witness the highest CAGR in the 3D printing ceramics market owing to its robust manufacturing sector, growing demand from end-use industries, and rising investments in next-generation materials and additive manufacturing technology. China, Japan, South Korea, and India are driving the growth of the region with their strong automotive, electronics, aerospace, and healthcare industries, each being a major consumer of high-performance ceramic parts. China has become a principal center for ceramic material manufacture and 3D printing hardware development, backed by industrial innovation and digital manufacturing-friendly government policies. As the region progresses to continue investing in Industry 4.0 projects and cutting-edge manufacturing technology, its dominance in ceramic additive printing will solidify further, positioning Asia Pacific as the biggest and most active 3D printing ceramics market in the world.
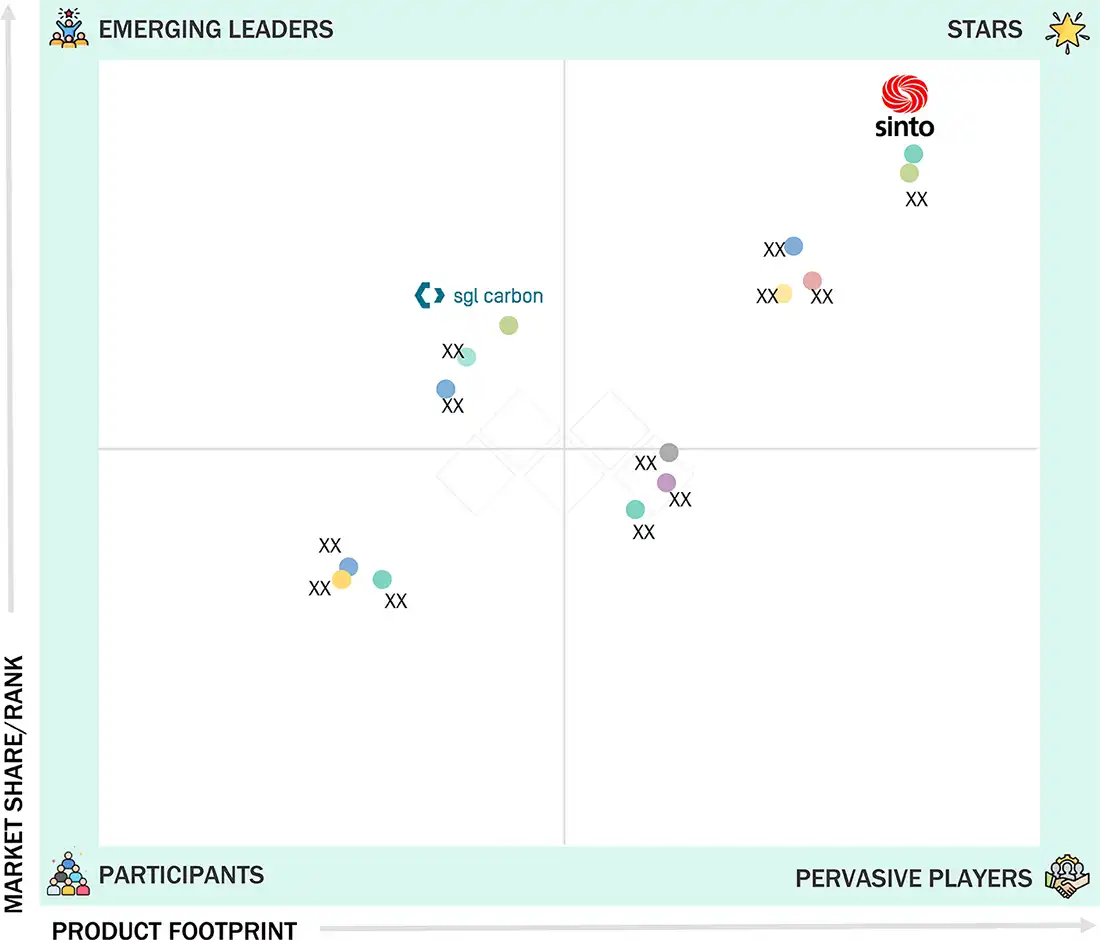
3D Printing Ceramics Market: COMPANY EVALUATION MATRIX
In the 3D printing ceramics market matrix, Sintokogio, Ltd. (Star) leads with a strong market share and extensive product footprint, driven by its collaborations and partnerships with end users. SGL Carbon (Emerging Leader) is gaining visibility with its specialized ceramics and tailored solutions for particular applications, strengthening its position through innovation and niche product offerings. While Sintokogio, Ltd. dominates through scale and a diverse portfolio, SGL Carbon shows significant potential to move toward the leaders’ quadrant as demand for 3D printing ceramics continues to rise.
Source: Secondary Research, Interviews with Experts, MarketsandMarkets Analysis
KEY MARKET PLAYERS
MARKET SCOPE
| REPORT METRIC | DETAILS |
|---|---|
| Market Size in 2024 (Value) | USD 0.26 Billion |
| Market Forecast in 2030 (Value) | USD 0.97 Billion |
| Growth Rate | CAGR of 25.0% from 2025–2030 |
| Years Considered | 2021–2030 |
| Base Year | 2024 |
| Forecast Period | 2025–2030 |
| Units Considered | Value (USD Million/Billion) and Volume (Ton) |
| Report Coverage | Revenue Forecast, Company Ranking, Competitive Landscape, Growth Factors, and Trends |
| Segments Covered |
|
| Regions Covered | North America, Asia Pacific, Europe, Latin America, and Middle East & Africa |
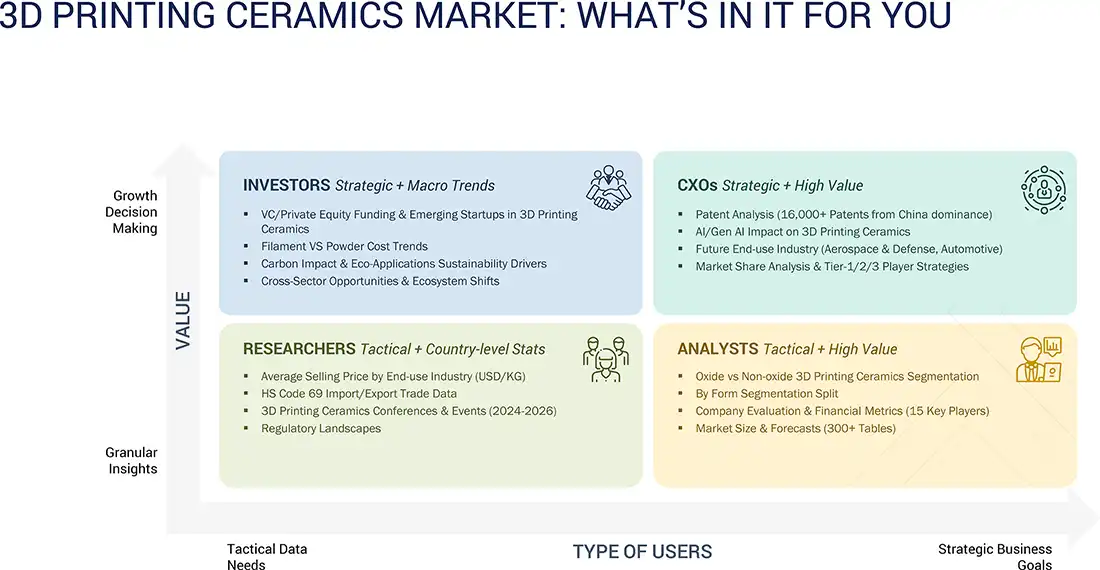
WHAT IS IN IT FOR YOU: 3D Printing Ceramics Market REPORT CONTENT GUIDE
DELIVERED CUSTOMIZATIONS
We have successfully delivered the following deep-dive customizations:
| CLIENT REQUEST | CUSTOMIZATION DELIVERED | VALUE ADDS |
|---|---|---|
| Raw Material Supplier |
|
|
| 3D Printing Ceramic Manufacturer |
|
|
| Ceramic 3D-printed Parts Manufacturer |
|
|
| End User |
|
|
RECENT DEVELOPMENTS
- May 2025 : Nanoe acquired the Upryze-Shock ceramic powder line from Saint-Gobain ZirPro, including technology transfer, customer portfolio, and exclusive patent rights. Upryze-Shock is a high-toughness zirconia-based material co-stabilized with ceria and yttria and reinforced with alumina platelets. Its production has now fully transitioned to Nanoe’s facilities.
- May 2025 : Lithoz launched LithaBite, a translucent, alumina-based 3D printing material designed for high-precision orthodontic brackets, earning enthusiastic response from orthodontists. Leveraging Lithoz’s LCM technology, the material marks a significant advancement in personalized, discreet orthodontic solutions.
- March 2025 : Nanoe introduced its latest ceramic filament, Zetamix TiO2, at EUCAP 2025, tailored for high-performance RF applications. This sinterable titanium dioxide (rutile)-based filament offers an exceptional permittivity of ~75 with low dielectric losses, making it ideal for compact and lightweight components like antennas and dielectric resonators.
Table of Contents
 Exclusive indicates content/data unique to MarketsandMarkets and not available with any competitors.
Methodology
The study involves two major activities in estimating the current market size for the 3D printing ceramics market. Exhaustive secondary research was done to collect information on the market, peer market, and parent market. The next step was to validate these findings, assumptions, and sizing with industry experts across the value chain through primary research. Both top-down and bottom-up approaches were employed to estimate the complete market size. After that, market breakdown and data triangulation were used to estimate the market size of segments and subsegments.
Secondary Research
Secondary sources referred to for this research study include financial statements of companies offering 3D printing ceramics and information from various trade, business, and professional associations. Secondary research has been used to obtain critical information about the industry’s value chain, the total pool of key players, market classification, and segmentation according to industry trends, to the bottom-most level, and regional markets. The secondary data was collected and analyzed to arrive at the overall size of the 3D printing ceramics market, which was validated by primary respondents.
Primary Research
Extensive primary research was conducted after obtaining information regarding the 3D printing ceramics market scenario through secondary research. Several primary interviews were conducted with market experts from both the demand and supply sides across major countries of North America, Europe, Asia Pacific, the Middle East & Africa, and Latin America. Primary data was collected through questionnaires, emails, and telephonic interviews. The primary sources from the supply side included various industry experts, such as chief experience officers (CXOs), vice presidents (VPs), business development/marketing directors, product development/innovation teams, related key executives from the 3D printing ceramics industry, system integrators, component providers, distributors, and key opinion leaders. Primary interviews were conducted to gather insights such as market statistics, data on revenue collected from the products and services, market breakdowns, market size estimations, market forecasting, and data triangulation. Primary research also helped understand the various trends related to fiber type, resin type, diameter, surface treatment, tensile strength, application, and region. Stakeholders from the demand side, including CIOs, CTOs, CSOs, and installation teams of customers/end users for 3D printing ceramics services, were interviewed to understand the buyer’s perspective on the suppliers, products, component providers, and their current usage of 3D printing ceramics and future outlook of their business which will affect the overall market.
Breakup of Primary Research

To know about the assumptions considered for the study, download the pdf brochure
Market Size Estimation
The research methodology used to estimate the size of the 3D printing ceramics market includes the following details. The market size was determined from the demand side. The market was upsized based on the demand for 3D printing ceramics in different applications at the regional level. Such procurements provide information on the demand aspects of the 3D printing ceramics industry for each application. For each application, all possible segments of the 3D printing ceramics market were integrated and mapped.

Data Triangulation
After arriving at the overall size from the market size estimation process explained above, the total market was split into several segments and subsegments. The data triangulation and market breakdown procedures explained below were implemented, wherever applicable, to complete the overall market engineering process and arrive at the exact statistics for various market segments and subsegments. The data was triangulated by studying various factors and trends from the demand and supply sides. Along with this, the market size was validated using both the top-down and bottom-up approaches.
Market Definition
Additive manufacturing technologies help print a three-dimensional (3D) object from a digital file using materials such as plastics, metals, and ceramics. Ceramics are a category of non-metallic inorganic compounds that exhibit high strength, brittleness, melting point, and thermal & electric insulation. These materials are broadly classified into two types: oxides and non-oxides. They come in the forms of powder, liquid (resin), and filament. Powdered and liquid ceramics are mainly used for industrial purposes, while filaments are used by hobbyists and artists. 3D printing ceramics has a wide range of applications, such as thermal insulation in the aerospace industry, body armor in the defense industry, bone and dental implants in the healthcare industry, fuel cells and shock absorbers in the automobile industry, and others, including jewelry, pumps, and refractories.
Stakeholders
- 3D printing ceramic manufacturers
- 3D printing ceramic distributors and suppliers
- Universities, governments, and research organizations
- Associations and industrial bodies
- R&D institutes
- Environmental support agencies
- Investment banks and private equity firms
- Research and consulting firms
Report Objectives
- To define, describe, and forecast the 3D printing ceramics market size in terms of volume and value
- To provide detailed information regarding the key factors, such as drivers, restraints, opportunities, and challenges influencing market growth
- To analyze and project the global 3D printing ceramics market by ceramic type, form, End-use industry, and region
- To forecast the market size concerning five main regions (along with country-level data), namely, North America, Europe, Asia Pacific, the Middle East & Africa, and Latin America, and analyze the significant region-specific trends
- To strategically analyze micromarkets with respect to individual growth trends, prospects, and contributions of the submarkets to the overall market
- To analyze the market opportunities and the competitive landscape for stakeholders and market leaders
- To assess recent market developments and competitive strategies, such as agreements, contracts, acquisitions, and product developments/product launches, to draw the competitive landscape
- To strategically profile the key market players and comprehensively analyze their core competencies
Key Questions Addressed by the Report
Who are the major companies in the 3D printing ceramics market? What key strategies have market players adopted to strengthen their market presence?
Major companies include Sintokogio, Ltd. (Japan), Lithoz GmbH (Austria), SGL Carbon (France), CeramTec GmbH (Germany), Tethon 3D (US), Saint-Gobain (France), Nanoe (France), Jiangsu Sanzer New Materials Technology Co., Ltd. (China), and KYOCERA Corporation (Japan). Key strategies include product launches, acquisitions, and expansions to enhance market presence.
What are the drivers and opportunities for the 3D printing ceramics market?
The market is driven by increasing R&D activities and growing investments in the 3D printing ceramics industry. These factors are creating opportunities for innovation and expansion across industries.
Which region is projected to account for the largest market share?
Europe is projected to hold the largest market share, supported by the presence of major manufacturers and strong R&D initiatives in 3D printing ceramics.
What is the projected growth rate of the 3D printing ceramics market over the next five years?
The market is expected to grow at a CAGR of 25.0% during the forecast period, in terms of value.
How is the 3D printing ceramics market aligned for future growth?
The market is well-positioned for growth due to increasing demand in aerospace & defense, healthcare, and consumer goods & electronics sectors.
Need a Tailored Report?
Customize this report to your needs
Get 10% FREE Customization
Customize This ReportPersonalize This Research
- Triangulate with your Own Data
- Get Data as per your Format and Definition
- Gain a Deeper Dive on a Specific Application, Geography, Customer or Competitor
- Any level of Personalization
Let Us Help You
- What are the Known and Unknown Adjacencies Impacting the 3D Printing Ceramics Market
- What will your New Revenue Sources be?
- Who will be your Top Customer; what will make them switch?
- Defend your Market Share or Win Competitors
- Get a Scorecard for Target Partners

Custom Market Research Services
We Will Customise The Research For You, In Case The Report Listed Above Does Not Meet With Your Requirements
Get 10% Free CustomisationTESTIMONIALS

We at Nissan Chemicals Corporation have been clients of MarketsandMarkets for more than a year now. We recently consulted MarketsandMarkets for a study, the team at MarketsandMarkets was extremely professional and organized. The business insights were very detailed and aligned well with our expectations that really helped us formulate the Business Plans and device new strategies for development themes. MarketsandMarkets offers a unique combination of expertise and dedicated engagement model. Their research findings have helped us in designing our Pricing Strategy which will make it easier for us to predict the future sales and profits for the next ten years. We look forward to working with MarketsandMarkets in the future.
VP of Strategy & New Business Development
Leading Specialty Chemical Company
The MarketsandMarkets Engagement Model, composed of both the Knowledge Store and advisory custom research, has greatly helped us in understanding our markets and making strategic decisions. The Knowledge Store is a fast way to allow everyone in our organization to understand more about most any market they are interested in. The ability to then get custom research done and get answers to specific strategic questions and market insight has been spectacular. The Markets and Markets team feel more like colleagues than vendors and their services have helped us change our culture where statements of things like growth opportunities and competitive position are always backed by industry research.

Rich Gibson,
Director, Corporate Strategy
Milliken & Company,
Leading Industrial Manufacturer of specialty chemical, floor covering, performance and protective textile materials, and healthcaremilliken.com
MarketsandMarkets is a trusted resource that helps us to better understand markets that are near-adjacencies-whether its technology, value chain or geography. Their Knowledge Store platform provides a dashboard of markets and their characteristics which is easy to use and saves us time.
Adam Shaw,
Market Development and Strategy Manager
AdvanSix Inc. USA,
An American Leader in Chemicalswww.advansix.com
The Knowledge Store from MarketsandMarkets is a valuable tool which has helped my team acquire greater insight in to the end markets that our business serves. This has enabled us to help our company build stronger strategies throughout our planning process.
TOSHIO KINOSHITA
Senior Chif Consultion Research & Consulting Division
Mitsubishi Chemical Research Corporation,
Leading Manufacturer of Chemical Productswww.mitsubishichem-res.co.jp/en/

We recently engaged with MarketsandMarkets for a study, the team not only clearly understood our business objectives but was also extremely professional in the way they handled the entire project. The study was efficiently conducted in a phase-wise manner, and the engagement model furnished us with high-quality business insights that far exceeded our expectations at each phase. We were especially happy that MarketsandMarkets could provide us with both, an English as well as a Japanese version of the study. A special thanks to the Analyst Team and Client Services Team, whose fluency in Japanese enhanced our comfort level, as we could converse with them in our preferred language.
Independent entrepreneurs
Arrow Precision
We approached MarketsandMarkets for study on Proppants Market, and their work exceeded our expectations. The study conducted was comprehensive and enabled us to view the market through the various dimensions. In addition, the team was extraordinarily responsive throughout the process and resolved our queries on time. I strongly recommend MarketsandMarkets and will certainly consider them for additional market assessments we will need in the future.
Global engineering company, Japan
Deputy Manager,
Strategic Planning OfficeThe high-quality insights shared by the MarketsandMarkets team helped us understand the pharmaceutical plant designers in a specific geography. It also captured the risks that we may likely face in communicating with our potential partners. The study would enable us identify partners, which would impact our future growth.


Growth opportunities and latent adjacency in 3D Printing Ceramics Market