Acids & Nutrients in Animal Nutrition Market by Type (Amino Acids & Proteins, Minerals, Vitamins, Fibers & Carbohydrates & Organic Acids), by Livestock (Ruminant, Poultry, Aqua, Swine & Equine) - Global Trends & Forecast to 2019


Acids and nutrient content in the feed is highly required and necessary for the proper growth and maintenance of animals. Acids & nutrients in animal nutrition market is an emerging industry due to the increase in awareness and growth in developing countries, which provide a constant support for the revenue. Although the current scenario depicts a wide range of application, the major market is focused towards the ruminant, poultry, and swine feeds. The aquatic and equine feed depicts a small share in the pie but is growing at an exponential rate due to an increase in the awareness. The ruminant feed market has reached a stagnation level and is growing at a slow pace mainly due to economic development in the small countries.
The different type of acids and nutrition included in the study are similar to that of food but in different quantity and ratio. The amino acids segment has the dominance over the market size, with the largest share in the acids & nutrients in animal nutrition market. The regions considered for the study include North America, Europe, Asia-Pacific countries and Rest of the World. Amino acids, poultry and Asia-Pacific countries acquire the largest share in the category of type, application, and region respectively.
Acid & Nutrients in Animal Nutrition Market Size, by Geography 2014 VS 2019 ($Billion)
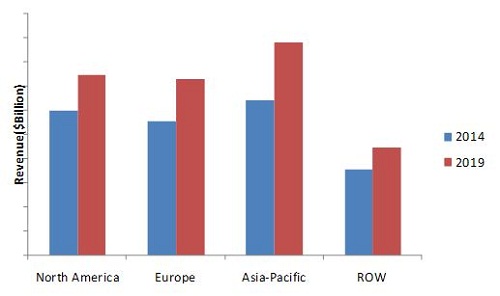
Source: MarketsandMarkets Analysis
The report classifies and defines the acids & nutrients in animal nutrition market by value and volume. In terms of value, it is estimated to reach $14.1 Billion by 2019. It also includes the qualitative and technical data pertaining to feed nutrition such as sub type, source, application, and others. The report also provides a comprehensive review of the drivers, restraints, opportunities, and key issues in the feed nutrition industry. The major players in the market have also been identified and profiled.
Scope of the Report
The global acids & nutrients in animal nutrition market has been analyzed in terms of value and volume on the basis of the following classification.
By type
- Vitamin
- Minerals
- Protein
- Carbohydrates
- Amino acids
- Organic acids
- Fibers
- Others
By application
- Ruminant feed
- Poultry feed
- Aquatic feed
- Swine feed
- Equine feed
By region
- North America
- Europe
- Asia-Pacific
- Rest of the world (ROW)
Customization Options:
Your company�sspecific needs can be met by the customization. Modify the report to get an in-depth analysis and exhaustive industry information of the following considerations:
Application Analysis
- Potential opportunities for manufacturers to focus on different applications of livestock from region to region
- Study ofthe aqua and equine applications, which are rapidly growing in all the regions
Market TrendAnalysis
- Tracking of the global meat consumption markets that drive the demandfor acid and nutrients market
- Review of the health concerns of consumers related to consumption of unhealthy meat
- Study ofthe state and national government regulations in different regions related to animal husbandry and feed production
Supply Chain Analysis
- Tracking of the rising prices of raw materials,such asamino acids and vitamins,and its processing
- Study the climatic disturbances which adversely affect the raw materials
- Detailed supplier analysis for animal feed acids and nutrients
Competitive Intelligence
- Means to achieve cost-effectiveness in production for sustainable growth
- Ways to reduce the high initial investments for entering the market
- Appropriate investments in research and development activities to provide anenhanced and wide product portfolio
With the growing opportunities in the pork, meat, beef, and milk industries, the concept of animal feed is converting to animal nutrition. It is estimated that in coming years the concept will be transformed completely. The manufacturers are realizing the importance of serving animals with essential nutrients as it strengthens the immune system of animals, improves their health., This increases the productivity of the animals, which eventually increases revenue in the acids & nutrients in animal nutrition market. The changing consumer patterns that result in the growth of non-vegetarian food that includes, meat, chicken, sea food and others forms a major share in the revenue generated by animal feed manufacturers. Although the relation is indirect and there are various stages in the value chain, the profit share goes to animal feed manufacturers as the market is controlled by them. Feed acids and nutrients form a part of animal feed and almost all the animal feed manufacturers are into manufacturing nutrients as well. The increasing demand for animal products is leading the animal manufacturers to contribute into the animal nutrition segment as well.
The report majorly focuses on various types of nutrients & acids such as proteins, minerals, vitamins, amino acids, carbohydrates, organic acids, fibers and rest are categorized under others. The availability of various types of nutrients in the market helps the manufacturers to provide animals with essential nutrients and helps to prevent various diseases. The application segments in the report include ruminant, poultry, aqua, swine, and equine. The growth in the application market is also a reason behind the growth in the acids and in animal nutrition market. The application market grows because of reasons such as increasing end-use industry, increasing animal population, among others.
Acids & Nutrients in Animal Nutrition Market Size, by Type, 2014 VS 2019 ($Billion)
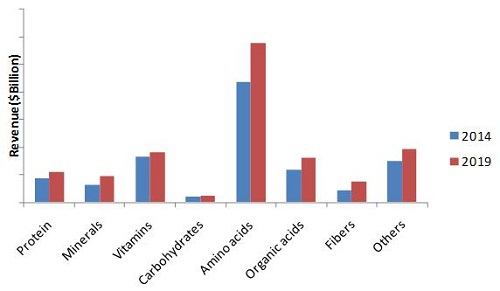
Source: MarketsandMarkets Analysis
The above figure showcases the ratio of each type of nutrient in the overall revenue that is estimated to reach $14.1 billion by 2019. The amino acids segment is estimated to acquire the largest share in 2014 and is projected to have the highest share in 2019 as well. The amino acids segment acquires the largest share due its widespread applications and capability to be used as protein and functions of protein.
 Exclusive indicates content/data unique to MarketsandMarkets and not available with any competitors.
Table Of Contents
1 Introduction (Page No. - 17)
1.1 Objectives
1.2 Report Description
1.3 Markets Covered
1.4 Stakeholders
1.5 Research Methodolgy
1.5.1 Market Size Estimation
1.5.2 Key Data Taken From Secondary Sources
1.5.3 Key Data Taken From Primary Sources
1.5.4 Assumptions Made For This Report
2 Executive Summary (Page No. - 26)
3 Market Overview (Page No. - 28)
3.1 Introduction
3.2 Acids & Nutrients in Animal Nutrition
3.2.1 Key Features
3.2.1.1 Increasing Health Issues and Awareness Among People
3.2.1.2 Growing Demand For Meat Products
3.2.2 Global Market For Acids and Nutrients in Animal Nutrition
3.2.2.1 Asia-Pacific Market For Acids and Nutrients in Animal Nutrition Is Showing A Great Potential
3.2.3 Types of Acids & Nutrients in Animal Nutrition
3.2.3.1 Proteins
3.2.3.2 Minerals
3.2.3.3 Vitamins
3.2.3.4 Carbohydrates
3.2.3.5 Amino Acids
3.2.3.6 Organic Acids
3.2.3.7 Fibers
3.2.4 Applications of Acids and Nutrients in Animal Nutrition
3.2.4.1 Ruminant Feed
3.2.4.2 Poultry Feed
3.2.4.3 Aquafeed
3.2.4.4 Swine Feed
3.2.4.5 Equine Feed
3.3 Key Players in The Industry
3.3.1 Market Share Analysis
3.3.1.1 BASF Se; A Leading Player in Global Acids & Feed Nutrition
3.3.2 Regional Market Share Analysis
3.3.2.1 Asia-Pacific
3.3.2.1.1 Cargill Acquired Major Share of The Market in Asia-Pacific
3.3.2.2 North America
3.3.2.2.1 Cargill: A Market Leader in North America
3.3.2.3 Europe
3.3.2.3.1 BASF Se: A Dominationg Player in The Region
3.4 SWOT Analysis
3.4.1 BASF Se
3.4.2 Adisseo France S.A.S.
3.4.3 Royal DSM N.V.
3.4.4 Cargill, Inc.
3.4.5 Nutreco N.V. (The Netherlands)
4 Market Analysis (Page No. - 48)
4.1 Introduction
4.2 Winning Imperatives
4.2.1 Providing Animals With Appropriate Nutrients & Maintaining Its Quantity in Feed
4.2.2 Investments in R&D
4.3 Burning Issue
4.3.1 Non-Genetically Modified Feeds
4.4 Market Dynamics
4.4.1 Impact Analysis
4.4.2 Drivers
4.4.2.1 Rise in Global Meat Consumption
4.4.2.2 Increasing Awareness About Health Issues
4.4.3 Restraints
4.4.3.1 Increase in Cost of Production
4.4.3.2 Cumbersome Regulatory Product Approval Process
4.4.4 Opportunity
4.4.4.1 Demographic Changes in Food Preferences Create Market For Feed Acids & Nutrients
4.5 Porter�s Five Forces
4.5.1 Degree of Competition
4.5.2 Bargaining Power of Suppliers
4.5.3 Bargaining Power of Buyers
4.5.4 Threat of New Entrants
4.5.5 Threat of Substitutes
4.6 Supply Chain Analysis
5 Total Addressable Market (Page No. - 61)
5.1 Introduction
5.1.1 Ruminant
5.1.2 Poultry
5.1.3 Aquaculture
5.1.4 Swine
5.1.5 Equine
6 Acids & Nutrients in Animal Nutrition Market, By Type (Page No. - 67)
6.1 Introduction
6.2 Amino Acids & Proteins
6.3 Minerals
6.4 Vitamins
6.4.1 Vitamin A
6.4.2 Vitamin E
6.4.3 Vitamin B2
6.4.4 Vitamin C
6.5 Fibers & Carbohydrates
6.6 Organic Acids
6.7 Others
7 Acids & Nutrients in Animal Nutrition Market, By Livestock (Page No. - 109)
7.1 Introduction
7.2 Ruminant Feed
7.3 Poultry Feed
7.4 Aquafeed
7.5 Swine Feed
7.6 Equine Feed
7.7 Other Livestock Types
8 Acids & Nutrients in Animal Nutrition Market, By Geography (Page No. - 159)
8.1 Introduction
8.1.1 North America
8.1.2 Europe
8.1.3 Asia-Pacific
8.1.4 Rest of The World
9 Competitive Landscape (Page No. - 173)
9.1 Introduction
9.2 Expansion: The Most Preferred Strategic Approach
9.3 Maximum Number of Developments Recorded in 2012
9.4 Cargill, Inc.: Most Active Company
9.5 Mergers & Acquisitions
9.6 Expansions & Investments
9.7 New Product Launches
9.8 Agreements, Joint Ventures & Collaborations
10 Company Profiles (Company At A Glance, Recent Financials, Products & Services, Strategies & Insights, & Recent Developments)* (Page No. - 194)
10.1 Adisseo France S.A.S
10.2 Archer Daniels Midland Company
10.3 BASF SE
10.4 Cargill, Incorporated
10.5 Charoen Pokphand Foods Pcl.
10.6 Royal DSM N.V.
10.7 Evonik Industries Ag
10.8 Nutreco N.V.
10.9 Alltech
10.10 Novus International, Inc.
*Details on Company At A Glance, Recent Financials, Products & Services, Strategies & Insights, & Recent Developments Might Not Be Captured in Case of Unlisted Companies.
List of Tables (116 Tables)
Table 1 Population Trend, By Country/Region, 2010-2020 (Million)
Table 2 Addressable Markets For Animal Feed Nutrients, 2014-2019 ($Billion)
Table 3 Feed Market Size, By Livestock, 2013 (Million Metric Tons)
Table 4 Amino Acids & Proteins in Animal Nutrition Market Size, By Geography, 2012-2019 ($Million)
Table 5 Amino Acids & Proteins in Animal Nutrition Market Size, By Livestock, 2012-2019 ($Million)
Table 6 Amino Acids & Proteins in Animal Nutrition Market Size, By Subtype, 2012-2019 ($Million)
Table 7 North America: Amino Acids & Proteins in Animal Nutrition Market Size, By Livestock, 2012-2019 ($Million)
Table 8 Europe: Amino Acids & Proteins in Animal Nutrition Market Size, By Livestock, 2012-2019 ($Million)
Table 9 Asia-Pacific: Amino Acids & Proteins in Animal Nutrition Market Size, By Livestock, 2012-2019 ($Million)
Table 10 ROW: Amino Acids & Proteins in Animal Nutrition Market Size, By Livestock, 2012-2019 ($Million)
Table 11 Minerals in Animal Nutrition Market Size, By Geography, 2012-2019 ($Million)
Table 12 Minerals in Animal Nutrition Market Size, By Livestock, 2012-2019 ($Million)
Table 13 Minerals in Animal Nutrition Market Size, By Subtype, 2012-2019 ($Million)
Table 14 North America: Minerals in Animal Nutrition Market Size, By Livestock, 2012-2019 ($Million)
Table 15 Europe: Minerals in Animal Nutrition Market Size, By Livestock, 2012-2019 ($Million)
Table 16 Asia-Pacific: Minerals in Animal Nutrition Market Size, By Livestock, 2012-2019 ($Million)
Table 17 ROW: Minerals in Animal Nutrition Market Size, By Livestock, 2012-2019 ($Million)
Table 18 Vitamins in Animal Nutrition Market Size, By Geography, 2012-2019 ($Million)
Table 19 Vitamins in Animal Nutrition Market Size, By Livestock, 2012-2019 ($Million)
Table 20 Vitamins in Animal Nutrition Market Size, By Subtype, 2012-2019 ($Million)
Table 21 North America: Vitamins in Animal Nutrition Market Size, By Livestock, 2012-2019 ($Million)
Table 22 Europe: Vitamins in Animal Nutrition Market Size, By Livestock, 2012-2019 ($Million)
Table 23 Asia-Pacific: Vitamins in Animal Nutrition Market Size, By Livestock, 2012-2019 ($Million)
Table 24 ROW: Vitamins in Animal Nutrition Market Size, By Livestock, 2012-2019 ($Million)
Table 25 Fibers & Carbohydrates in Animal Nutrition Market Size, By Geography, 2012-2019 ($Million)
Table 26 Fibers & Carbohydrates in Animal Nutrition Market Size, By Livestock, 2012-2019 ($Million)
Table 27 North America: Fibers & Carbohydrates in Animal Nutrition Market Size, By Livestock, 2012-2019 ($Million)
Table 28 Europe: Fibers & Carbohydrates in Animal Nutrition Market Size, By Livestock, 2012-2019 ($Million)
Table 29 Asia-Pacific: Fibers & Carbohydrates in Animal Nutrition Market Size, By Livestock, 2012-2019 ($Million)
Table 30 ROW: Fibers & Carbohydrates in Animal Nutrition Market Size, By Livestock, 2012-2019 ($Million)
Table 31 Organic Acids in Animal Nutrition Market Size, By Geography, 2012-2019 ($Million)
Table 32 Organic Acids in Animal Nutrition Market Size, By Livestock, 2012-2019 ($Million)
Table 33 North America: Organic Acids in Animal Nutrition Market Size, By Livestock, 2012-2019 ($Million)
Table 34 Europe: Organic Acids in Animal Nutrition Market Size, By Livestock, 2012-2019 ($Million)
Table 35 Asia-Pacific: Organic Acids in Animal Nutrition Market Size, By Livestock, 2012-2019 ($Million)
Table 36 ROW: Organic Acids in Animal Nutrition Market Size, By Livestock, 2012-2019 ($Million)
Table 37 Other Acids & Nutrients in Animal Nutrition Market Size, By Geography, 2012-2019 ($Million)
Table 38 Other Acids and Nutrients in Animal Nutrition Market Size, By Livestock, 2012-2019 ($Million)
Table 39 North America: Other Acids & Nutrients in Animal Nutrition Market Size, By Livestock, 2012-2019 ($Million)
Table 40 Europe: Other Acids & Nutrients in Animal Nutrition Market Size, By Livestock, 2012-2019 ($Million)
Table 41 Asia-Pacific: Other Acids and Nutrients in Animal Nutrition Market Size, By Livestock, 2012-2019 ($Million)
Table 42 ROW: Other Acids & Nutrients in Animal Nutrition Market Size, By Livestock, 2012-2019 ($Million)
Table 43 Ruminant Feed Acids & Nutrients Market Size, By Geography, 2012-2019 ($Million)
Table 44 Ruminant Feed Acids & Nutrients Market Size , By Type, 2012-2019 ($Million)
Table 45 Ruminant Feed Amino Acids & Proteins Market Size, By Geography, 2012-2019 ($Million)
Table 46 Ruminant Feed Organic Acids Market Size, By Geography, 2012-2019 ($Million)
Table 47 Ruminant Feed Minerals Market Size, By Geography, 2012-2019 ($Million)
Table 48 Ruminant Feed Vitamins Market Size , By Geography, 2012-2019 ($Million)
Table 49 Ruminant Feed Fibers & Carbohydrates Market Size, By Geography, 2012-2019 ($Million)
Table 50 Other Ruminant Feed Acids & Nutrientsmarket Size, By Geography, 2012-2019 ($Million)
Table 51 Poultry Feed Acids & Nutrients Market Size, By Geography, 2012-2019 ($Million)
Table 52 Poultry Feed Acids & Nutrients Market Size For, By Type, 2012-2019 ($Million)
Table 53 Poultry Feed Amino Acids & Proteins Market Size, By Geography, 2012-2019 ($Million)
Table 54 Poultry Feed Organic Acids Market Size, By Geography, 2012-2019 ($Million)
Table 55 Poultry Feed Minerals Market Size, By Geography, 2012-2019 ($Million)
Table 56 Poultry Feed Vitamins Market Size, By Geography, 2012-2019 ($Million)
Table 57 Poultry Feed Fibers & Carbohydrates Market Size, By Geography, 2012-2019 ($Million)
Table 58 Poultry Feed Other Acids & Nutrients Market Size, By Geography, 2012-2019 ($Million)
Table 59 Aquafeed Acids & Nutrients Market Size Aquafeed, By Geography, 2012-2019 ($Million)
Table 60 Aquafeed Acids & Nutrients Market Size Aquafeed, By Type, 2012-2019 ($Million)
Table 61 Aquafeed Amino Acids & Proteins Market Size Aquafeed, By Geography, 2012-2019 ($Million)
Table 62 Aquafeed Organic Acids Market Size Aquafeed, By Geography, 2012-2019 ($Million)
Table 63 Aquafeed Minerals Market Size Aquafeed, By Geography, 2012-2019 ($Million)
Table 64 Aquafeed Vitamins Market Size Aquafeed, By Geography, 2012-2019 ($Million)
Table 65 Aquafeed Fibers & Carbohydrates Market Size Aquafeed, By Geography, 2012-2019 ($Million)
Table 66 Other Aquafeed Acids & Nutrients Market Size Foraquafeed, By Geography, 2012-2019 ($Million)
Table 67 Swine Feed Acids & Nutrients Market Size, By Geography, 2012-2019 ($Million)
Table 68 Swine Feed Acids & Nutrients Market Size, By Type, 2012-2019 ($Million)
Table 69 Swine Feed Amino Acids & Proteins Market Size, By Geography, 2012-2019 ($Million)
Table 70 Swine Feed Organic Acids Market Size, By Geography, 2012-2019 ($Million)
Table 71 Swine Feed Minerals Market Size, By Geography, 2012-2019 ($Million)
Table 72 Swine Feed Vitamins Market Size, By Geography, 2012-2019 ($Million)
Table 73 Swine Feed Fibers & Carbohydrates Market Size, By Geography, 2012-2019 ($Million)
Table 74 Other Swine Feed Acids & Nutrients Market Size, By Geography, 2012-2019 ($Million)
Table 75 Equine Feed Acids and Nutrients in Animal Nutrition Market Size, By Geography, 2012-2019 ($Million)
Table 76 Equine Feed Acids & Nutrients in Animal Nutrition Market Size, By Type, 2012-2019 ($Million)
Table 77 Equine Feed Amino Acids & Proteins Market Size, By Geography, 2012-2019 ($Million)
Table 78 Equine Feed Organic Acids Market Size, By Geography, 2012-2019 ($Million)
Table 79 Equine Feed Minerals Market Size, By Geography, 2012-2019 ($Million)
Table 80 Equine Feed Vitamins Market Size, By Geography, 2012-2019 ($Million)
Table 81 Equine Feed Fibers & Carbohydrates Market Size, By Geography, 2012-2019 ($Million)
Table 82 Other Equine Feed Acids & Nutrients Market Size, By Geography, 2012-2019 ($Million)
Table 83 Other Livestock Feed Acids & Nutrients Market Size For, By Geography, 2012-2019 ($Million)
Table 84 Other Livestock Feed Acids & Nutrients Market Size, By Type, 2012-2019 ($Million)
Table 85 Other Livestock Feed Amino Acids & Proteins Market Size, By Geography, 2012-2019 ($Million)
Table 86 Other Livestock Feed Organic Acids Market Size, By Geography, 2012-2019 ($Million)
Table 87 Other Livestock Feed Minerals Market Size, By Geography, 2012-2019 ($Million)
Table 88 Other Livestock Feed Vitamins Market Size, By Geography, 2012-2019 ($Million)
Table 89 Other Livestock Feed Fibers & Carbohydrates Market Size, By Geography, 2012-2019 ($Million)
Table 90 Other Livestock Acids & Nutrients Market Size For Other Feed, By Geography, 2012-2019 ($Million)
Table 91 North America: Acids and Nutrients in Animal Nutrition Market Size, By Country, 2012-2019 ($Million)
Table 92 North America: Acids & Nutrients in Animal Nutrition Market Size, By Type, 2012-2019 ($Million)
Table 93 North America: Acids and Nutrients in Animal Nutrition Market Size, By Livestock, 2012-2019 ($Million)
Table 94 Europe: Acids & Nutrients in Animal Nutrition Market Size, By Country, 2012-2019 ($Million)
Table 95 Europe: Acids & Nutrients in Animal Nutrition Market Size, By Type, 2012-2019 ($Million)
Table 96 Europe: Acids and Nutrients in Animal Nutrition Market Size, By Livestock, 2012-2019 ($Million)
Table 97 Asia-Pacific: Acids and Nutrients in Animal Nutrition Market Size, By Country, 2012-2019 ($Million)
Table 98 Asia-Pacific: Acids & Nutrients in Animal Nutrition Market Size, By Type, 2012-2019 ($Million)
Table 99 Asia-Pacific: Acids and Nutrients in Animal Nutrition Market Size, By Livestock, 2012-2019 ($Million)
Table 100 ROW: Acids and Nutrients in Animal Nutrition Market Size, By Country, 2012-2019 ($Million)
Table 101 ROW: Acids and Nutrients in Animal Nutrition Market Size, By Type, 2012-2019 ($Million)
Table 102 ROW: Acids & Nutrients in Animal Nutrition Market Size, By Livestock, 2012-2019 ($Million)
Table 103 Mergers & Acquisitions, 2009-2013
Table 104 Expansions & investments, 2009-2014
Table 105 New Product Launches, 2009-2013
Table 106 Agreements, Joint Ventures & Collaborations, 2010-2014
Table 107 Adisseo France: Products & Their Descriptions
Table 108 ADM: Products & Their Descriptions
Table 109 BASF: Products & Their Applications
Table 110 Cargill: Products & Their Applications
Table 111 Charoen Pokphand Foods: Product Segments & Their Descriptions
Table 112 DSM: Product Categories & Their offerings
Table 113 Evonik: Products & Their Descriptions
Table 114 Nutreco: Products & Their Descriptions
Table 115 Alltech: Products & Their Applications
Table 116 Novus International: Products & Their Applications
List of Figures (24 Figures)
Figure 1 Acids & Nutrients in Animal Nutrition: Market Scope & Segmentation
Figure 2 Acids and Nutrients in Animal Nutrition: Market Research Methodology
Figure 3 Acids & Nutrients in Animal Nutrition Market Size, By Type, 2014 Vs. 2019 ($Million)
Figure 4 Acids and Nutrients in Animal Nutrition Market Segmentation
Figure 5 Acids & Nutrients in Animal Nutrition Market Share (Value), By Geography, 2014 Vs. 2019
Figure 6 Acids and Nutrients in Animal Nutrition Market Size, By Type, 2014 Vs. 2019 ($Million)
Figure 7 Acids & Nutrients in Animal Nutrition Market Share (Value), By Livestock, 2014 Vs. 2019
Figure 8 Market Share Analysis, By Company, 2014
Figure 9 Asia-Pacific: Market Share Analysis, By Company, 2014
Figure 10 North America: Market Share Analysis, By Company, 2014
Figure 11 Europe: Market Share Analysis, By Company, 2014
Figure 12 BASF: SWOT
Figure 13 Adisseo France: SWOT
Figure 14 Royal DSM N.V.: SWOT
Figure 15 Cargill: SWOT
Figure 16 Nutreco: SWOT
Figure 17 Acids & Nutrients in Animal Nutrition Market Drivers & Restraints
Figure 18 Porter�s Five Forces Analysis
Figure 19 Acids and Nutrients in Animal Nutrition Market Supply Chain Analysis
Figure 20 Acids and Nutrients in Animal Nutrition Market Size 2014 Vs. 2019 ($Billion)
Figure 21 Feed Market Size, By Livestock, 2013 (Million Metric Tons)
Figure 22 Acids & Nutrients in Animal Nutrition Market Share (Developments), By Growth Strategy, 2009-2013
Figure 23 Acids and Nutrients in Animal Nutrition Market Developments, By Growth Strategy, 2009-2013
Figure 24 Acids & Nutrients in Animal Nutrition Market Share (Developments), By Company, 2009-2013


Growth opportunities and latent adjacency in Acids & Nutrients in Animal Nutrition Market