The study involved two major segments in estimating the current nutraceutical ingredients market size. Exhaustive secondary research was done to collect information on the market, peer, and parent markets. The next step was to validate these findings, assumptions, and sizing with industry experts across the value chain through primary research. Both top-down and bottom-up approaches were employed to estimate the complete market size. After that, market breakdown and data triangulation were used to estimate the nutraceutical ingredients market size of segments and subsegments.
Secondary Research
This research study involved the extensive use of secondary sources—directories and databases such as Bloomberg Businessweek and Factiva—to identify and collect information useful for a technical, market-oriented, and commercial study of the nutraceutical ingredients market.
In the secondary research process, various sources such as annual reports, press releases & investor presentations of companies, white papers, food journals, certified publications, articles from recognized authors, directories, and databases, were referred to identify and collect information.
Secondary research was mainly used to obtain key information about the industry’s supply chain, the total pool of key nutraceutical ingredients companies, and market classification and segmentation as per the industry trends to the bottom-most level, regional markets, and key developments from both market- and technology-oriented perspectives.
Primary Research
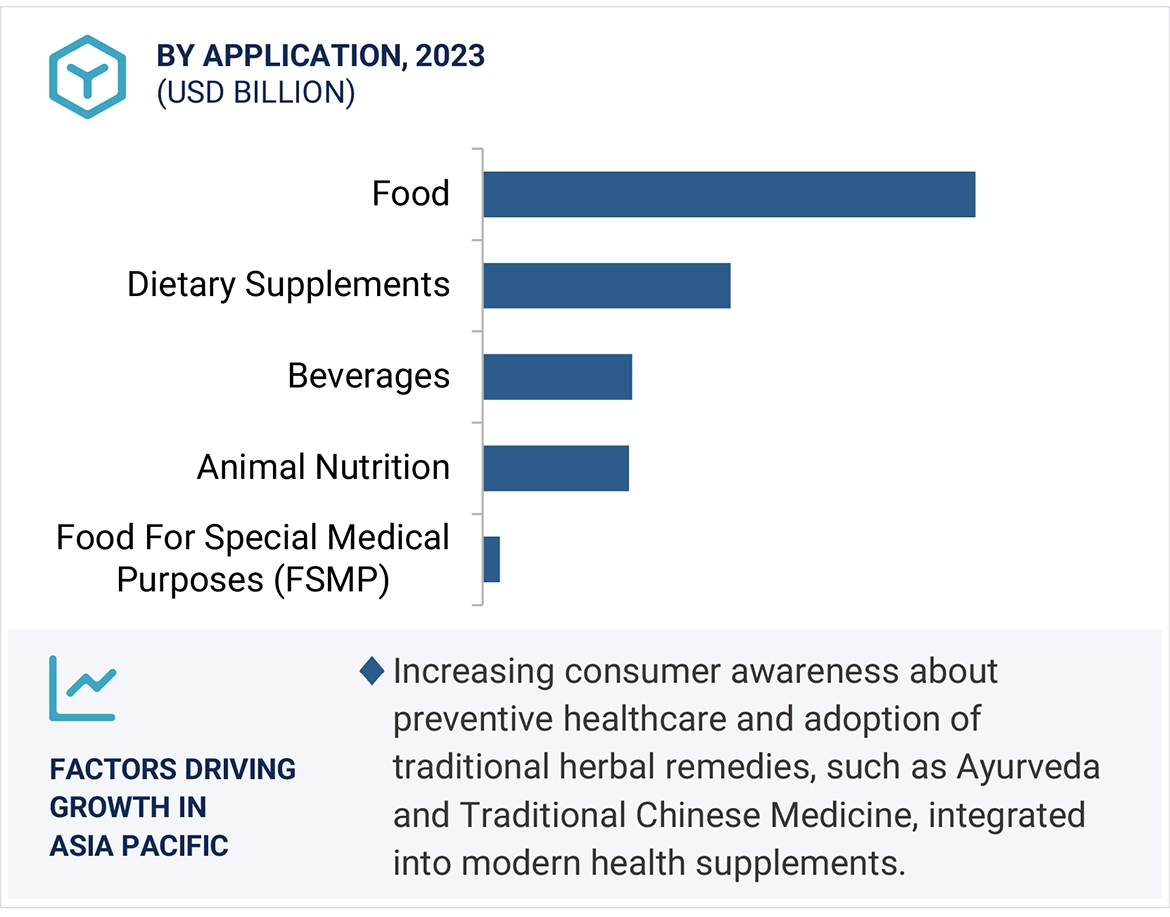
Extensive primary research was conducted after obtaining information regarding the nutraceutical ingredients market scenario through secondary research. Several primary interviews were conducted with market experts from both the demand and supply sides across major countries of North America, Europe, Asia Pacific, South America, and the Rest of the World. Primary data was collected through questionnaires, emails, and telephonic interviews. The primary sources from the supply side included various industry experts, such as Chief X Officers (CXOs), Vice Presidents (VPs), Directors, from business development, marketing, research, and development teams, and related key executives from distributors, and key opinion leaders. Primary interviews were conducted to gather insights such as market statistics, data on revenue collected from the products, market breakdowns, market size estimations, market forecasting, and data triangulation. Primary research also helped in understanding the various trends related to nutraceutical ingredients type, application, form, function, and region. Stakeholders from the demand side, such as food, beverages, dietary supplements, animal nutrition, and food for special purposes (FSMP) manufacturers who use the nutraceutical ingredients products were interviewed to understand the buyer’s perspective on the suppliers, products, and their current usage of nutraceutical ingredients and the outlook of their business which will affect the overall market.

To know about the assumptions considered for the study, download the pdf brochure
|
COMPANY NAME
|
Designation
|
|
ADM (US)
|
Sales Administrator
|
|
Associated British Foods plc (UK)
|
Marketing Manager
|
|
Divi's Laboratories Limited (India)
|
Business Development Manager
|
|
Kemin Industries, Inc. (US)
|
Director (Research and Product Development)
|
|
BASF SE (Germany)
|
Sales & Marketing Director
|
|
Ingredion (US)
|
Customer Service Manager
|
Nutraceutical Ingredients Market Size Estimation
Both top-down and bottom-up approaches have been used to estimate and validate the total nutraceutical ingredients market size. These approaches have also been used extensively to determine the size of the various sub-segments in the market. The research methodology used to estimate the market size includes the following details:
-
The key nutraceutical ingredients companies in the industry and market have been identified through extensive secondary research.
-
The nutraceutical ingredients value chain and market size in terms of value and volume have been determined through primary and secondary research.
-
All percentage shares, splits, and breakdowns were determined using secondary sources and verified through primary sources.
-
All macroeconomic and microeconomic factors affecting the nutraceutical ingredients market growth were considered while estimating the market size.
-
All the possible parameters that affect the market covered in this research study have been accounted for, viewed in extensive detail, verified through primary research, and analyzed to obtain the final quantitative and qualitative data.
Global Nutraceutical Ingredients Market: Bottom-Up Approach.

To know about the assumptions considered for the study, Request for Free Sample Report
Global Nutraceutical Ingredients Market: Top-Down Approach.

Data Triangulation
After arriving at the overall nutraceutical ingredients market size from the estimation process explained above, the total market was split into several segments and subsegments. Data triangulation and market breakdown procedures were employed to estimate the nutraceutical ingredients market and arrive at the exact statistics for all segments and subsegments. The data was triangulated by studying numerous factors and trends from the demand and supply sides. The market size was also validated using both the top-down and bottom-up approaches.
Market Definition
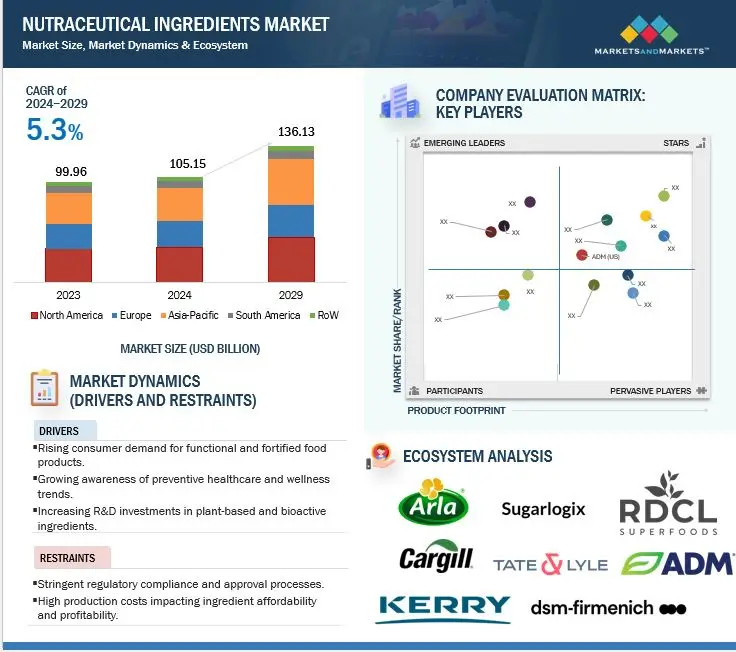
There is no standard definition for nutraceutical ingredients globally, and the definition of ‘nutraceuticals’ differs in accordance with region and their industrial applications. Therefore, for the purpose of this study, nutraceutical ingredients are defined as ingredients derived from animal, plant, microbial, and synthetic sources, which provide health benefits, adding essential nutritional value and functional benefits to various applications such as food, beverages, dietary supplements, food for special medical purposes (FSMP), and animal nutrition products.
According to the FDA, nutraceuticals are ‘pharmaceutical grade’ nutrients consumed for health benefits. They are vitamins, minerals, herbs, extracts, and others.
According to the American Nutraceutical Association, the term “nutraceutical” was derived by condensing the terms “pharmaceutical and nutrition” in 1989 by Stephen DeFelice, who was the founding chairman of the Foundation for Innovation in Medicine. DeFelice suggested “a nutraceutical is any substance that is a food or a part of a food and provides medical or health benefits, including the prevention and treatment of disease. Such products may range from isolated nutrients, dietary supplements, and specific diets to genetically engineered designer foods, herbal products, and processed foods such as cereals, soups, and beverages”.
Key Stakeholders
-
Raw material suppliers
-
Manufacturers & processors of end-products, such as food, beverage, dietary supplements, feed, and food for special medical purposes (FSMP)
-
R&D laboratories
-
Nutraceutical ingredient manufacturers and suppliers
-
Nutraceutical ingredient processors
-
Food ingredient manufacturers & processors
-
Government organizations, research organizations, consulting firms, trade associations, and industry bodies
-
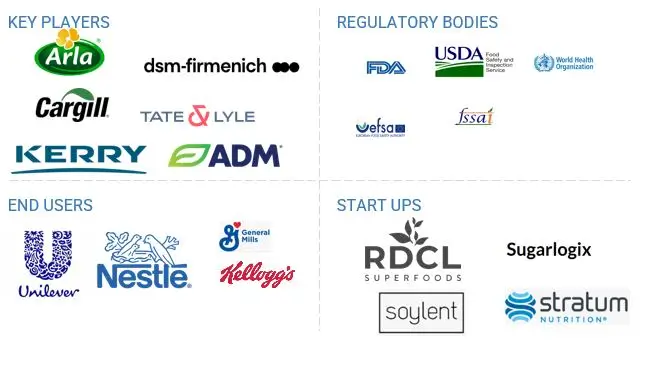
Regulatory bodies
-
Organizations such as the Food and Drug Administration (FDA)
-
United States Department of Agriculture (USDA)
-
European Food Safety Agency (EFSA)
-
European Union (EUROPA)
-
Codex Alimentarius
-
World Health Organization (WHO)
-
OECD-FAO Agricultural Outlook
-
Food Safety Australia and New Zealand (FSANZ)
-
Intermediary suppliers such as traders, distributors, and suppliers of ingredients and end products
Report Objectives
-
Determining and projecting the nutraceutical ingredients market size, with respect to type, application, form, function (qualitative), and region, over five years, ranging from 2024 to 2029
-
Identifying the attractive opportunities in the market by determining the largest and fastest-growing segments across key regions
-
Analyzing the demand-side factors based on the following:
-
Impact of macro- and micro-economic factors on the market
-
Shifts in demand patterns across different subsegments and regions
-
Providing detailed information about the key factors influencing the nutraceutical ingredients market growth (drivers, restraints, opportunities, and industry-specific challenges)
Available Customizations:
With the given market data, MarketsandMarkets offers customizations according to company-specific scientific needs.
The following customization options are available for the report:
Product Analysis
-
Product Matrix, which gives a detailed comparison of the product portfolio of each company.
Geographic Analysis
With the given market data, MarketsandMarkets offers customizations according to company-specific scientific needs.
-
Further breakdown of the Rest of European market for nutraceutical ingredients into Poland, the Netherlands, Belgium, and other EU and non-EU countries.
-
Further breakdown of the Rest of Asia Pacific market for nutraceutical ingredients into South Korea and ASEAN countries such as Vietnam, Indonesia, Malaysia, the Philippines, Thailand, and Singapore.
-
Further breakdown of the Rest of South American market for nutraceutical ingredients into Colombia, Chile, and Peru.
-
Further breakdown of the Rest of the World into the Middle East and Africa.
Company Information
-
Detailed analyses and profiling of additional market players (up to five)


Growth opportunities and latent adjacency in Nutraceutical Ingredients Market