Americas Medium-Voltage Cables Market by Insulation (XLPE, EPR, HEPR), Voltage (Upto 5 kV, 5-15 kV, 15-30 kV, 30-60 kV, 60-100 kV), Application (Underground, Overhead, Submarine), End User (Industrial, Commercial, Renewable) and Region - Forecast to 2027
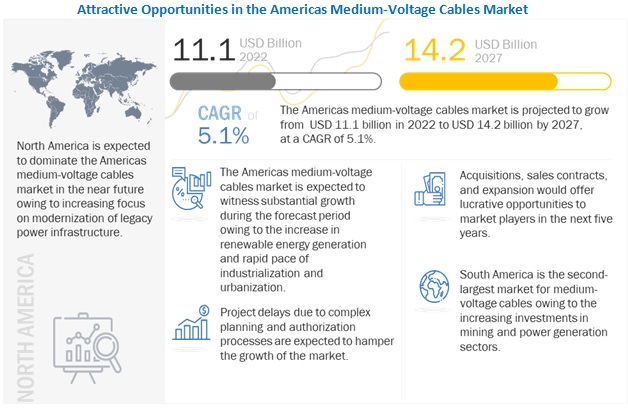
[229 Pages Report] The Americas medium-voltage cables market is projected to reach USD 14.2 billion by 2027 from an estimated market size of USD 11.1 billion in 2022, at a CAGR of 5.1% during the forecast period. The factors driving the growth of Americas Medium-voltage cable are the rapid industrialization and increase in renewable energy generation capacity.
To know about the assumptions considered for the study, Request for Free Sample Report
Impact of Covid-19 on Americas Medium-voltage cables Market
COVID-19 has adversely affected the Medium-voltage cable market in the Americas.
The economic slowdown and high commodity prices fueled by the COVID-19 pandemic are the challenges faced by the Medium-voltage cable market. The companies across all geography also witnessed disruptions in the supply chain and a drop in demand for the medium voltage cables due to delays in energy and infrastructure projects. This resulted in increased procurement costs of raw materials due to the shortage of supplies, which ultimately led to delays in order closures. Thus, the pandemic has negatively impacted the demand for Medium-voltage cables in the short term.
Americas Medium-Voltage Cables Market Dynamics
Driver: Increase in renewable energy generation in major countries, especially US
Medium-Voltage cables are used for interconnecting equipment in large-scale renewable energy projects such as solar, offshore wind, and hydroelectric dams. They also are used for linking these projects to create a private distribution network and connect to wider national power grids. The increase in solar and wind energy generation capacity in the US is due to the continuous steps the country is taking to decarbonize the power sector and tackle the effects of climate change on the environment. Thus, increasing the generation of wind and solar energy in the US is expected to drive the growth of the medium-voltage cables market as these cables would be used to integrate the electricity generated through solar and wind into the grid.
Restraint: Reduced demand for medium-voltage cables due to project delays
Transmission and distribution network expansion projects are typically large-scale endeavors involving large budgetary allocations from government authorities. Such projects routinely get stuck in bureaucratic processes or face funding issues due to budgetary shortfalls. For example, as expected, the COVID-19 pandemic has delayed renewable energy projects across Latin America. Projects being developed in the power sector have faced delays due to the lockdown and movement restrictions imposed to control the spread of the COVID-19 pandemic. Wind projects in the US are also expected to be delayed due to lockdowns and supply chain disruptions.
Opportunities: Increase in power demand in South America
South Americas demand for electricity is about to increase by 2040, which needs to be met by adding new generation capacity. This new capacity, although fossil fuels dominated, is more diversified with more components of renewables and hydro.
The diversified growth in power capacity would need expanded, improved, and enhanced T&D infrastructure. American T&D network investments would occupy almost 40% of the total power investments by 2040. Power cables are an integral part of T&D networks, demanding a large portion of the investments. With the increase in energy demand, the requirement for energy-efficient and high-quality medium-voltage cables will also increase.
Challenges: Availability of low-quality and inexpensive products
The availability of cheap substitutes and duplicates of original brand products is a big challenge for the medium-voltage cables market. These products are generally available at a cheaper rate as compared to the original products and have comparatively inferior quality. The medium-voltage cables market includes both organized and unorganized sectors, where the organized sector provides high-quality products to industrial end-users and the unorganized sector provides cheaper or lower quality products to maintain their presence in the market. Because of this, the leading players are facing challenges from the unorganized sector that provide cheaper quality products, particularly from China-based players. Compared to China, manufacturing in North America is very expensive due to its high labor and benefit costs, and players in the Americas can only compete on service, quality, technical leadership, and higher value-added products
Market Trends
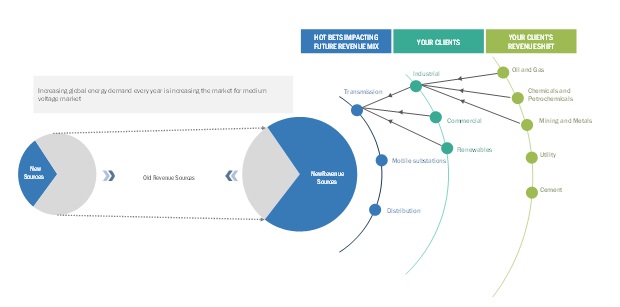
To know about the assumptions considered for the study, download the pdf brochure
Market Interconnection
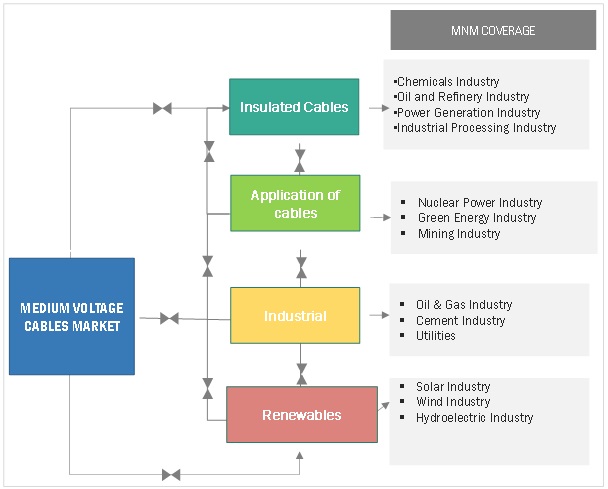
The overhead segment market is expected to be the second-largest segment in the Americas Medium-voltage Cables market, by Type, during the forecast period
The Americas Medium-voltage cable market, by Application type, is segmented into Underground, Overhead, and Submarine. The overhead market is expected to be the second-largest segment in the Americas Medium-voltage market, by Application type, during the forecast period. The installation of overhead cables is relatively less expensive than the submarine and underground cabling systems. Such factors are expected to fuel the growth of the overhead segment of the Americas Medium-voltage market.
By End user, the Renewables segment is expected to be the fastest-growing in the Americas medium-voltage cables market during the forecast period
The Americas Medium-voltage cable market, by End-user, is segmented into Industrial, Commercial, and Renewables. The renewables segment comprises wind and solar. The Americas region is moving to renewables from traditional energy sources in order to reduce carbon emissions and reduce environmental pollution. The rapid influx of investments in renewable power generation is expected to boost the demand for auxiliary components required for the generation, transmission, and distribution of renewable energy, such as energy storage equipment as well as power (medium- and high-voltage) cables.
North America is estimated to be the largest market for Americas Medium-voltage cables market, by region, during the forecast period
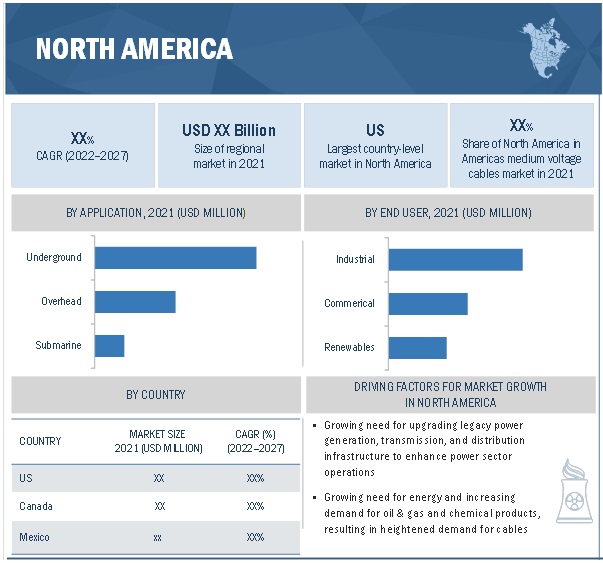
North America is estimated to be the largest market for Americas Medium-voltage market. The region has tremendous energy requirements owing to its large-scale industrial sector and the worlds highest per capita energy consumption. The strong focus of governments in the Americas on achieving the goal of net-zero carbon emissions and the increased participation of private players in the production of renewable energy are likely to boost the growth of the medium-voltage cables market in the US.
Key Market Players
The Americas medium-voltage cables market is served by a mix of large players with operational presence in the Americas and local players commanding a strong supply network in the domestic market. The leading players in the Americas medium-voltage cables market include Prysmian Group (Italy), Southwire Company (US), Nexans (France), NKT (Denmark), and LS Cable & System (South Korea). Between 2017 and 2022, the companies adopted growth strategies such as acquisitions, sales contracts, product launches, agreements, alliances, partnerships, and expansions to capture a larger share of the Americas Medium-voltage cable market.
Scope of the Report
|
Report Metric |
Details |
|
Market size available for years |
20202027 |
|
Base year considered |
2021 |
|
Forecast period |
20222027 |
|
Forecast units |
Value (USD Billion), Volume (Thousand Miles) |
|
Segments covered |
Insulation Type, Voltage, Application, End User, and Region |
|
Geographies covered |
North America, Central America, and South America |
|
Companies covered |
Prysmian Group (Italy), Southwire Company (US), Nexans (France), NKT (Denmark), LS Cable & System (South Korea), TFKable (Poland), Sumitomo Electric Industries (Japan), HELUKABEL Group (Germany), Synergy Cables (Israel), LEONI AG (Germany), TPC Wire & Cable (US), Belden (US), ZTT (China), The Okonite Company (US), Texcan (Canada), Tratos (Italy), Thermal Wire & Cable (US), BizLink Holdings (US), Deca Cables (Canada), Northwire (US), Furukawa Electric (Japan), and Encore Wire Corporation (US). |
This research report categorizes the Americas medium-voltage cables market by insulation type, voltage, application, end user, and region
On the basis of insulation type, the Americas medium-voltage cables market has been segmented as follows:
- Cross-linked Polyethylene (XLPE)
- Ethylene-propylene Rubber (EPR)
- High Modulus Ethylene-propylene (HEPR)
- Others (polyvinyl chloride (PVC), polyethylene (PE), chlorosulfonated polyethylene (CSPE), and ethylene propylene diene monomer (EPDM))
On the basis of voltage, the Americas medium-voltage cables market has been segmented as follows:
- Up to 5 kV
- 515 kV
- 1530 kV
- 3060 kV
- 60100 kV
On the basis of application, the Americas medium-voltage cables market has been segmented as follows:
- Underground
- Overhead
- Submarine
On the basis of by end user, the Americas medium-voltage cables market has been segmented as follows:
- Industrial
- Utilities
- Oil & Gas
- Chemicals & Petrochemicals
- Metals & Mining
- Manufacturing
- Cement
- Others (construction, marine, pulp & paper, transportation, and water & wastewater treatment industries)
- Commercial
- Renewables
- Solar
- Wind
On the basis of region, the Americas medium-voltage cables market has been segmented as follows:
- North America
- South America
- Central America
Recent Developments
- In February 2022, Prysmian Group planned on opening a new submarine power cable plant in Brayton Point site, Massachusetts, US. Prysmian Groups total investment to build the new plant will amount to about USD 200 million.
- In March 2022, Southwire Company acquired Novinium Holdings, a cable rejuvenation solutions provider focused on underground cables for electric utilities. Novinium Holdings service offering is expected to further expand Southwire Companys role as a key resource to its utility partners and bolster its growing service and solutions business.
- In October 2021, LS Cable & System developed a 23 kV 3-phase coaxial superconducting cable with the Korea Electric Power Research Institute at the Gochang Power Testing Center at Korea Electric Power Corporation (KEPCO) and obtained certification from the International Electrotechnical Commission (IEC) standard.
- In March 2021, Nexans signed a preferred supplier agreement (PSA) with Empire Offshore Wind LLC to connect the Empire Wind offshore projects to the onshore grid. The turnkey projects cover the full design and manufacturing, as well as the laying and protection of over 300 km of export cables.
Frequently Asked Questions (FAQ):
What is the current size of the Americas Medium-voltage cables market?
The current market size of Americas medium-voltage cables market is USD 10.5 billion in 2021.
What is the major drivers for the Americas Medium-voltage cables market?
The factors driving the growth of Americas Medium-voltage cable are rapid industrialization and an increase in renewable energy generation capacity.
Which is the fastest-growing region during the forecasted period in Americas Medium-voltage cable market?
South American region is expected to grow at the highest CAGR during the forecast period, driven mainly by activities in Brazil, Argentina, Venezuela, and others.
Which is the fastest-growing segment, by the application during the forecasted period in Americas Medium-voltage cables market?
The underground segment is estimated to have the largest market share and is expected to grow at the highest CAGR during the forecast period. .
To speak to our analyst for a discussion on the above findings, click Speak to Analyst

TABLE OF CONTENTS
1 INTRODUCTION (Page No. - 28)
1.1 STUDY OBJECTIVES
1.2 DEFINITION
1.3 INCLUSIONS AND EXCLUSIONS
1.4 MARKET SCOPE
FIGURE 1 AMERICAS MEDIUM-VOLTAGE CABLES MARKET SEGMENTATION
1.4.1 REGIONAL SCOPE
1.4.2 YEARS CONSIDERED
1.5 UNITS
1.6 CURRENCY
1.7 LIMITATIONS
1.8 STAKEHOLDERS
2 RESEARCH METHODOLOGY (Page No. - 33)
2.1 RESEARCH DATA
FIGURE 2 AMERICAS MEDIUM-VOLTAGE CABLES MARKET: RESEARCH DESIGN
2.2 MARKET BREAKDOWN AND DATA TRIANGULATION
FIGURE 3 DATA TRIANGULATION METHODOLOGY
2.2.1 SECONDARY DATA
2.2.1.1 Key data from secondary sources
2.2.2 PRIMARY DATA
2.2.2.1 Key data from primary sources
2.2.2.2 Breakdown of primaries
2.3 IMPACT OF COVID-19 ON INDUSTRY
2.4 SCOPE
2.5 MARKET SIZE ESTIMATION
2.5.1 BOTTOM-UP APPROACH
FIGURE 4 MARKET SIZE ESTIMATION METHODOLOGY: BOTTOM-UP APPROACH
2.5.2 TOP-DOWN APPROACH
FIGURE 5 MARKET SIZE ESTIMATION METHODOLOGY: TOP-DOWN APPROACH
2.5.3 DEMAND-SIDE ANALYSIS
FIGURE 6 MAIN METRICS CONSIDERED WHILE ANALYZING AND ASSESSING DEMAND FOR MEDIUM-VOLTAGE CABLES IN AMERICAS
2.5.3.1 Assumptions for demand-side analysis
2.5.3.2 Calculation for demand side
2.5.4 SUPPLY-SIDE ANALYSIS
FIGURE 7 KEY STEPS CONSIDERED FOR ASSESSING SUPPLY OF MEDIUM-VOLTAGE CABLES
FIGURE 8 AMERICAS MEDIUM-VOLTAGE CABLES MARKET: SUPPLY-SIDE ANALYSIS
2.5.4.1 Supply-side calculation
2.5.4.2 Assumptions for supply side
FIGURE 9 COMPANY REVENUE ANALYSIS, 2020
2.6 FORECAST
3 EXECUTIVE SUMMARY (Page No. - 45)
TABLE 1 AMERICAS MEDIUM-VOLTAGE CABLES MARKET SNAPSHOT
FIGURE 10 NORTH AMERICA DOMINATED MARKET IN 2021
FIGURE 11 CROSS-LINKED POLYETHYLENE (XLPE) SEGMENT TO HOLD LARGEST SHARE OF MARKET, BY INSULATION TYPE, DURING FORECAST PERIOD
FIGURE 12 515 KV SEGMENT TO ACCOUNT FOR LARGEST SHARE OF MARKET IN 2027
FIGURE 13 UNDERGROUND SEGMENT TO REGISTER HIGHEST GROWTH RATE IN MARKET, BY APPLICATION, DURING FORECAST PERIOD
FIGURE 14 RENEWABLES SEGMENT TO WITNESS HIGHEST GROWTH RATE IN MARKET, BY END USER, DURING FORECAST PERIOD
4 PREMIUM INSIGHTS (Page No. - 49)
4.1 ATTRACTIVE OPPORTUNITIES IN AMERICAS MEDIUM-VOLTAGE CABLES MARKET
FIGURE 15 GROWING DEMAND FOR UNDERGROUND CABLES IN NORTH AMERICA TO DRIVE MARKET FOR MEDIUM-VOLTAGE CABLES, 20222027
4.2 CABLES MARKET, BY REGION
FIGURE 16 SOUTH AMERICA TO GROW AT HIGHEST CAGR IN MARKET DURING FORECAST PERIOD
4.3 NORTH AMERICA MEDIUM-VOLTAGE CABLES MARKET, BY APPLICATION AND COUNTRY
FIGURE 17 INDUSTRIAL SEGMENT AND US DOMINATED NORTH AMERICA MEDIUM-VOLTAGE CABLES MARKET, BY APPLICATION AND COUNTRY, RESPECTIVELY, IN 2021
4.4 MARKET, BY INSULATION TYPE
FIGURE 18 CROSS-LINKED POLYETHYLENE (XLPE) SEGMENT TO ACCOUNT FOR LARGEST MARKET SHARE IN 2027
4.5 MARKET, BY VOLTAGE
FIGURE 19 515 KV SEGMENT TO ACCOUNT FOR LARGEST MARKET SHARE IN 2027
4.6 MARKET, BY APPLICATION
FIGURE 20 OVERHEAD SEGMENT TO ACCOUNT FOR LARGEST SHARE IN 2027
4.7 MARKET, BY END USER
FIGURE 21 INDUSTRIAL SEGMENT TO ACCOUNT FOR LARGEST SHARE IN 2027
5 MARKET OVERVIEW (Page No. - 53)
5.1 INTRODUCTION
5.2 COVID-19 HEALTH ASSESSMENT
FIGURE 22 COVID-19 GLOBAL PROPAGATION
FIGURE 23 COVID-19 PROPAGATION IN SELECTED COUNTRIES
5.3 COVID-19 ECONOMIC ASSESSMENT
FIGURE 24 REVISED GDP FORECASTS FOR SELECT COUNTRIES 20192021
5.4 MARKET DYNAMICS
FIGURE 25 MEDIUM-VOLTAGE MARKET: DRIVERS, RESTRAINTS, OPPORTUNITIES, AND CHALLENGES
5.4.1 DRIVERS
5.4.1.1 Increase in renewable energy generation in major countries, especially in US
FIGURE 26 NEW ELECTRICITY GENERATING CAPACITY ADDITIONS IN US, 20192021
5.4.1.2 Rapid pace of industrialization and urbanization across Americas
FIGURE 27 NORTH AMERICA URBANIZATION PROSPECTS
5.4.1.3 Increased usage of mobile substations during natural disasters and power outages
5.4.1.4 Increased installation of underground cables in Americas
5.4.2 RESTRAINTS
5.4.2.1 Reduced demand for medium-voltage cables due to project delays
5.4.2.2 Funding constraints in South and Central America
5.4.3 OPPORTUNITIES
5.4.3.1 Favorable renewable energy policies in key countries
5.4.3.2 Increase in power demand in South America
FIGURE 28 ELECTRICITY DEMAND IN AMERICAS, 20202050 (QUADRILLION BRITISH THERMAL UNITS)
5.4.3.3 Implementation of smart grid technology
FIGURE 29 INVESTMENT IN SMART ELECTRICITY NETWORKS IN US, 20172021
5.4.4 CHALLENGES
5.4.4.1 Availability of low-quality and inexpensive products
5.4.4.2 Technical expertise needed for medium-voltage cable systems
5.5 TRENDS/DISRUPTIONS IMPACTING CUSTOMERS BUSINESSES
5.5.1 REVENUE SHIFT AND NEW REVENUE POCKETS
FIGURE 30 REVENUE SHIFT FOR MEDIUM-VOLTAGE CABLES SALES
5.6 ECOSYSTEM
FIGURE 31 MEDIUM-VOLTAGE CABLES MARKET: ECOSYSTEM
TABLE 2 MEDIUM-VOLTAGE CABLES MARKET: ROLE IN ECOSYSTEM
5.7 VALUE CHAIN ANALYSIS
FIGURE 32 VALUE CHAIN ANALYSIS: MEDIUM-VOLTAGE CABLES MARKET
5.7.1 RAW MATERIAL PROCUREMENT
5.7.2 CABLE MANUFACTURING
5.7.3 DISTRIBUTION AND SALES
5.7.4 INSTALLATION
5.7.5 POST-SALES SERVICES
5.8 MARKET MAP
FIGURE 33 MARKET MAP: MEDIUM-VOLTAGE CABLES MARKET
5.9 AVERAGE SELLING PRICE TREND
FIGURE 34 AVERAGE SELLING PRICE OF MEDIUM-VOLTAGE CABLES IN AMERICAS, 2021
5.10 TECHNOLOGY ANALYSIS
5.10.1 INSULATION
5.10.2 CABLE JOINTS
5.11 TRADE DATA
TABLE 3 IMPORT DATA FOR MEDIUM-VOLTAGE CABLES IN NORTH AMERICA, 20192021 (USD MILLION)
TABLE 4 EXPORT DATA FOR MEDIUM-VOLTAGE CABLES IN NORTH AMERICA, 20192021 (USD MILLION)
5.12 TARIFFS, CODES, AND REGULATIONS
TABLE 5 REGULATIONS AND STANDARD CODES FOR MEDIUM-VOLTAGE CABLES
5.12.1 REGULATORY BODIES, GOVERNMENT AGENCIES, AND OTHER ORGANIZATIONS
TABLE 6 NORTH AMERICA: LIST OF REGULATORY BODIES, GOVERNMENT AGENCIES, AND OTHER ORGANIZATIONS
5.12.2 CODES AND REGULATIONS RELATED TO MEDIUM-VOLTAGE CABLES
TABLE 7 MEDIUM-VOLTAGE CABLES MARKET: CODES AND REGULATIONS
5.13 PORTERS FIVE FORCES ANALYSIS
FIGURE 35 MEDIUM-VOLTAGE CABLES MARKET: PORTERS FIVE FORCES ANALYSIS
TABLE 8 MEDIUM-VOLTAGE CABLES MARKET: PORTERS FIVE FORCES ANALYSIS
5.13.1 THREAT OF NEW ENTRANTS
5.13.2 BARGAINING POWER OF SUPPLIERS
5.13.3 BARGAINING POWER OF BUYERS
5.13.4 THREAT OF SUBSTITUTES
5.13.5 INTENSITY OF COMPETITIVE RIVALRY
5.14 KEY STAKEHOLDERS & BUYING CRITERIA
5.14.1 KEY STAKEHOLDERS IN BUYING PROCESS
FIGURE 36 INFLUENCE OF STAKEHOLDERS IN BUYING PROCESS, BY END USER
TABLE 9 INFLUENCE OF STAKEHOLDERS IN BUYING PROCESS, BY END USER
5.14.2 BUYING CRITERIA
FIGURE 37 KEY BUYING CRITERIA FOR END USERS
TABLE 10 KEY BUYING CRITERIA FOR END USERS, BY POWER RATING
5.15 INNOVATIONS AND PATENT REGISTRATIONS
TABLE 11 MEDIUM-VOLTAGE CABLES: INNOVATIONS AND PATENT REGISTRATIONS, 20172021
5.16 CASE STUDY ANALYSIS
5.16.1 ENERGY LOSSES REDUCTION IN MEDIUM-VOLTAGE CABLES (2021)
5.16.2 IMPLEMENTATION OF CROSS-BONDING TO UNDERGROUND LONG MEDIUM-VOLTAGE CABLES IN WIND PARKS (2020)
5.16.3 IMPROVING PRODUCTIVITY AND QUALITY OF MEDIUM-VOLTAGE CABLE PRODUCTION (2020)
5.17 KEY CONFERENCES & EVENTS IN 20222023
TABLE 12 MEDIUM-VOLTAGE CABLES MARKET: DETAILED LIST OF CONFERENCES & EVENTS
6 AMERICAS MEDIUM-VOLTAGE CABLES MARKET, BY INSULATION TYPE (Page No. - 77)
6.1 INTRODUCTION
FIGURE 38 CROSS-LINKED POLYETHYLENE CABLES ACCOUNTED FOR LARGEST SHARE OF MARKET, BY INSULATION TYPE, IN 2021
TABLE 13 MARKET, BY INSULATION TYPE, 20202027 (USD MILLION)
TABLE 14 MARKET, BY INSULATION TYPE, 20202027 (THOUSAND MILES)
6.2 CROSS-LINKED POLYETHYLENE (XLPE)
6.2.1 EXTREME RESISTANCE TO ABRASION AND HIGH TEMPERATURES DRIVES THE XLPE CABLES MARKET
TABLE 15 CROSS-LINKED POLYETHYLENE (XLPE): MARKET, BY REGION, 20202027 (USD MILLION)
6.3 ETHYLENE-PROPYLENE RUBBER (EPR)
6.3.1 EXCELLENT THERMAL PROPERTIES AND FLEXIBILITY DRIVE EPR MARKET
TABLE 16 ETHYLENE-PROPYLENE RUBBER (EPR): MARKET, BY REGION, 20202027 (USD MILLION)
6.4 HIGH MODULUS ETHYLENE-PROPYLENE (HEPR)
6.4.1 RESISTANCE TO CHEMICAL ATTACKS AND MOISTURE AND OIL ARE DRIVING HEPR DEMAND
TABLE 17 HIGH MODULUS ETHYLENE-PROPYLENE: MARKET, BY REGION, 20202027 (USD MILLION)
6.5 OTHERS
TABLE 18 OTHERS: MARKET, BY REGION, 20202027 (USD MILLION)
7 AMERICAS MEDIUM-VOLTAGE CABLES MARKET, BY VOLTAGE (Page No. - 83)
7.1 INTRODUCTION
FIGURE 39 515 KV CABLES ACCOUNTED FOR LARGEST SIZE OF MARKET, BY VOLTAGE, IN 2021
TABLE 19 MARKET, BY VOLTAGE, 20202027 (USD MILLION)
7.2 UP TO 5 KV
7.2.1 GROWTH IN POWER SECTOR DRIVING MARKET FOR UP TO 5 KV CABLES
TABLE 20 UP TO 5 KV: MARKET, BY REGION, 20202027 (USD MILLION)
7.3 515 KV
7.3.1 INCREASE IN RENEWABLE ENERGY PROJECTS IS DRIVING DEMAND FOR 515 KV CABLES
TABLE 21 515 KV: MARKET, BY REGION, 20202027 (USD MILLION)
7.4 1530 KV
7.4.1 NEED FOR FAST CHARGING TO FUEL DEMAND FOR 1530 KV CABLES
TABLE 22 1530 KV: MARKET, BY REGION, 20202027 (USD MILLION)
7.5 3060 KV
7.5.1 INCREASE IN SINGLE- AND MULTI-CORE CABLES DEMAND IS DRIVING 3060 KV SEGMENT
TABLE 23 3060 KV: MARKET, BY REGION, 20202027 (USD MILLION)
7.6 60100 KV
7.6.1 UPGRADE OF T&D NETWORKS DRIVING MARKET FOR 60100 KV CABLES
TABLE 24 60100 KV: MARKET, BY REGION, 20202027 (USD MILLION)
8 AMERICAS MEDIUM-VOLTAGE CABLES MARKET, BY APPLICATION (Page No. - 89)
8.1 INTRODUCTION
FIGURE 40 MARKET, BY APPLICATION, 2021
TABLE 25 MARKET, BY APPLICATION, 20202027 (USD MILLION)
8.2 UNDERGROUND
8.2.1 UNDERGROUND MEDIUM-VOLTAGE CABLES ARE LESS SUSCEPTIBLE TO IMPACTS OF SEVERE WEATHER
TABLE 26 UNDERGROUND: MARKET, BY REGION, 20202027 (USD MILLION)
8.3 OVERHEAD
8.3.1 LOW INSTALLATION AND LIFE-CYCLE COSTS TO ACCELERATE DEMAND FOR OVERHEAD MEDIUM-VOLTAGE CABLES
TABLE 27 OVERHEAD: MARKET, BY REGION, 20202027 (USD MILLION)
8.4 SUBMARINE
8.4.1 INCREASING DEMAND FROM OFFSHORE OIL & GAS PLATFORMS AND WIND FARMS SUPPORTS MARKET GROWTH
TABLE 28 SUBMARINE: MARKET, BY REGION, 20202027 (USD MILLION)
9 AMERICAS MEDIUM-VOLTAGE CABLES MARKET, BY END USER (Page No. - 94)
9.1 INTRODUCTION
FIGURE 41 AMERICAS MEDIUM-VOLTAGE CABLES MARKET, BY END USER, 2021
TABLE 29 MARKET, BY END USER, 20202027 (USD MILLION)
9.2 INDUSTRIAL
FIGURE 42 MARKET, BY INDUSTRIAL END USER, 2021
TABLE 30 MARKET, BY INDUSTRIAL END USER, 20202027 (USD MILLION)
TABLE 31 INDUSTRIAL: MARKET, BY REGION, 20202027 (USD MILLION)
9.2.1 UTILITIES
9.2.1.1 Growing investments in retrofit and modernization of grid infrastructure to drive market growth
TABLE 32 UTILITIES: MARKET, BY REGION, 20202027 (USD MILLION)
9.2.2 OIL & GAS
9.2.2.1 Increasing upstream oil & gas investment and refinery capacity expansion to boost market growth
TABLE 33 OIL & GAS: MARKET, BY REGION, 20202027 (USD MILLION)
9.2.3 CHEMICALS & PETROCHEMICALS
9.2.3.1 Strong demand for commodity and specialty chemicals to support market growth
TABLE 34 CHEMICALS & PETROCHEMICALS: MARKET, BY REGION, 20202027 (USD MILLION)
9.2.4 METALS & MINING
9.2.4.1 Rise in mineral and metal ore consumption to reflect favorably on demand for medium-voltage cables
TABLE 35 METALS & MINING: MARKET, BY REGION, 20202027 (USD MILLION)
9.2.5 MANUFACTURING
9.2.5.1 Significant investment in manufacturing projects to accelerate market growth
TABLE 36 MANUFACTURING: MARKET, BY REGION, 20202027 (USD MILLION)
9.2.6 CEMENT
9.2.6.1 Government initiatives to improve infrastructure in South and Central America to drive market growth
TABLE 37 CEMENT: MARKET, BY REGION, 20202027 (USD MILLION)
9.2.7 OTHERS
TABLE 38 OTHERS: MARKET, BY REGION, 20202027 (USD MILLION)
9.3 RENEWABLES
FIGURE 43 MARKET, BY RENEWABLE END USER, 2021
TABLE 39 MARKET, BY RENEWABLE END USER, 20202027 (USD MILLION)
TABLE 40 RENEWABLES: MARKET, BY REGION, 20202027 (USD MILLION)
9.3.1 SOLAR
9.3.1.1 Increasing investments in new solar capacity additions to drive market growth
TABLE 41 SOLAR: MARKET, BY REGION, 20202027 (USD MILLION)
9.3.2 WIND
9.3.2.1 Large-scale investments and favorable government initiatives pertaining to wind energy to drive market growth
TABLE 42 WIND: MARKET, BY REGION, 20202027 (USD MILLION)
9.4 COMMERCIAL
9.4.1 INCREASING PUBLIC INFRASTRUCTURE INVESTMENTS TO BOOST MARKET GROWTH
TABLE 43 COMMERCIAL: MARKET, BY REGION, 20202027 (USD MILLION)
10 REGIONAL ANALYSIS (Page No. - 107)
10.1 INTRODUCTION
FIGURE 44 SOUTH AMERICA TO REGISTER HIGHEST CAGR IN AMERICAS MEDIUM-VOLTAGE CABLES MARKET DURING FORECAST PERIOD
FIGURE 45 REGION-WISE SHARE ANALYSIS OF MARKET, 2021
TABLE 44 MARKET, BY REGION, 20202027 (USD MILLION)
TABLE 45 MARKET, BY REGION, 20202027 (THOUSAND MILES)
10.2 NORTH AMERICA
FIGURE 46 NORTH AMERICA: MARKET SNAPSHOT
10.2.1 BY INSULATION TYPE
TABLE 46 NORTH AMERICA: MARKET, BY INSULATION TYPE, 20202027 (USD MILLION)
10.2.2 BY VOLTAGE
TABLE 47 NORTH AMERICA: MARKET, BY VOLTAGE, 20202027 (USD MILLION)
10.2.3 BY APPLICATION
TABLE 48 NORTH AMERICA: MARKET, BY APPLICATION, 20202027 (USD MILLION)
10.2.4 BY END USER
TABLE 49 NORTH AMERICA: MARKET, BY END USER, 20202027 (USD MILLION)
TABLE 50 NORTH AMERICA: MARKET, BY INDUSTRIAL END USER, 20202027 (USD MILLION)
TABLE 51 NORTH AMERICA: MARKET, BY RENEWABLES END USER, 20202027 (USD MILLION)
10.2.5 BY COUNTRY
TABLE 52 NORTH AMERICA: MARKET, BY COUNTRY, 20202027 (USD MILLION)
10.2.5.1 US
10.2.5.1.1 Initiatives to upgrade legacy power infrastructure to augment demand for medium-voltage cables
TABLE 53 US: NORTH AMERICA MEDIUM-VOLTAGE CABLES MARKET, BY END USER, 20202027 (USD MILLION)
TABLE 54 US: NORTH AMERICA MEDIUM-VOLTAGE CABLES MARKET, BY INDUSTRIAL END USER, 20202027 (USD MILLION)
TABLE 55 US: NORTH AMERICA MEDIUM-VOLTAGE CABLES MARKET, BY RENEWABLES END USER, 20202027 (USD MILLION)
10.2.5.2 Canada
10.2.5.2.1 Rising investments in mining, petrochemicals, and power generation industries to fuel market growth
TABLE 56 CANADA: NORTH AMERICA MEDIUM-VOLTAGE CABLES MARKET, BY END USER, 20202027 (USD MILLION)
TABLE 57 CANADA: NORTH AMERICA MEDIUM-VOLTAGE CABLES MARKET, BY INDUSTRIAL END USER, 20202027 (USD MILLION)
TABLE 58 CANADA: NORTH AMERICA MEDIUM-VOLTAGE CABLES MARKET, BY RENEWABLES END USER, 20202027 (USD MILLION)
10.2.5.3 Mexico
10.2.5.3.1 Increasing investment in electricity networks to boost demand for medium-voltage cables
TABLE 59 MEXICO: NORTH AMERICA MEDIUM-VOLTAGE CABLES MARKET, BY END USER, 20202027 (USD MILLION)
TABLE 60 MEXICO: NORTH AMERICA MEDIUM-VOLTAGE CABLES MARKET, BY INDUSTRIAL END USER, 20202027 (USD MILLION)
TABLE 61 MEXICO: NORTH AMERICA MEDIUM-VOLTAGE CABLES MARKET, BY RENEWABLES END USER, 20202027 (USD MILLION)
10.3 SOUTH AMERICA
FIGURE 47 SOUTH AMERICA: MARKET SNAPSHOT
10.3.1 BY INSULATION TYPE
TABLE 62 SOUTH AMERICA: MARKET, BY INSULATION TYPE, 20202027 (USD MILLION)
10.3.2 BY VOLTAGE
TABLE 63 SOUTH AMERICA: MARKET, BY VOLTAGE, 20202027 (USD MILLION)
10.3.3 BY APPLICATION
TABLE 64 SOUTH AMERICA: MARKET, BY APPLICATION, 20202027 (USD MILLION)
10.3.4 BY END USER
TABLE 65 SOUTH AMERICA: MARKET, BY END USER, 20202027 (USD MILLION)
TABLE 66 SOUTH AMERICA: MARKET, BY INDUSTRIAL END USER, 20202027 (USD MILLION)
TABLE 67 SOUTH AMERICA: MARKET, BY RENEWABLES END USER, 20202027 (USD MILLION)
10.3.5 BY COUNTRY
TABLE 68 SOUTH AMERICA: MARKET, BY COUNTRY, 20202027 (USD MILLION)
10.3.5.1 Brazil
10.3.5.1.1 Exponential increase in distribution and generation of renewable energy is driving medium-voltage cables market
TABLE 69 BRAZIL: SOUTH AMERICA MEDIUM-VOLTAGE CABLES MARKET, BY END USER, 20202027 (USD MILLION)
TABLE 70 BRAZIL: SOUTH AMERICA MEDIUM-VOLTAGE CABLES MARKET, BY INDUSTRIAL END USER, 20202027 (USD MILLION)
TABLE 71 BRAZIL: SOUTH AMERICA MEDIUM-VOLTAGE CABLES MARKET, BY RENEWABLES END USER, 20202027 (USD MILLION)
10.3.5.2 Argentina
10.3.5.2.1 Increased metals and mining activities driving market growth
TABLE 72 ARGENTINA: SOUTH AMERICA MEDIUM-VOLTAGE CABLES MARKET, BY END USER, 20202027 (USD MILLION)
TABLE 73 ARGENTINA: SOUTH AMERICA MEDIUM-VOLTAGE CABLES MARKET, BY INDUSTRIAL END USER, 20202027 (USD MILLION)
TABLE 74 ARGENTINA: SOUTH AMERICA MEDIUM-VOLTAGE CABLES MARKET, BY RENEWABLES END USER, 20202027 (USD MILLION)
10.3.5.3 Venezuela
10.3.5.3.1 Initiation of oil and gas projects driving medium-voltage cables market
TABLE 75 VENEZUELA: SOUTH AMERICA MEDIUM-VOLTAGE CABLES MARKET, BY END USER, 20202027 (USD MILLION)
TABLE 76 VENEZUELA: SOUTH AMERICA MEDIUM-VOLTAGE CABLES MARKET, BY INDUSTRIAL END USER, 20202027 (USD MILLION)
TABLE 77 VENEZUELA: SOUTH AMERICA MEDIUM-VOLTAGE CABLES MARKET, BY RENEWABLES END USER, 20202027 (USD MILLION)
10.3.5.4 Rest of South America
TABLE 78 REST OF SOUTH AMERICA: SOUTH AMERICA MEDIUM-VOLTAGE CABLES MARKET, BY END USER, 20202027 (USD MILLION)
TABLE 79 REST OF SOUTH AMERICA: SOUTH AMERICA MEDIUM-VOLTAGE CABLES MARKET, BY INDUSTRIAL END USER, 20202027 (USD MILLION)
TABLE 80 REST OF SOUTH AMERICA: SOUTH AMERICA MEDIUM-VOLTAGE CABLES MARKET, BY RENEWABLES END USER, 20202027 (USD MILLION)
10.4 CENTRAL AMERICA
10.4.1 BY INSULATION TYPE
TABLE 81 CENTRAL AMERICA: MARKET, BY INSULATION TYPE, 20202027 (USD MILLION)
10.4.2 BY VOLTAGE
TABLE 82 CENTRAL AMERICA: MARKET, BY VOLTAGE, 20202027 (USD MILLION)
10.4.3 BY APPLICATION
TABLE 83 CENTRAL AMERICA: MARKET, BY APPLICATION, 20202027 (USD MILLION)
10.4.4 BY END USER
TABLE 84 CENTRAL AMERICA: MARKET, BY END USER, 20202027 (USD MILLION)
TABLE 85 CENTRAL AMERICA: MARKET, BY INDUSTRIAL END USER, 20202027 (USD MILLION)
TABLE 86 CENTRAL AMERICA: MARKET, BY RENEWABLES END USER, 20202027 (USD MILLION)
10.4.5 BY COUNTRY
TABLE 87 CENTRAL AMERICA: MARKET, BY COUNTRY, 20202027 (USD MILLION)
10.4.5.1 Guatemala
10.4.5.1.1 Investments in renewable energy and focus on manufacturing are driving medium-voltage cables market
TABLE 88 GUATEMALA: CENTRAL AMERICA MEDIUM-VOLTAGE CABLES MARKET, BY END USER, 20202027 (USD MILLION)
TABLE 89 GUATEMALA: CENTRAL AMERICA MEDIUM-VOLTAGE CABLES MARKET, BY INDUSTRIAL END USER, 20202027 (USD MILLION)
TABLE 90 GUATEMALA: CENTRAL MARKET, BY RENEWABLES END USER, 20202027 (USD MILLION)
10.4.5.2 Panama
10.4.5.2.1 Extensive mining activities driving demand for medium-voltage cables
TABLE 91 PANAMA: CENTRAL AMERICA MEDIUM-VOLTAGE CABLES MARKET, BY END USER, 20202027 (USD MILLION)
TABLE 92 PANAMA: CENTRAL AMERICA MEDIUM-VOLTAGE CABLES MARKET, BY INDUSTRIAL END USER, 20202027 (USD MILLION)
TABLE 93 PANAMA: CENTRAL MARKET, BY RENEWABLES END USER, 20202027 (USD MILLION)
10.4.5.3 Costa Rica
10.4.5.3.1 Renewable Energy reach towards power and transport sector and increased manufacturing capacity is driving the medium-voltage cables market
TABLE 94 COSTA RICA: CENTRAL AMERICA MEDIUM-VOLTAGE CABLES MARKET, BY END USER, 20202027 (USD MILLION)
TABLE 95 COSTA RICA: CENTRAL AMERICA MEDIUM-VOLTAGE CABLES MARKET, BY INDUSTRIAL END USER, 20202027 (USD MILLION)
TABLE 96 COSTA RICA: CENTRAL AMERICA MEDIUM-VOLTAGE CABLES MARKET, BY RENEWABLES END USER, 20202027 (USD MILLION)
11 COMPETITIVE LANDSCAPE (Page No. - 137)
11.1 KEY PLAYERS STRATEGIES
TABLE 97 OVERVIEW OF KEY STRATEGIES ADOPTED BY TOP PLAYERS, MARCH 2021 MARCH 2022
11.2 MARKET SHARE ANALYSIS OF TOP FIVE PLAYERS
TABLE 98 MARKET: DEGREE OF COMPETITION
FIGURE 48 MARKET: MARKET SHARE ANALYSIS, 2020
11.3 REVENUE ANALYSIS OF TOP MARKET PLAYERS
FIGURE 49 REVENUE OF TOP PLAYERS IN MARKET FROM 2017 TO 2021
11.4 COMPANY EVALUATION QUADRANT
11.4.1 STAR
11.4.2 PERVASIVE
11.4.3 EMERGING LEADER
11.4.4 PARTICIPANT
FIGURE 50 COMPETITIVE LEADERSHIP MAPPING: MARKET, 2021
11.5 STARTUP/SME EVALUATION QUADRANT
11.5.1 PROGRESSIVE COMPANY
11.5.2 RESPONSIVE COMPANY
11.5.3 DYNAMIC COMPANY
11.5.4 STARTING BLOCK
FIGURE 51 MARKET: START-UP/SME EVALUATION QUADRANT, 2021
11.6 MARKET: COMPETITIVE BENCHMARKING
TABLE 99 MARKET: DETAILED LIST OF KEY SMES/STARTUPS
TABLE 100 MARKET: COMPETITIVE BENCHMARKING OF KEY SMES SMES/STARTUPS
11.7 MARKET: COMPANY FOOTPRINT
TABLE 101 BY INSULATION TYPE: COMPANY FOOTPRINT
TABLE 102 BY VOLTAGE: COMPANY FOOTPRINT
TABLE 103 BY END USER: COMPANY FOOTPRINT
TABLE 104 BY REGION: COMPANY FOOTPRINT
TABLE 105 COMPANY FOOTPRINT
11.8 COMPETITIVE SCENARIO
TABLE 106 MARKET: PRODUCT LAUNCHES, OCTOBER 2021
TABLE 107 MARKET: DEALS, JANUARY 2022 APRIL 2022
TABLE 108 MARKET: OTHERS, MAY 2021 APRIL 2022
12 COMPANY PROFILES (Page No. - 154)
(Business Overview, Products Offered, Recent Developments, MnM View Right to win, Strategic choices made, Weaknesses and competitive threats) *
12.1 KEY PLAYERS
12.1.1 PRYSMIAN GROUP
TABLE 109 PRYSMIAN GROUP: BUSINESS OVERVIEW
FIGURE 52 PRYSMIAN GROUP: COMPANY SNAPSHOT, 2021
TABLE 110 PRYSMIAN GROUP: PRODUCTS OFFERED
TABLE 111 PRYSMIAN GROUP: DEALS
TABLE 112 PRYSMIAN GROUP: OTHERS
12.1.2 SOUTHWIRE COMPANY
TABLE 113 SOUTHWIRE COMPANY: BUSINESS OVERVIEW
FIGURE 53 SOUTHWIRE COMPANY: COMPANY SNAPSHOT, 2020
TABLE 114 SOUTHWIRE COMPANY: PRODUCTS OFFERED
TABLE 115 SOUTHWIRE COMPANY: DEALS
TABLE 116 SOUTHWIRE COMPANY: OTHERS
12.1.3 NEXANS
TABLE 117 NEXANS: BUSINESS OVERVIEW
FIGURE 54 NEXANS: COMPANY SNAPSHOT, 2021
TABLE 118 NEXANS: PRODUCTS OFFERED
TABLE 119 NEXANS: DEALS
TABLE 120 NEXANS: OTHERS
12.1.4 LS CABLE & SYSTEM
TABLE 121 LS CABLE & SYSTEM: BUSINESS OVERVIEW
FIGURE 55 LS CABLE & SYSTEM: COMPANY SNAPSHOT, 2020
TABLE 122 LS CABLE & SYSTEM: PRODUCTS OFFERED
TABLE 123 LS CABLE & SYSTEM: PRODUCT LAUNCHES
TABLE 124 LS CABLE & SYSTEM: DEALS
12.1.5 NKT
TABLE 125 NKT: BUSINESS OVERVIEW
FIGURE 56 NKT: COMPANY SNAPSHOT, 2021
TABLE 126 NKT: PRODUCTS OFFERED
TABLE 127 NKT: DEALS
TABLE 128 NKT: OTHERS
12.1.6 TPC WIRE & CABLE
TABLE 129 TPC WIRE & CABLE: BUSINESS OVERVIEW
TABLE 130 TPC WIRE & CABLE: PRODUCTS OFFERED
TABLE 131 TPC WIRE & CABLE: DEALS
12.1.7 BELDEN
TABLE 132 BELDEN: BUSINESS OVERVIEW
FIGURE 57 BELDEN: COMPANY SNAPSHOT, 2021
TABLE 133 BELDEN: PRODUCTS OFFERED
TABLE 134 BELDEN: DEALS
12.1.8 LEONI AG
TABLE 135 LEONI AG: BUSINESS OVERVIEW
FIGURE 58 LEONI AG: COMPANY SNAPSHOT, 2021
TABLE 136 LEONI AG: PRODUCTS OFFERED
TABLE 137 LEONI AG: DEALS
12.1.9 BIZLINK HOLDING
TABLE 138 BIZLINK HOLDING: BUSINESS OVERVIEW
FIGURE 59 BIZLINK HOLDING: COMPANY SNAPSHOT, 2020
TABLE 139 BIZLINK HOLDING: PRODUCTS OFFERED
TABLE 140 BIZLINK HOLDING: DEALS
12.1.10 SUMITOMO ELECTRIC INDUSTRIES, LTD.
TABLE 141 SUMITOMO ELECTRIC INDUSTRIES, LTD.: BUSINESS OVERVIEW
FIGURE 61 SUMITOMO ELECTRIC INDUSTRIES, LTD.: COMPANY SNAPSHOT, 2020
TABLE 142 SUMITOMO ELECTRIC INDUSTRIES, LTD.: PRODUCTS OFFERED
TABLE 143 SUMITOMO ELECTRIC INDUSTRIES, LTD.: OTHERS
12.1.11 THE OKONITE COMPANY
TABLE 144 THE OKONITE COMPANY: BUSINESS OVERVIEW
TABLE 145 THE OKONITE COMPANY: PRODUCTS OFFERED
12.1.12 TFKABLE
TABLE 146 TFKABLE: BUSINESS OVERVIEW
TABLE 147 TFKABLE: PRODUCTS OFFERED
12.1.13 TRATOS
TABLE 148 TRATOS: BUSINESS OVERVIEW
TABLE 149 TRATOS: PRODUCTS/SERVICES OFFERED
12.1.14 ZTT
TABLE 150 ZTT: BUSINESS OVERVIEW
FIGURE 61 ZTT: COMPANY SNAPSHOT, 2020
TABLE 151 ZTT: PRODUCTS OFFERED
12.1.15 HELUKABEL GROUP
TABLE 152 HELUKABEL GROUP: BUSINESS OVERVIEW
TABLE 153 HELUKABEL GROUP: PRODUCTS OFFERED
12.2 OTHER PLAYERS
12.2.1 THERMAL WIRE & CABLE
12.2.2 DECA CABLES
12.2.3 NORTHWIRE
12.2.4 SYNERGY CABLES
12.2.5 FURUKAWA ELECTRIC
*Details on Business Overview, Products Offered, Recent Developments, MnM View, Right to win, Strategic choices made, Weaknesses and competitive threats might not be captured in case of unlisted companies.
13 APPENDIX (Page No. - 219)
13.1 INSIGHTS OF INDUSTRY EXPERTS
13.2 DISCUSSION GUIDE
13.3 KNOWLEDGE STORE: MARKETSANDMARKETS SUBSCRIPTION PORTAL
13.4 AVAILABLE CUSTOMIZATIONS
13.5 RELATED REPORTS
13.6 AUTHOR DETAILS
The study involved major activities in estimating the current size of the Americas medium-voltage cables market. Exhaustive secondary research was done to collect information on the peer and parent markets. The next step was to validate these findings, assumptions, and sizing with industry experts across the value chain through primary research. Both top-down and bottom-up approaches were employed to estimate the complete market size. Thereafter, market breakdown and data triangulation were used to estimate the market size of the segments and subsegments.
Secondary Research
The research study on the Americas medium-voltage cables market involved the extensive use of secondary sources, directories, and databases, such as Hoovers, World Bank, Observatory of Economic Complexity (OEC), International Energy Agency, Ceicdata, Researchgate, Onepetro, International Electrotechnical Commission, US Energy Information Administration (EIA), Electrical Equipment Associations, UNESCO Institute for Statistics (UIS) Bloomberg, Businessweek, Factiva, and OneSource, to identify and collect information useful for this technical, market-oriented, and commercial study. The other secondary sources included annual reports, press releases & investor presentations of companies, white papers, certified publications, articles by recognized authors, manufacturer associations, trade directories, and databases.
Primary Research
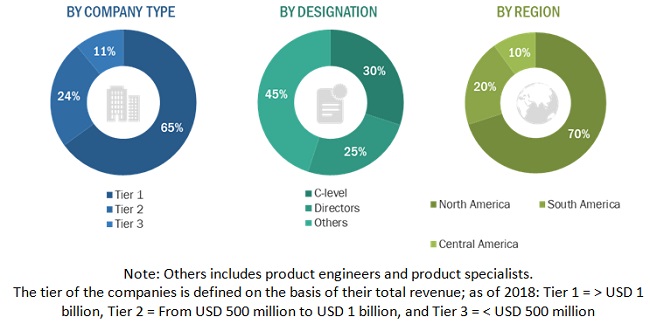
The industrial burner market comprises several stakeholders such as medium-voltage cable manufacturers, raw material providers, manufacturers of subcomponents of cables, manufacturing technology providers, technology support providers, and end users in the supply chain. The demand side of this market is characterized by the rising demand for renewable energy generation major countries such as the US and the rapid pace of industrialization and urbanization across the Americas across a wide variety of end users. The supply side is characterized by rising demand for contracts from the industrial sector, and mergers & acquisitions among big players. Various primary sources from both the supply and demand sides of the market were interviewed to obtain qualitative and quantitative information. Following is the breakdown of primary respondents:
To know about the assumptions considered for the study, download the pdf brochure
Market Size Estimation
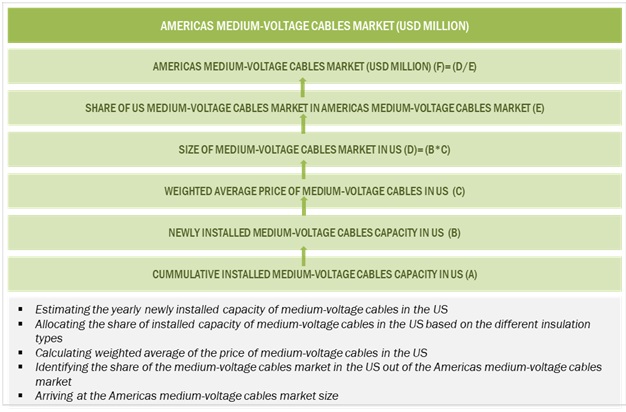
Both top-down and bottom-up approaches were used to estimate and validate the total size of the industrial burner market. These methods were also used extensively to estimate the size of various subsegments in the market. The research methodology used to estimate the market size includes the following:
- The key players in the industry and market have been identified through extensive secondary research, and their market share in the respective regions have been determined through both primary and secondary research.
- The industrys value chain and market size, in terms of value, have been determined through primary and secondary research processes.
- All percentage shares, splits, and breakdowns have been determined using secondary sources and verified through primary sources.
Global Industrial burner Market Size: Bottom-Up Approach
To know about the assumptions considered for the study, Request for Free Sample Report
Data Triangulation
After arriving at the overall market size from the estimation process explained above, the total market has been split into several segments and subsegments. To complete the overall market engineering process and arrive at the exact statistics for all the segments and subsegments, the data triangulation and market breakdown processes have been employed, wherever applicable. The data has been triangulated by studying various factors and trends from both the demand- and supply sides. Along with this, the market has been validated using both the top-down and bottom-up approaches.
Objectives of the Study
- To define, describe, segment, and forecast the Americas medium-voltage cables market size, by insulation type, voltage, application, and end user, in terms of value
- To define, describe, segment, and forecast the market size, by insulation type and region, in terms of volume
- To provide detailed information on the major drivers, restraints, opportunities, and industry-specific challenges influencing the growth of the market
- To provide detailed information on market map, value chain, case studies, pricing, technologies, market ecosystem, tariff and regulatory landscape, Porters five forces, and trends/disruptions impacting customers businesses that are specific to the market
- The analyze impact of COVID-19 on the market
- To strategically analyze the market with respect to individual growth trends, prospects, and contributions of each segment to the market
- To analyze market opportunities for stakeholders and provide a detailed competitive landscape for market leaders
- To forecast the revenue of the market segments with respect to 3 main regions (along with countries), namely, North America, South America, and Central America
- To strategically profile the key players and comprehensively analyze their market shares and core competencies
- To analyze competitive developments, such as sales contracts, agreements, investments, expansions, product launches, mergers, partnerships, joint ventures, collaborations, and acquisitions, in the market
Available Customizations:
With the given market data, MarketsandMarkets offers customizations as per the clients specific needs. The following customization options are available for this report:
Geographic Analysis
- Further breakdown of region or country-specific analysis
Company Information
- Detailed analyses and profiling of additional market players (up to 5)


 Generating Response ...


Growth opportunities and latent adjacency in Americas Medium-Voltage Cables Market