
Submarine Cable Systems Market Size, Share & Trends

Submarine Cable Systems Market Size, Share, Growth & Trends by Cable Type (Communication Cable, Power Cable), Component (Dry Plant Product, Wet Plant Product), Insulation (Cross-linked Polyethylene, Oil-Impregnated Paper) and Type (Single Core, Multicore) - Global Forecast to 2030


SUBMARINE CABLE SYSTEM MARKET SIZE, SHARE & GROWTH TRENDS OVERVIEW
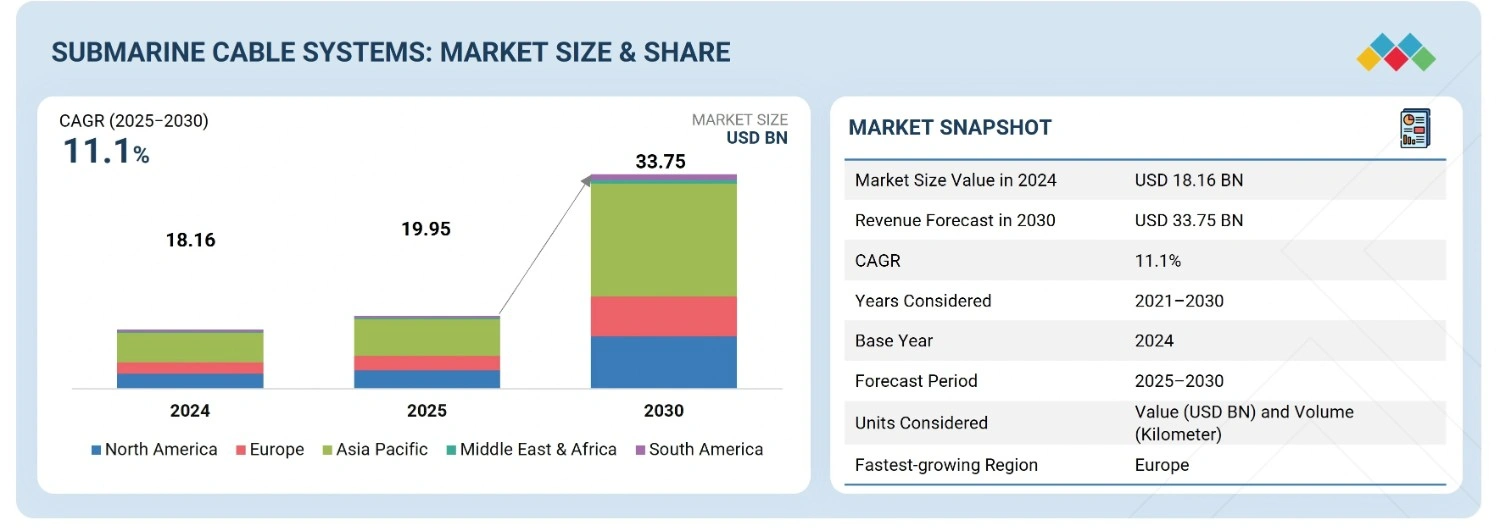
According to Marketsandmarkets, the global submarine cable systems market size was valued at USD 19.95 billion in 2025 and is projected to reach USD 33.75 billion by 2030, growing at a CAGR of 11.1% from 2025 to 2030. Submarine cable systems are widely used for communication and power transmission. The growth of these cables is driven by as they are primarily used to connect the mainland with large islands and power grids with oil & gas platforms and transmit electricity across countries or islands.
MARKET SNAPSHOT REPORT
| REPORT METRIC | DETAILS |
|---|---|
| Market Size in 2025 (Value) | USD 19.95 Billion |
| Market Forecast in 2030 (Value) | USD 33.75 Billion |
| Growth Rate | CAGR of 11.1% from 2025 to 2030 |
| Years Considered | 2021–2030 |
| Base Year | 2024 |
| Forecast Period | 2025–2030 |
| Units Considered | Value (USD Million/Billion) and Volume (Kilometer) |
| Report Coverage | Revenue Forecast, Company Ranking, Competitive Landscape, Growth Factors, and Trends |
| Segments Covered |
|
| Regional Scope | North America, Europe, Asia Pacific, Middle East, Latin America, and Africa |
| Top Companies |
|
| Growth Drivers |
|
Market Size & Forecast
KEY TAKEAWAYS
-
BY TYPEThe submarine power cable market comprises single core and multicore cables, with single core cables widely used for offshore wind power and island connections, while multicore cables are gaining traction for complex power transmission and telecommunication applications requiring high efficiency.Analysis
-
BY VOLTAGESubmarine power cables are deployed across medium-voltage and high-voltage. High-voltage dominates due to rising offshore wind farm installations and the need for long-distance, high-capacity power transmission across regions.
-
BY INSULATIONSubmarine power cables use cross-linked polyethylene (XLPE) and oil-impregnated paper, resin-impregnated paper, and resin-impregnated synthetics (RIS). XLPE is gaining rapid adoption due to its superior thermal performance, ease of installation, and eco-friendliness, while oil-impregnated cables maintain relevance in ultra-high voltage and legacy projects.
-
BY END-USE APPLICATIONSubmarine power cables have end-use applications such as offshore wind power generation plants, intercountry & island connections, and offshore oil & gas plants. Adoption is led by the offshore wind power generation plant, which drives the largest share due to increasing renewable energy investments, followed by intercountry & island connections, and offshore oil & gas plants power transmission projects.
-
BY REGIONEurope dominates the submarine cable market, fueled by extensive offshore wind energy projects and supportive government policies. North America is expected to record the fastest growth with large-scale renewable energy integration and expanding subsea interconnections in the US and Canada.
-
COMPETITIVE LANDSCAPEMajor players such as Prysmian S.p.A, NKT A/S, Nexans, Sumitomo Electric Industries, Ltd., and LS Cable & System Ltd. are focusing on organic and inorganic growth strategies, including capacity expansions, partnerships, and new project deployments, to strengthen their presence in offshore renewable and interconnection projects.
The submarine cable systems market size is set to expand over the coming years, fueled by rising global data traffic, offshore wind projects, and cross-border power transmission needs. Advancements in fiber optics and HVDC technologies are enhancing connectivity, efficiency, and grid reliability worldwide.
Source: Secondary Research, Interviews with Experts, MarketsandMarkets
TRENDS & DISRUPTIONS IMPACTING CUSTOMERS' CUSTOMERS
The submarine cable systems market growth is experiencing strong growth, driven by the expansion of offshore wind farms, oil & gas operations, and the rising need for international communication. Increasing investments in HVDC transmission, 5G/6G connectivity, and cloud services are reshaping revenue streams while emphasizing durability, reliability, and high data capacity. At the same time, digital technologies such as AI, IoT, and machine learning are transforming operations through real-time monitoring, predictive maintenance, and data-driven decision-making, pushing companies to innovate and adapt to evolving bandwidth and interconnectivity demands.

Source: Secondary Research, Interviews with Experts, MarketsandMarkets Analysis
MARKET DYNAMICS
Level
-
Rising need for reliable power transmission amid expanding offshore wind power capacity

-
Increasing bandwidth usage due to high access to affordable internet connectivity

Level
-
Significant upfront investments and associated maintenance expenses

-
Requirement for permits for submarine cable installations

Level
-
Evolving HVDC power transmission technology

-
Increasing investment in submarine cable projects by over-the-top (OTT) players

Level
-
Lack of commissioning, maintenance, and repair activities for vessels

-
Growing reliance on satellite internet technology

Source: Secondary Research, Interviews with Experts, MarketsandMarkets Analysis
Driver: Rising need for reliable power transmission amid expanding offshore wind power capacity
Expanding offshore wind power capacity greatly boosts the submarine cable systems market, increasing the need for reliable power transmission infrastructure to connect offshore wind farms to onshore grids.
Restraint: Significant upfront investments and associated maintenance expenses
The initial investment required to commission a submarine cable, and the associated maintenance costs are very high, which inhibits new players from entering the market.
Opportunity: Evolving HVDC power transmission technology
With the increasing installation of submarine power cable systems, the need for efficient power transmission and reduced dissipative losses has also risen. This can be achieved with the help of high-voltage direct current (HVDC) submarine power cables that offer several advantages over conventional high-voltage alternating current (HVAC) technologies.
Challenge: Growing reliance on satellite internet technology
The majority of international data flow is transmitted via submarine cables. However, even with the massive network of subsea cables, huge populations worldwide remain unconnected or are facing disrupted connectivity, which, in turn, is restricting the use of these cables as the primary means of data transfer on a global scale.
Submarine Cable Systems Market Trends: COMMERCIAL USE CASES ACROSS INDUSTRIES
| COMPANY | USE CASE DESCRIPTION | BENEFITS |
|---|---|---|
 |
Deployment of private subsea cable systems to expand global cloud infrastructure and handle increasing data demand | Improved global connectivity | Reduced latency| Reliable cloud services | Scalable network capacity |
 |
High-capacity transatlantic subsea cable to support Azure, Office 365, and other cloud-based services | Lower latency | Increased bandwidth | Enhanced global cloud performance | Spport for data-heavy applications |
 |
Undersea cable connecting mainland India to the Andaman & Nicobar Islands for telecom and high-speed internet | Reliable remote area connectivity | Improved telecom infrastructure | Regional digital growth |Economic development |
 |
Subsea interconnectors such as North Sea Link and Viking Link for cross-border electricity transfer and renewable energy integration | Optimized power distribution | Enhanced energy security | Better renewable energy utilization | Reduced emissions |
 |
Secure subsea cable systems managed by NAVFAC for defense communications, sensor networks, and operations | Secure and reliable military communications | Uninterrupted missions | Strengthened maritime surveillance |
Logos and trademarks shown above are the property of their respective owners. Their use here is for informational and illustrative purposes only.
MARKET ECOSYSTEM
The submarine cable system ecosystem is highly interconnected, involving multiple stakeholders that ensure seamless global data transmission. Manufacturers such as Alcatel Submarine Networks, Prysmian, and Nexans supply the physical cables, while service providers such as SubCom and VIAVI deliver installation, maintenance, and monitoring solutions. Data center providers, including Equinix, Ciena, and Infinera, integrate subsea connectivity with cloud and digital infrastructure, enabling low-latency communication. Meanwhile, terrestrial operators, such as China Mobile, AT&T, Airtel, and Telefónica, extend subsea connectivity to end users across regions. Finally, system integrators play a key role in bringing together manufacturing, services, and operations, ensuring reliable and large-scale deployment of submarine cable networks that power the global digital economy.

Logos and trademarks shown above are the property of their respective owners. Their use here is for informational and illustrative purposes only.
MARKET SEGMENTS

Source: Secondary Research, Interviews with Experts, MarketsandMarkets Analysis
Submarine Power Cable System Market, by Type
The single core segment held a larger market share in 2024, as single core cables feature a higher bandwidth than multicore cables and, hence, a high data transmission rate. Also, single core cables are suitable for covering longer lengths as they experience lower reverse currents than multicore cables. The high value of the segment is also attributed to the high cost of installation, connectors, and systems.
Submarine Power Cable System Market, by Insulation
The cross-linked polyethylene (XLPE) segment accounted for a significant share in 2024, as XLPE cables have exceptional properties, including high electric and mechanical strength, aging and environmental stress resistance, and anti-chemical corrosion characteristics.
Submarine Power Cable System Market, by Voltage
The high-voltage segment held the largest share in 2024. The increased demand for interconnecting different countries and the rise in the requirement of integrating offshore renewable energy generation plants with other installations are driving the growth of the high-voltage segment.
Submarine Power Cable System Market, by End-use Application
The offshore wind power generation plants segment held the largest share in 2024, due to the rapid expansion of renewable energy projects and increasing government investments in clean energy. Submarine cables are essential for transmitting electricity from offshore wind farms to onshore grids, driving strong demand for high-voltage and reliable cable solutions.
Submarine Communication Cable Segment, By Component
The wet plant segment held the largest share in 2024 as it includes core undersea components like submerged cables, repeaters, and branching units that enable long-distance, high-capacity transmission. These elements are cost-intensive, technologically advanced, and essential for reliable global connectivity, making them the largest contributor to overall market share.
Submarine Communication Cable Segment, By Service Offering
The installation & commissioning segment holds a major share in 2024 because it involves complex seabed surveying, cable laying, and deployment of repeaters and branching units, which are highly capital-intensive. Additionally, the need for specialized vessels, skilled expertise, and regulatory compliance further drives its significant share in the market.
REGION
Europe to hold largest market share of global submarine power cable market during forecast period
Europe holds the largest market share of submarine power cable systems market, due to the increasing demand from the offshore wind sector and new grid interconnection projects. Furthermore, Europe hosts numerous offshore oil & gas projects, notably in the UK, Norway, the Netherlands, Italy, and Denmark. These projects, including Ekofisk (Norway), Montrose (UK), Forties (UK), and Statford (Norway), are actively engaged in exploration and production activities, attracting fresh investments in the offshore oil & gas sector and subsequently fueling demand for submarine power cables in the region.

Submarine Cable Systems Market SHARE: COMPANY EVALUATION MATRIX
In the submarine cable systems market matrix, Sumitomo Electric (Star) leads with a strong market presence and broad product footprint, driving large-scale adoption of high-performance submarine power and communication cables across global projects. NKT (Emerging Leader) is gaining traction with its focus on advanced insulation technologies, HVDC solutions, and sustainable manufacturing practices to support offshore wind and intercontinental connectivity. While Sumitomo Electric dominates with scale, innovation, and reliability, NKT shows strong growth potential to move toward the leaders’ quadrant through its expanding role in renewable energy integration and long-distance transmission solutions.

Source: Secondary Research, Interviews with Experts, MarketsandMarkets Analysis
WHAT IS IN IT FOR YOU: Submarine Cable Systems Market Trends REPORT CONTENT GUIDE

DELIVERED CUSTOMIZATIONS
We have successfully delivered the following deep-dive customizations:
| CLIENT REQUEST | CUSTOMIZATION DELIVERED | VALUE ADDS |
|---|---|---|
| Global Submarine Cable Manufacturer | • Detailed company benchmarking (financials, product portfolio, HVDC vs. HVAC offering) • Market share analysis by cable type (power vs. communication) • Partnership & consortium mapping | • Identify competitive strengths & product positioning • Highlight merger/partnership opportunities for expansion • Detect untapped regional demand pockets |
| Offshore Wind Developer | • Comprehensive mapping of submarine power cable suppliers • Cost benchmarking across XLPE & mass-impregnated cables • Analysis of installation & commissioning service providers | • Optimize sourcing for offshore wind projects • Reduce procurement risks by diversifying supplier base • Enable long-term cost savings in cable procurement |
| Telecom Operator | • Demand modeling of submarine communication cables by route • Forecast of bandwidth & data traffic growth by 5G/6G rollout • Competitive landscape of system integrators | • Plan network expansions with accurate demand forecasting • Support investment strategies in high-data routes • Strengthen partnerships with cable consortia |
| Regional Government/Regulator | • Regional demand outlook for subsea connectivity • Policy benchmarking (environmental & installation guidelines) • Impact assessment of new cable landing stations | • Facilitate public–private partnerships in cable deployment • Support in policy decision-making for subsea projects • Encourage foreign investment in connectivity infrastructure |
RECENT DEVELOPMENTS
- May 2025 : Space Norway and SubCom, LLC finalized a contract for the Arctic Way Cable System, which will connect mainland Norway with Jan Mayen and Svalbard. The system will enhance route diversity and support the region’s growing data transmission needs.
- March 2025 : Prysmian S.p.A signed a 7-year framework agreement with Dutch subsea service provider N-SEA for rapid maintenance and repair of submarine cables. This partnership enhances Prysmian’s monitoring and IMR capabilities, delivering a market-first solution that supports the European Commission’s call to protect critical energy and telecom infrastructure.
- March 2025 : Nexans signed a major framework agreement with RTE, France’s transmission system operator, to supply, install, and commission HVDC subsea and onshore cables. The project will connect the Center Manche 1 & 2 and Oléron offshore wind farms to the French power grid.
- March 2024 : Alcatel Submarine Networks signed a Letter of Intent with the Northern Endurance Partnership (NEP) to deploy a DC/FO submarine cable infrastructure for the NEP CO2 transport and storage project, a joint venture between bp, Equinor, and TotalEnergies. Connecting the Teesside onshore NEP infrastructure to the subsea injection site would provide power and communication for subsea control systems, with the flexibility for future expansion to accommodate increasing carbon dioxide (CO2) storage needs. Leveraging standard products to mitigate risks and reduce costs, this project marks a significant advancement in adopting DC/FO technology for offshore carbon capture, usage, and storage, contributing to the fight against global warming.
- September 2023 : SubCom, LLC expanded its manufacturing (more cables, faster production) and marine operations (new ships, deployment center) in the Philippines to meet the growing demand for undersea cables used in digital infrastructure. They have also increased their workforce by 20% to serve customers better.
Table of Contents
 Exclusive indicates content/data unique to MarketsandMarkets and not available with any competitors.
Methodology
The study involved four major activities in estimating the current size of the submarine cable systems market. Exhaustive secondary research was conducted to gather information on the market, adjacent markets, and the overall submarine cable system landscape. These findings, assumptions, and projections were validated through primary research involving interviews with industry experts and key stakeholders across the value chain. Both top-down and bottom-up approaches were utilized to estimate the overall market size. Subsequently, market breakdown and data triangulation techniques were applied to determine the sizes of various segments and subsegments. Two key sources, secondary and primary, were leveraged to conduct a comprehensive technical and commercial assessment of the submarine cable systems market.
Secondary Research
The secondary research process referred to various secondary sources to identify and collect necessary information for this study. The secondary sources included annual reports, press releases, and investor presentations of companies; white papers; journals and certified publications; and articles from recognized authors, websites, directories, and databases. Secondary research was conducted to obtain key information about the industry’s supply chain, the market’s value chain, the total pool of key players, market segmentation according to the industry trends (to the bottom-most level), regional markets, and key developments from market- and technology-oriented perspectives. The secondary data was collected and analyzed to determine the overall market size, further validated by primary research.
Primary Research
Extensive primary research was conducted after gaining knowledge about the current scenario of the submarine cable systems market through secondary research. Several primary interviews were conducted with experts from the demand and supply sides across four major regions—North America, Europe, Asia Pacific, and RoW. This primary data was collected through questionnaires, emails, and telephonic interviews.

Note: Three tiers of companies have been defined based on their total revenue as of 2024: tier 3: revenue less than USD 500 million; tier 2: revenue between USD 500 million and USD 1 billion; and tier 1: revenue more than USD 1 billion. Other designations include sales managers, marketing managers, and product managers.
To know about the assumptions considered for the study, download the pdf brochure
Market Size Estimation
Both top-down and bottom-up approaches were used to estimate and validate the total size of the submarine cable systems market. These methods have also been used extensively to estimate the size of various subsegments in the market. The following research methodology was used to estimate the market size:
- Major players in the industry and markets were identified through extensive secondary research
- The industry’s value chain and market size (in terms of value) were determined through primary and secondary research processes
- All percentage shares, splits, and breakdowns were determined using secondary sources and verified through primary sources
Submarine Cable Systems Market : Top-Down and Bottom-Up Approach

Data Triangulation
After arriving at the overall size of the submarine cable systems market using the market size estimation process explained above, the total market was split into several segments and subsegments. Data triangulation and market breakdown procedures were employed, wherever applicable, to complete the overall market engineering process and arrive at the exact statistics for all segments and subsegments of the market. The data was triangulated by studying various factors and trends from the demand and supply sides. The market size was also validated using top-down and bottom-up approaches.
Market Definition
Submarine cable systems are widely used for communication and power transmission. These cables are laid on the seabed to carry telecommunication signals from one land-based station to another across oceans. Submarine power cables are laid on ocean beds, straits, or rivers to transmit electricity at high voltages over long distances. They are primarily used to connect the mainland with large islands, power grids with oil & gas platforms, and to transmit electricity across countries or islands.
Key Stakeholders
- Telecommunication service providers
- Electricity providers
- Submarine cable system manufacturers
- Technology investors
- Research institutes and organizations
- Small and large technology centers
- Renewable energy solution providers
- Market research and consulting firms
Report Objectives
- To define, describe, and forecast the submarine cable systems market, in terms of cable type, component, service offering, type, end-use application, voltage, insulation, and region, in terms of value
- To forecast the market, by cable type, in terms of volume
- To describe and forecast the market with regard to five main regions: North America, Europe, Asia Pacific, the Middle East & Africa, and South America, along with their respective countries, in terms of value
- To provide detailed information regarding major factors, such as drivers, restraints, opportunities, and challenges, influencing the market growth
- To provide a detailed overview of the submarine cable systems value chain
- To strategically analyze micromarkets with respect to individual growth trends, prospects, and contributions to the submarine cable systems market
- To analyze opportunities in the market for stakeholders by identifying high-growth segments of the submarine cable systems market
- To strategically profile key players and comprehensively analyze their market position in terms of ranking and core competencies, along with detailing the competitive landscape for market leaders
- To analyze competitive strategies, such as product launches, expansions, and mergers & acquisitions, adopted by key players in the submarine cable systems market
Available customizations:
With the given market data, MarketsandMarkets offers customizations according to the company’s specific needs. The following customization options are available for the report:
Company Information:
- Detailed analysis and profiling of additional market players (up to 5)
Key Questions Addressed by the Report
What is the current size of the global submarine cable systems market?
The global submarine cable systems market is estimated at USD 19.95 billion in 2025 and is projected to reach USD 33.75 billion by 2030. (MarketsandMarkets)
What is the expected growth rate of the submarine cable systems market?
The market is expected to grow at a CAGR of 11.1% during 2025–2030, driven by increasing investments in telecommunications infrastructure and offshore energy projects. (MarketsandMarkets)
What are the major growth drivers for the submarine cable systems market?
Key growth drivers include rising global internet traffic, expansion of cloud services and data centers, deployment of 5G/6G networks, growth in offshore wind farms, and increasing cross-border power transmission projects. (MarketsandMarkets)
Which cable type segment dominates the submarine cable systems market?
The single-core cable segment holds the largest market share due to its higher bandwidth, lower reverse current, and suitability for long-distance power transmission and offshore applications. (MarketsandMarkets)
Which voltage segment is expected to grow the fastest?
The high-voltage submarine cable segment is expected to register the highest growth rate due to increasing offshore renewable energy installations and inter-country grid connectivity projects. (MarketsandMarkets)
Which region leads the global submarine cable systems market?
Europe holds the largest market share, supported by extensive offshore wind projects, grid interconnections, and offshore oil & gas developments across countries such as the UK, Norway, Denmark, and the Netherlands. (MarketsandMarkets)
What are the key trends shaping the submarine cable systems industry?
Key trends include expansion of offshore wind energy, adoption of HVDC transmission technology, increasing subsea fiber-optic connectivity, AI-driven cable monitoring, and growing investments in transoceanic communication networks. (MarketsandMarkets)
Who are the leading companies in the submarine cable systems market?
Major market participants include Prysmian S.p.A, NKT A/S, Nexans, Sumitomo Electric Industries, LS Cable & System, Alcatel Submarine Networks, SubCom, and NEC Corporation. (MarketsandMarkets)
What are the major challenges facing the submarine cable systems industry?
Key challenges include high installation and maintenance costs, complex regulatory approvals, geopolitical risks affecting cable routes, environmental concerns, and vulnerability to physical damage from fishing, anchoring, and natural disasters. (Marketsa
What is the future outlook for the submarine cable systems market?
The market outlook remains strong through 2030 due to increasing digital connectivity needs, rising investments in renewable energy transmission, expanding offshore infrastructure, and growing demand for reliable global communications networks. (Marketsan
Need a Tailored Report?
Customize this report to your needs
Get 10% FREE Customization
Customize This ReportPersonalize This Research
- Triangulate with your Own Data
- Get Data as per your Format and Definition
- Gain a Deeper Dive on a Specific Application, Geography, Customer or Competitor
- Any level of Personalization
Let Us Help You
- What are the Known and Unknown Adjacencies Impacting the Submarine Cable Systems Market
- What will your New Revenue Sources be?
- Who will be your Top Customer; what will make them switch?
- Defend your Market Share or Win Competitors
- Get a Scorecard for Target Partners

Custom Market Research Services
We Will Customise The Research For You, In Case The Report Listed Above Does Not Meet With Your Requirements
Get 10% Free CustomisationTESTIMONIALS

Tetsuya Ohhira
Business Development Manager-Technology Business
Nikon Corporation,
Leading Japanese MNC specializing in optics and imaging productswww.nikon.com
MarketsandMarkets™ response
is quick. Their attitude is flexible and positive. Analyst Insights are globally considered and
significant. Client Services quickly respond to our inquiry and demand. Their wide range of global
surveys help us make our strategic plan.
We hope Knowledge Store will be easier to search
for a report.
VP - Marketing & Business Development
Leading Provider of Process Control Solutions
We engaged with MarketsandMarkets on a study to perform an analysis and recommend a Go-To-Market strategy for metrology and process control in the semiconductor market. The study was tailored to our targets and needs with well-defined milestones. Our overall experience with the MarketsandMarkets team was very good throughout the project in all aspects including the analysis methodologies used, the quality and depth of primary and secondary data sets, the professionalism and flexibility of the team and the ability to meet the target schedule and milestones. We want to thank MarketsandMarkets team for a job well done.
Growth opportunities and latent adjacency in Submarine Cable Systems Market


Shahmeer
Sep, 2022
Want to identify component that are covered within this report..