Cables and Accessories Market by Voltage (Low, Medium, High), LV by Installation (Overhead (Conductors, Accessories), Underground (PVC, XLPE, Terminations, and Joints)), LV by End-User (Industrial, Renewables), and Region - Global Forecast to 2022


Global Cables and Accessories Market: Overview
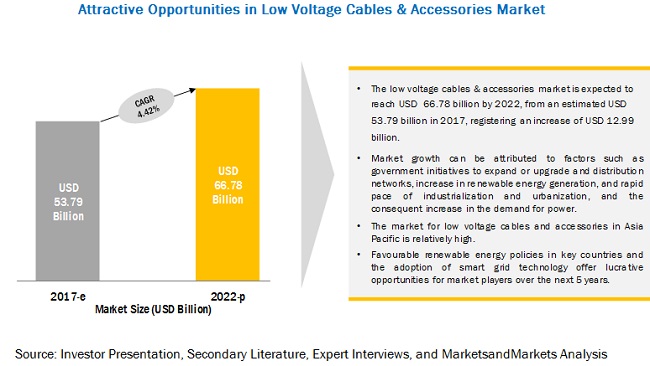
[205 Pages Report] MarketsandMarkets forecasts the Cables and Accessories market to grow from USD 121.63 billion in 2018 to USD 158.25 billion by 2022, at a Compound Annual Growth Rate (CAGR) of 5.40% during the forecast period. The factors driving the market include increasing focus on grid interconnections, the growth of offshore wind farms, and increasing power generation capacity. In addition, improving long-distance T&D infrastructure would further aid the growth of this market. The objective of the report is to define, describe, and forecast the cables and accessories market size based on voltage, and low voltage cables and accessories market size based on end-user, Installation, and region.
By voltage, the low voltage cables and accessories market is expected to dominate the cables and accessories market during the forecast period
The low voltage segment held the largest market share in 2016 and is estimated to hold the largest market share during the forecast period as well. The low voltage cables category holds a major share in the power cables market given the wide array of its applications varying from residential use to industrial applications. Massive distribution network expansions and increasing urbanization and industrialization projects in China and India are the main reasons for the growth of the low voltage cables and accessories market in the Asia Pacific region.
By end-user, the infrastructure segment in low voltage cables & accessories market is expected to be the largest segment during the forecast period
The infrastructure segment is expected to be the largest during the forecast period. The infrastructure category dominated the end-user segment in the low voltage cables and accessories market due to increased use of low voltage cables in the commercial and residential sectors in 2016. Infrastructure development is taking place across the globe especially in the developing regions. The growing urbanization has given rise to the increase in construction of new buildings which is resulting in the increase in demand for power cables and associated accessories.
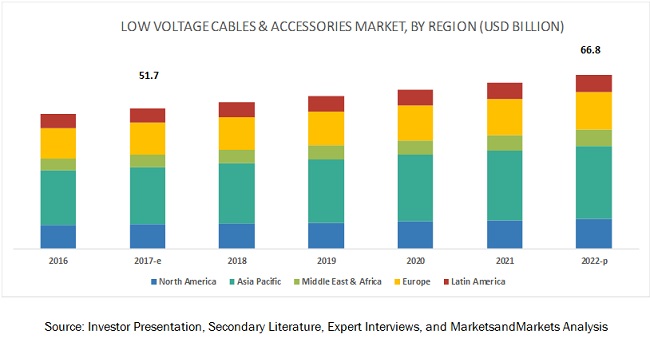
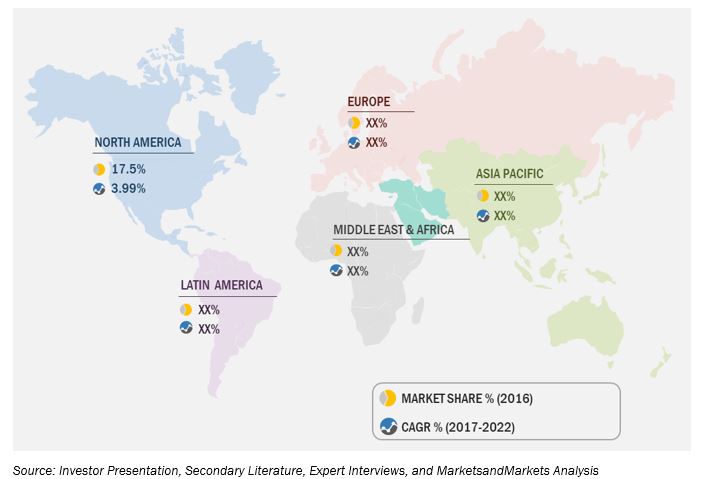
Asia Pacific to account for the largest market size of low voltage cables and accessories market during the forecast period
In 2016, the Asia Pacific market was the largest low voltage cables and accessories market. It is expected to continue leading the low voltage cables and accessories market during forecast period due to massive T&D network expansion and increasing urbanization and industrialization projects in China and India. The growing demand for electricity is the major driver for the growth of the global power transmission and distribution systems market, thus, driving the low voltage cables and accessories market. The growing demand for electricity is expected to lead to the need to replace aging power transmission infrastructure and an increase in the demand for equipment such as low, medium, and high-power cables.
Market Dynamics
Driver: Government initiatives to expand or upgrade transmission & distribution systems
The increasing number of government initiatives and policies for grid infrastructure is a key factor driving the growth of the cables and accessories market. Most emerging countries, including India, Indonesia, and Brazil, are not 100% electrified. However, the governments in these countries have undertaken multiple initiatives to electrify both rural and urban areas. According to the Indian Ministry of Power, the Government of India plans to add 48 GW of solar power capacity by 2019 and 93 GW by 2022, under a project called Power for All. Low voltage cables play a significant part in infrastructure activities. Developing countries such as India are focusing on strong growth through investments in the power, industrial, and telecom sectors, among others. Moreover, according to the Ministry of Power, the Indian government has also launched an initiative to ensure all citizens have electricity by 2018. This would involve an estimated cost of USD 2.5 billion. The transmission sector has also witnessed a considerable increase from 5,30,456 MVA in 2014 to 7,22,949 MVA in 2017, leading to an increase in the demand for equipment such as low voltage, medium voltage, and high voltage cables.
Restraint: Complex planning & authorization procedures leading to delays
Environmental factors play an important role in the changing priorities of transmission and distribution projects. The installation of transmission and distribution lines and cables involve multiple stages of approvals and procedures. Environmental clearance is one such stage of approval, which includes various agreements as well as approvals for forest or vegetation clearances. In addition, the risk of using hazardous substances such as cross-linked polyethylene (XLPE) cables makes it difficult to gain approval for power projects. To reduce the effect of XLPE cables, recycling aspects such as recovery of cables, recyclability of copper, and dealing with XLPE need to be considered. Delay in project execution also leads to cost overruns. In India, power projects led by National Thermal Power Corporation Limited (NTPC) were delayed and cost USD 2 billion in overruns. In certain cases, the overrun cost is more than the original estimated cost of the project. These factors could hamper the growth of the low voltage cables market
Opportunity: Favorable renewable energy policies in key countries
The increasing problem around the globe regarding global warming, carbon emissions, and increasing pollution has motivated countries to move toward clean energy. The governments of different nations around the world are tackling environmental issues. Different initiatives are being taken by governments to motivate renewable power generation projects which generate energy without producing and emitting CO2. Some of the incentives, such as feed-in tariffs, tax credits, and maturity of technology at commercial scales, have led to investors and project developers shifting toward renewable power generation. In 2016, the total investments in renewable power and fuel were USD 214.6 million, which shows that the focus is gradually shifting toward renewable sources of energy.
Challenge: Grey market providing low-quality and inexpensive products
The cables and accessories market include both organized and unorganized players/sectors. The organized sector mainly targets industrial buyers and maintains high product quality, while players in the unorganized sector provide cheaper alternatives to increase their market presence and penetrate local markets. Local manufacturers in most countries constitute the unorganized sector and face strong competition from global suppliers in the respective markets. Leading market players are facing stiff competition from unorganized market players, who supply cheap and low-quality products. These grey market players have an upper hand over well-established player in terms of price competitiveness.
Scope of the Report
|
Report Metric |
Details |
|
Market size available for years |
2016�2022 |
|
Base year considered |
2016 |
|
Forecast period |
2017�2022 |
|
Forecast units |
Billion (USD) |
|
Segments covered |
Voltage (Low Voltage, Medium Voltage, High Voltage), Installation (Overhead, Underground, Submarine), End-User and Region |
|
Geographies covered |
Asia Pacific, Europe, North America, Latin America, Middle East, and Africa |
|
Companies covered |
Prysmian (Italy), Nexans (France), NKT Cables (Germany), General Cable (US), Sumitomo (Japan), ABB (Switzerland), Dubai Cable (UAE), LS Cable (South Korea), Tele-Fonika (Poland), Southwire (US), Elsewedy (Egypt), Furukawa (Japan), Kabelwerke (Switzerland) |
The research report categorizes the Cables and Accessories Market to forecast the revenues and analyze the trends in each of the following sub-segments:
Cables and Accessories Market By Voltage
- Low Voltage
- Medium Voltage
- High Voltage
Low Voltage Cables and Accessories Market By End User
- Industrial
- Utilities
- Oil & Gas
- Mining & Metals
- Chemicals & Petrochemicals
- Other Industrial
- Renewable
- Wind Power
- Solar Power
- Infrastructure
- Commercial & Residential
- Transportation
Low Voltage Cables and Accessories Market By Power Range
- Overhead Cables & Accessories
- Conductors & Cables
- Accessories
- Cable Joints
- Resin cable joints
- Heat shrink cable joints
- Cold shrink cable joints
- Cable Terminations
- Connectors
- Clamps
- Others
- Cable Joints
- Underground Cables & Accessories
- XLPE Cables
- PVC cables
- Cable joints
- Terminations
- Others
- Submarine Cables & Accessories
- XLPE Cables
- PVC cables
- Cable joints
- Terminations
- Others
Low Voltage Cables and Accessories Market By Region
- Asia Pacific
- Europe
- North America
- Middle East
- Africa
- Latin America
Key Market Players
Prysmian (Italy), Nexans (France), NKT Cables (Germany), General Cable (US), Sumitomo (Japan), ABB (Switzerland), Dubai Cable (UAE), LS Cable (South Korea), Tele-Fonika (Poland), Southwire (US), Elsewedy (Egypt), Furukawa (Japan), Kabelwerke (Switzerland)
Prysmian is one of the leading companies in supplying cable and system solutions to the energy and telecom sectors. The company operates its business through four segments namely: energy products, energy projects, telecom, and oil and gas. It offers cables under energy projects operating segment. The company has adopted various strategies such as contracts & agreements and expansions to gain market share in cables and accessories market. In May 2017, the company has signed a technology cooperation agreement with Nanocomp Technologies to improve the use of various technologies in power transmission, power distribution, telecom networks, control, and instrumentation applications.
Recent Developments
- In October 2017, Prysmian expanded its presence in Asia Pacific by opening its new factory in China with two production lines with a production capacity of over 30,000 tons per year.
- In October 2017, Nexans received a contract to supply 3,000 km of medium and low voltage cables and instrumentation cables for the Nasr Phase II field development project in Abu Dhabi. It would supply cables ranging from 250 V to 132 kV. This would strengthen its presence in the Middle East
- In June 2017, Prysmian expanded its business by opening its new optical plant in Slatina, Romania, Europe. This would enable the company to meet the demand for optical cables for the deployment of new high-speed telecommunication networks
- In March 2017, Nexans launched the FLAMEX SI-FR line extension in its fire-resistant cable products. The new launch is particularly required at high temperatures to save the weight. The cables can operate at up to 170�C with a maximum operating voltage of 3 or 6 kV
Critical questions the report answers:
- Where will all these developments take the industry in the long term?
- What are the upcoming trends for the cables and accessories market?
- Which segment provides the most opportunity for growth?
- Who are the leading manufacturers operating in this market?
- What are the opportunities for new market entrants?
To speak to our analyst for a discussion on the above findings, click Speak to Analyst
 Exclusive indicates content/data unique to MarketsandMarkets and not available with any competitors.
Table of Contents
1 Introduction (Page No. - 20)
1.1 Objectives of the Study
1.2 Market Definition
1.3 Market Scope
1.3.1 Markets Covered
1.4 Years Considered for the Study
1.5 Currency
1.6 Stakeholders
2 Research Methodology (Page No. - 24)
2.1 Introduction
2.1.1 Secondary Data
2.1.1.1 Key Data From Secondary Sources
2.1.2 Primary Data
2.1.2.1 Key Data From Primary Sources
2.1.2.2 Key Industry Insights
2.1.2.3 Breakdown of Primary Interviews
2.2 Market Size Estimation
2.2.1 Top-Down Approach
2.3 Market Breakdown & Data Triangulation
2.4 Research Assumptions
3 Executive Summary (Page No. - 32)
4 Premium Insights (Page No. - 36)
4.1 Attractive Opportunities in the Low Voltage Cables & Accessories Market
4.2 Asia Pacific Low Voltage Cables & Accessories Market Size, By Installation & Country
4.3 Low Voltage Cables & Accessories Market, By Country
4.4 Cables & Accessories Market, By Voltage Range
4.5 Low Voltage Cables & Accessories Market, By Installation
4.6 Low Voltage Cables & Accessories Market, By End-User
5 Market Overview (Page No. - 40)
5.1 Introduction
5.2 Market Dynamics
5.2.1 Drivers
5.2.1.1 Government Initiatives to Expand Or Upgrade Transmission & Distribution Systems
5.2.1.2 Projects for Grid Interconnections
5.2.1.3 Increase in Renewable Energy Generation
5.2.1.4 Rapid Pace of Industrialization & Urbanization & Consequent Increase in the Demand for Power
5.2.2 Restraints
5.2.2.1 Complex Planning & Authorization Procedures Leading to Delays
5.2.2.2 Volatile Prices of Raw Materials
5.2.3 Opportunities
5.2.3.1 Favorable Renewable Energy Policies in Key Countries
5.2.3.1 Adoption of Smart Grid Technology
5.2.4 Challenges
5.2.4.1 Grey Market Providing Low-Quality and Inexpensive Products
6 Cables & Accessories Market, By Voltage (Page No. - 47)
6.1 Introduction
6.1.1 Cables & Accessories Market Size, By Voltage, 2015�2022 (USD Billion)
6.2 Low Voltage
6.2.1 Low Voltage: Cables & Accessories Market Size, By Region, 2015�2022 (USD Million)
6.3 Medium Voltage
6.3.1 Medium Voltage: Cables & Accessories Market Size, By Region, 2015�2022 (USD Million)
6.4 High Voltage
6.4.1 High Voltage: Cables & Accessories Market Size, By Region, 2015�2022 (USD Million)
7 Low Voltage Cables & Accessories Market, By End-User (Page No. - 52)
7.1 Introduction
7.2 Industrial Low Voltage Cables & Accessories Market
7.2.1 Industrial: Low Voltage Cables & Accessories Market Size, By Region, 2015�2022 (USD Million)
7.2.2 Utilities
7.2.2.1 Utilities: Low Voltage Cables & Accessories Market Size, By Region, 2015�2022 (USD Million)
7.2.3 Oil & Gas
7.2.3.1 Oil & Gas: Low Voltage Cables & Accessories Market Size, By Region, 2015�2022 (USD Million)
7.2.4 Mining & Metals
7.2.4.1 Mining & Metals: Low Voltage Cables & Accessories Market Size, By Region, 2015�2022 (USD Million)
7.2.5 Chemicals & Petrochemicals
7.2.5.1 Chemicals & Petrochemicals: Low Voltage Cables & Accessories Market Size, By Region, 2015�2022 (USD Million)
7.2.6 Other Industrial
7.2.6.1 Others: Low Voltage Cables & Accessories Market Size, By Region, 2015�2022 (USD Million)
7.3 Renewables Low Voltage Cables & Accessories
7.3.1 Renewables: Low Voltage Cables & Accessories Market Size, By Region, 2015�2022 (USD Million)
7.3.2 Wind Power
7.3.2.1 Wind Power: Low Voltage Cables & Accessories Market Size, By Region, 2015�2022 (USD Million)
7.3.3 Solar Power
7.3.3.1 Solar Power: Low Voltage Cables & Accessories Market Size, By Region, 2015�2022 (USD Million)
7.4 Infrastructure Low Voltage Cables & Accessories
7.4.1 Infrastructure: Low Voltage Cables & Accessories Market Size, By Region, 2015�2022 (USD Million)
7.4.2 Commercial & Residential
7.4.2.1 Commercial & Residential: Low Voltage Cables & Accessories Market Size, By Region, 2015�2022 (USD Million)
7.4.3 Transportation
7.4.3.1 Transportation: Low Voltage Cables & Accessories Market Size, By Region, 2015�2022 (USD Million)
8 Low Voltage Cables & Accessories Market, By Installation (Page No. - 65)
8.1 Introduction
8.2 Overhead Cables & Accessories
8.2.1 Overhead Cables & Accessories Market Size, By Region, 2015�2022 (USD Million)
8.2.2 Conductors & Cables
8.2.2.1 Conductors & Cables: Overhead Low Voltage Cables & Accessories Market Size, By Region, 2015�2022
8.2.3 Accessories
8.2.3.1 Accessories: Overhead Low Voltage Cables & Accessories Market Size, By Region, 2015�2022
8.2.3.2 Cable Joints
8.2.3.2.1 Cable Joints: Low Voltage Cables & Accessories Market Size, By Region, 2015�2022
8.2.3.2.2 Resin Cable Joints
8.2.3.2.2.1 Resin Cable Joints: Low Voltage Cables & Accessories Market Size, By Region, 2015�2022
8.2.3.2.3 Heat Shrink Cable Joints
8.2.3.2.3.1 Heat Shrink Cable Joints: Low Voltage Cables & Accessories Market Size, By Region, 2015�2022
8.2.3.2.4 Cold Shrink Cable Joints
8.2.3.2.4.1 Cold Shrink Cable Joints: Low Voltage Cables & Accessories Market Size, By Region, 2015�2022
8.2.3.3 Cable Terminations
8.2.3.3.1 Cable Terminations: Overhead Low Voltage Cables & Accessories Market Size, By Region, 2015�2022
8.2.3.4 Connectors
8.2.3.4.1 Connectors: Overhead Low Voltage Cables & Accessories Market Size,By Region, 2015�2022
8.2.3.5 Clamps
8.2.3.5.1 Clamps: Overhead Low Voltage Cables & Accessories Market Size, By Region, 2015�2022
8.2.3.6 Others
8.2.3.6.1 Others: Overhead Low Voltage Cables & Accessories Market Size, By Region, 2015�2022
8.3 Underground Cables & Accessories
8.3.1 Underground: Low Voltage Cables & Accessories Market Size, By Region, 2015�2022 (USD Million)
8.3.2 XLPE Cables
8.3.2.1 XLPE Cables: Underground Low Voltage Cables & Accessories Market Size, By Region, 2015�2022 (USD Million)
8.3.3 PVC Cables
8.3.3.1 PVC Cables: Underground Low Voltage Cables & Accessories Market Size, By Region, 2015�2022 (USD Million)
8.3.4 Cable Joints
8.3.4.1 Cable Joints: Underground Low Voltage Cables & Accessories Market Size, By Region, 2015�2022 (USD Million)
8.3.5 Terminations
8.3.5.1 Terminations: Underground Low Voltage Cables & Accessories Market Size, By Region, 2015�2022 (USD Million)
8.3.6 Others
8.3.6.1 Others: Underground Low Voltage Cables & Accessories Market Size, By Region, 2015�2022 (USD Million)
8.4 Submarine Cables & Accessories
8.4.1 XLPE Cables
8.4.1.1 XLPE Cables: Submarine Low Voltage Cables & Accessories Market Size, By Region, 2015�2022 (USD Million)
8.4.2 PVC Cables
8.4.2.1 PVC Cables: Submarine Low Voltage Cables & Accessories Market Size, By Region, 2015�2022 (USD Million)
8.4.3 Cable Joints
8.4.3.1 Cable Joints: Submarine Low Voltage Cables & Accessories Market Size, By Region, 2015�2022 (USD Million)
8.4.4 Terminations
8.4.4.1 Terminations: Submarine Low Voltage Cables & Accessories Market Size, By Region, 2015�2022 (USD Million)
8.4.5 Others
8.4.5.1 Others: Submarine Low Voltage Cables & Accessories Market Size, By Region, 2015�2022 (USD Million)
9 Low Voltage Cables & Accessories Market, By Region (Page No. - 88)
9.1 Introduction
9.2 North America
9.2.1 By End-User
9.2.2 By Installation
9.2.3 By Country
9.2.3.1 US
9.2.3.1.1 US: Low Voltage Cables & Accessories Market Size, By End-User, 2015�2022 (USD Million)
9.2.3.2 Canada
9.2.3.2.1 Canada: Low Voltage Cables & Accessories Market Size, By End-User, 2015�2022 (USD Million)
9.3 Europe
9.3.1 By End-User
9.3.2 By Installaton
9.3.3 By Country
9.3.3.1 Russia
9.3.3.1.1 Russia: Low Voltage Cables & Accessories Market Size, By End-User, 2015�2022 (USD Million)
9.3.3.2 UK
9.3.3.2.1 UK: Low Voltage Cables & Accessories Market Size, By End-User, 2015�2022 (USD Million)
9.3.3.3 Germany
9.3.3.3.1 Germany: Low Voltage Cables & Accessories Market Size, By End-User,2015�2022 (USD Million)
9.3.3.4 France
9.3.3.4.1 France: Low Voltage Cables & Accessories Market Size, By End-User, 2015�2022 (USD Million)
9.3.3.5 Norway
9.3.3.5.1 Norway: Low Voltage Cables & Accessories Market Size, By End-User, 2015�2022 (USD Million)
9.3.3.6 Rest of Europe
9.3.3.6.1 Rest of Europe: Low Voltage Cables & Accessories Market Size, By End-User, 2015�2022 (USD Million)
9.4 Asia Pacific
9.4.1 By End-User
9.4.2 By Installation
9.4.3 By Country
9.4.3.1 Australia
9.4.3.1.1 Australia: Low Voltage Cables & Accessories Market Size, By End-User, 2015�2022 (USD Million)
9.4.3.2 China
9.4.3.2.1 China: Low Voltage Cables & Accessories Market Size, By End-User, 2015�2022 (USD Million)
9.4.3.3 India
9.4.3.3.1 India: Low Voltage Cables & Accessories Market Size, By End-User, 2015�2022 (USD Million)
9.4.3.4 Japan
9.4.3.4.1 Japan: Low Voltage Cables & Accessories Market Size, By End-User, 2015�2022 (USD Million)
9.4.3.5 Rest of Asia Pacific
9.4.3.5.1 Rest of Asia Pacific: Low Voltage Cables & Accessories Market Size, By End-User, 2015�2022 (USD Million)
9.5 Latin America
9.5.1 By End-User
9.5.2 By Installation
9.5.3 By Country
9.5.3.1 Mexico
9.5.3.1.1 Mexico: Low Voltage Cables & Accessories Market Size, By End-User, 2015�2022 (USD Million)
9.5.3.2 Brazil
9.5.3.2.1 Brazil: Low Voltage Cables & Accessories Market Size, By End-User, 2015�2022 (USD Million)
9.5.3.3 Colombia
9.5.3.3.1 Colombia: Low Voltage Cables & Accessories Market Size, By End-User, 2015�2022 (USD Million)
9.5.3.4 Argentina
9.5.3.4.1 Argentina: Low Voltage Cables & Accessories Market Size, By End-User, 2015�2022 (USD Million)
9.5.3.5 Rest of Latin America
9.5.3.5.1 Rest of Latin America: Low Voltage Cables & Accessories Market Size, By End-User, 2015�2022 (USD Million)
9.6 Middle East & Africa
9.6.1 By End-User
9.6.2 By Installation
9.6.3 By Country
9.6.3.1 UAE
9.6.3.1.1 UAE: Low Voltage Cables & Accessories Market Size, By End-User, 2015�2022 (USD Million)
9.6.3.2 Saudi Arabia
9.6.3.2.1 Saudi Arabia: Low Voltage Cables & Accessories Market Size, By End-User, 2015�2022 (USD Million)
9.6.3.3 South Africa
9.6.3.3.1 South Africa: Low Voltage Cables & Accessories Market Size, By End-User, 2015�2022 (USD Million)
9.6.3.4 Egypt
9.6.3.4.1 Egypt: Low Voltage Cables & Accessories Market Size, By End-User, 2015�2022 (USD Million)
9.6.3.5 Rest of the Middle East & Africa
9.6.3.5.1 Rest of the Middle East & Africa: Low Voltage Cables & Accessories Market Size, By End-User, 2015�2022 (USD Million)
10 Competitive Landscape (Page No. - 128)
10.1 Introduction
10.2 Market Ranking Analysis
10.3 Competitive Scenario
10.3.1 Contracts & Agreements
10.3.2 Expansions & Investments
10.3.3 New Product Launches
10.3.4 Mergers & Acquisitions
10.3.5 Others
11 Company Profiles (Page No. - 135)
11.1 Prysmian
11.1.1 Business Overview
11.1.2 Products Offered
11.1.3 Recent Developments
11.1.4 SWOT Analysis
11.1.5 MnM View
11.2 Nexans
11.2.1 Business Overview
11.2.2 Products Offered
11.2.3 Recent Developments
11.2.4 SWOT Analysis
11.2.5 MnM View
11.3 NKT Cables
11.3.1 Business Overview
11.3.2 Products Offered
11.3.3 Recent Developments
11.3.4 SWOT Analysis
11.3.5 MnM View
11.4 General Cable
11.4.1 Business Overview
11.4.2 Products Offered
11.4.3 Recent Developments
11.4.4 SWOT Analysis
11.4.5 MnM View
11.5 Sumitomo
11.5.1 Business Overview
11.5.2 Products Offered
11.5.3 Recent Developments
11.5.4 SWOT Analysis
11.5.5 MnM View
11.6 ABB
11.6.1 Business Overview
11.6.2 Products Offered
11.6.3 Recent Developments
11.6.4 MnM View
11.7 Dubai Cable
11.7.1 Overview
11.7.2 Products Offered
11.7.3 Recent Developments
11.7.4 MnM View
11.8 LS Cable
11.8.1 Overview
11.8.2 Products Offered
11.8.3 Recent Developments
11.8.4 MnM View
11.9 Tele-Fonika
11.9.1 Overview
11.9.2 Products Offered
11.9.3 Recent Developments
11.9.4 MnM View
11.10 Southwire
11.10.1 Business Overview
11.10.2 Products Offered
11.10.3 Recent Developments
11.10.4 MnM View
11.11 Elsewedy
11.11.1 Business Overview
11.11.2 Products Offered
11.11.3 Recent Developments
11.11.4 MnM View
11.12 Furukawa
11.12.1 Business Overview
11.12.2 Products Offered
11.12.3 Recent Developments
11.12.4 MnM View
11.13 Kabelwerke
11.13.1 Business Overview
11.13.2 Products Offered
11.13.3 Recent Developments
11.13.4 MnM View
12 Appendix (Page No. - 197)
12.1 Insights of Industry Experts
12.2 Knowledge Store: Marketsandmarkets� Subscription Portal
12.3 Introducing RT: Real-Time Market Intelligence
12.4 Available Customizations
12.5 Related Reports
12.6 Author Details
List of Tables (135 Tables)
Table 1 Low Voltage Cables & Accessories Market Snapshot
Table 2 Asia Pacific Urbanization Prospects
Table 3 Cables & Accessories Market Size, By Voltage, 2015�2022 (USD Billion)
Table 4 Low Voltage: Cables & Accessories Market Size, By Region, 2015�2022 (USD Million)
Table 5 Medium Voltage: Cables & Accessories Market Size, By Region, 2015�2022 (USD Million)
Table 6 High Voltage: Cables & Accessories Market Size, By Region, 2015�2022 (USD Million)
Table 7 Low Voltage Cables & Accessories Market Size, By End-User, 2015�2022, (USD Billion)
Table 8 Industrial: Low Voltage Cables & Accessories Market Size, By Region, 2015�2022 (USD Million)
Table 9 Industrial: Low Voltage Cables & Accessories Market Size, By End-User, 2015�2022 (USD Million)
Table 10 Utilities: Low Voltage Cables & Accessories Market Size, By Region, 2015�2022 (USD Million)
Table 11 Oil & Gas: Low Voltage Cables & Accessories Market Size, By Region, 2015�2022 (USD Million)
Table 12 Mining & Metals: Low Voltage Cables & Accessories Market Size, By Region, 2015�2022 (USD Million)
Table 13 Chemicals & Petrochemicals: Low Voltage Cables & Accessories Market Size, By Region, 2015�2022 (USD Million)
Table 14 Others: Low Voltage Cables & Accessories Market Size, By Region, 2015�2022 (USD Million)
Table 15 Renewables: Low Voltage Cables & Accessories Market Size, By Region, 2015�2022 (USD Million)
Table 16 Renewables: Low Voltage Cables & Accessories Market Size, By End-User, 2015�2022 (USD Million)
Table 17 Wind Power: Low Voltage Cables & Accessories Market Size, By Region, 2015�2022 (USD Million)
Table 18 Solar Power: Low Voltage Cables & Accessories Market Size, By Region, 2015�2022 (USD Million)
Table 19 Infrastructure: Low Voltage Cables & Accessories Market Size, By Region, 2015�2022 (USD Million)
Table 20 Infrastructure: Low Voltage Cables & Accessories Market Size, By End-User, 2015�2022 (USD Million)
Table 21 Commercial & Residential: Low Voltage Cables & Accessories Market Size, By Region, 2015�2022 (USD Million)
Table 22 Transportation: Low Voltage Cables & Accessories Market Size, By Region, 2015�2022 (USD Million)
Table 23 Low Voltage Cables & Accessories Market Size, By Installation, 2015�2022, (USD Billion)
Table 24 Overhead Cables & Accessories Market Size, By Region, 2015�2022 (USD Million)
Table 25 Low Voltage Overhead Cables & Accessories Market Size, By Product, 2015�2022 (USD Million)
Table 26 Conductors & Cables: Overhead Low Voltage Cables & Accessories Market Size, By Region, 2015�2022
Table 27 Conductors & Cables: Overhead Low Voltage Cables & Accessories Market Size, By Type, 2015�2022
Table 28 Conductors: Overhead Low Voltage Cables & Accessories Market Size, By Region, 2015�2022
Table 29 XLPE Cables: Overhead Low Voltage Cables & Accessories Market Size, By Region, 2015�2022
Table 30 PVC Cables: Overhead Low Voltage Cables & Accessories Market Size, By Region, 2015�2022
Table 31 Accessories: Overhead Low Voltage Cables & Accessories Market Size, By Region, 2015�2022
Table 32 Accessories: Overhead Low Voltage Cables & Accessories Market Size, By Product, 2015�2022
Table 33 Cable Joints: Low Voltage Cables & Accessories Market Size, By Region, 2015�2022
Table 34 Cable Joints: Low Voltage Cables & Accessories Market Size, By Type, 2015�2022
Table 35 Resin Cable Joints: Low Voltage Cables & Accessories Market Size, By Region, 2015�2022
Table 36 Heat Shrink Cable Joints: Low Voltage Cables & Accessories Market Size, By Region, 2015�2022
Table 37 Cold Shrink Cable Joints: Low Voltage Cables & Accessories Market Size, By Region, 2015�2022
Table 38 Cable Terminations: Overhead Low Voltage Cables & Accessories Market Size, By Region, 2015�2022
Table 39 Connectors: Overhead Low Voltage Cables & Accessories Market Size, By Region, 2015�2022
Table 40 Clamps: Overhead Low Voltage Cables & Accessories Market Size, By Region, 2015�2022
Table 41 Others: Overhead Low Voltage Cables & Accessories Market Size, By Region, 2015�2022
Table 42 Underground: Low Voltage Cables & Accessories Market Size, By Region, 2015�2022 (USD Million)
Table 43 Underground: Low Voltage Cables & Accessories Market Size, By Product, 2015�2022 (USD Million)
Table 44 XLPE Cables: Underground Low Voltage Cables & Accessories Market Size, By Region, 2015�2022 (USD Million)
Table 45 PVC Cables: Underground Low Voltage Cables & Accessories Market Size, By Region, 2015�2022 (USD Million)
Table 46 Cable Joints: Underground Low Voltage Cables & Accessories Market Size, By Region, 2015�2022 (USD Million)
Table 47 Terminations: Underground Low Voltage Cables & Accessories Market Size, By Region, 2015�2022 (USD Million)
Table 48 Others: Underground Low Voltage Cables & Accessories Market Size, By Region, 2015�2022 (USD Million)
Table 49 Submarine: Low Voltage Cables & Accessories Market Size, By Region, 2015�2022 (USD Million)
Table 50 Submarine: Low Voltage Cables & Accessories Market Size, By Product, 2015�2022 (USD Million)
Table 51 XLPE Cables: Submarine Low Voltage Cables & Accessories Market Size, By Region, 2015�2022 (USD Million)
Table 52 PVC Cables: Submarine Low Voltage Cables & Accessories Market Size, By Region, 2015�2022 (USD Million)
Table 53 Cable Joints: Submarine Low Voltage Cables & Accessories Market Size, By Region, 2015�2022 (USD Million)
Table 54 Terminations: Submarine Low Voltage Cables & Accessories Market Size, By Region, 2015�2022 (USD Million)
Table 55 Others: Submarine Low Voltage Cables & Accessories Market Size, By Region, 2015�2022 (USD Million)
Table 56 Low Voltage Cables & Accessories Market Size, By Region, 2015�2022 (USD Billion)
Table 57 North America: Low Voltage Cables & Accessories Market Size, By End-User, 2015�2022 (USD Million)
Table 58 North America: Low Voltage Industrial End-User Cables & Accessories Market Size, By Sub End-User, 2015�2022 (USD Million)
Table 59 North America: Low Voltage Renewables End-User Cables & Accessories Market Size, By Sub End-User, 2015�2022 (USD Million)
Table 60 North America: Low Voltage Infrastructure End-User Cables & Accessories Market Size, By Sub End-User, 2015�2022 (USD Million)
Table 61 North America: Low Voltage Cables & Accessories Market Size, By Installation, 2015�2022 (USD Million)
Table 62 North America: Low Voltage Overhead Cables & Accessories Market Size, By Product, 2015�2022 (USD Million)
Table 63 North America: Low Voltage Overhead Cables & Accessories Market Size, for Conductors & Cables, By Type, 2015�2022 (USD Million)
Table 64 North America: Low Voltage Overhead Cables & Accessories Market Size, for Accessories, By Type, 2015�2022 (USD Million)
Table 65 North America: Low Voltage Underground Cables & Accessories Market Size, By Product, 2015�2022 (USD Million)
Table 66 North America: Low Voltage Cables & Accessories Market Size, By Country, 2015�2022 (USD Million)
Table 67 US: Low Voltage Cables & Accessories Market Size, By End-User, 2015�2022 (USD Million)
Table 68 Canada: Low Voltage Cables & Accessories Market Size, By End-User, 2015�2022 (USD Million)
Table 69 Europe: Low Voltage Cables & Accessories Market Size, By End-User, 2015�2022 (USD Million)
Table 70 Europe: Low Voltage Industrial End-User Cables & Accessories Market Size, By Sub End-User, 2015�2022 (USD Million)
Table 71 Europe: Low Voltage Renewables End-User Cables & Accessories Market Size, By Sub End-User, 2015�2022 (USD Million)
Table 72 Europe: Low Voltage Infrastructure Cables & Accessories Market Size, By Sub End-User, 2015�2022 (USD Million)
Table 73 Europe: Low Voltage Cables & Accessories Market Size, By Installation, 2015�2022 (USD Million)
Table 74 Europe: Low Voltage Overhead Cables & Accessories Market Size, By Product, 2015�2022 (USD Million)
Table 75 Europe: Low Voltage Overhead Cables & Accessories Market Size, for Conductors & Cables, By Type, 2015�2022 (USD Million)
Table 76 Europe: Low Voltage Overhead Cables & Accessories Market Size, for Accessories, By Type, 2015�2022 (USD Million)
Table 77 Europe: Low Voltage Underground Cables & Accessories Market Size, By Product, 2015�2022 (USD Million)
Table 78 Europe: Low Voltage Cables & Accessories Market Size, By Country, 2015�2022 (USD Million)
Table 79 Russia: Low Voltage Cables & Accessories Market Size, By End-User, 2015�2022 (USD Million)
Table 80 UK: Low Voltage Cables & Accessories Market Size, By End-User, 2015�2022 (USD Million)
Table 81 Germany: Low Voltage Cables & Accessories Market Size, By End-User, 2015�2022 (USD Million)
Table 82 France: Low Voltage Cables & Accessories Market Size, By End-User, 2015�2022 (USD Million)
Table 83 Norway: Low Voltage Cables & Accessories Market Size, By End-User, 2015�2022 (USD Million)
Table 84 Rest of Europe: Low Voltage Cables & Accessories Market Size, By End-User, 2015�2022 (USD Million)
Table 85 Asia Pacific: Low Voltage Cables & Accessories Market Size, By End-User, 2015�2022 (USD Million)
Table 86 Asia Pacific: Low Voltage Industrial End-User Cables & Accessories Market Size, By Sub End-User, 2015�2022 (USD Million)
Table 87 Asia Pacific: Low Voltage Renewables End-User Cables & Accessories Market Size, By Sub End-User, 2015�2022 (USD Million)
Table 88 Asia Pacific: Low Voltage Infrastructure Cables & Accessories Market Size, By Sub End-User, 2015�2022 (USD Million)
Table 89 Asia Pacific: Low Voltage Cables & Accessories Market Size, By Installation, 2015�2022 (USD Million)
Table 90 Asia Pacific: Low Voltage Overhead Cables & Accessories Market Size, By Product, 2015�2022 (USD Million)
Table 91 Asia Pacific: Low Voltage Overhead Cables & Accessories Market Size, for Conductors & Cables, By Type, 2015�2022 (USD Million)
Table 92 Asia Pacific: Low Voltage Overhead Cables & Accessories Market Size, for Accessories, By Type, 2015�2022 (USD Million)
Table 93 Asia Pacific: Low Voltage Underground Cables & Accessories Market Size, By Product, 2015�2022 (USD Million)
Table 94 Asia Pacific: Low Voltage Cables & Accessories Market, By Country, 2015�2022 (USD Million)
Table 95 Australia: Low Voltage Cables & Accessories Market Size, By End-User, 2015�2022 (USD Million)
Table 96 China: Low Voltage Cables & Accessories Market Size, By End-User, 2015�2022 (USD Million)
Table 97 India: Low Voltage Cables & Accessories Market Size, By End-User, 2015�2022 (USD Million)
Table 98 Japan: Low Voltage Cables & Accessories Market Size, By End-User, 2015�2022 (USD Million)
Table 99 Rest of Asia Pacific: Low Voltage Cables & Accessories Market Size, By End-User, 2015�2022 (USD Million)
Table 100 Latin America: Low Voltage Cables & Accessories Market Size, By End-User, 2015�2022 (USD Million)
Table 101 Latin America: Low Voltage Industrial End-User Cables & Accessories Market Size, By Sub End-User, 2015�2022 (USD Million)
Table 102 Latin America: Low Voltage Renewables End-User Cables & Accessories Market Size, By Sub End-User, 2015�2022 (USD Million)
Table 103 Latin America: Low Voltage Infrastructure End-User Cables & Accessories Market Size, By Sub End-User, 2015�2022 (USD Million)
Table 104 Latin America: Low Voltage Cables & Accessories Market Size, By Installation, 2015�2022 (USD Million)
Table 105 Latin America: Low Voltage Overhead Cables & Accessories Market Size, By Product, 2015�2022 (USD Million)
Table 106 Latin America: Low Voltage Overhead Cables & Accessories Market Size, for Conductors & Cables, By Type, 2015�2022 (USD Million)
Table 107 Latin America: Low Voltage Overhead Cables & Accessories Market Size, for Accessories, By Type, 2015�2022 (USD Million)
Table 108 Latin America: Low Voltage Underground Cables & Accessories Market Size, By Product, 2015�2022 (USD Million)
Table 109 Latin America: Low Voltage Cables & Accessories Market Size, By Country, 2015�2022 (USD Million)
Table 110 Mexico: Low Voltage Cables & Accessories Market Size, By End-User, 2015�2022 (USD Million)
Table 111 Brazil: Low Voltage Cables & Accessories Market Size, By End-User, 2015�2022 (USD Million)
Table 112 Colombia: Low Voltage Cables & Accessories Market Size, By End-User, 2015�2022 (USD Million)
Table 113 Argentina: Low Voltage Cables & Accessories Market Size, By End-User, 2015�2022 (USD Million)
Table 114 Rest of Latin America: Low Voltage Cables & Accessories Market Size, By End-User, 2015�2022 (USD Million)
Table 115 Middle East & Africa: Low Voltage Cables & Accessories Market Size, By End-User, 2015�2022 (USD Million)
Table 116 Middle East & Africa: Low Voltage Industrial End-User Cables & Accessories Market Size, By Sub End-User, 2015�2022 (USD Million)
Table 117 Middle East & Africa: Low Voltage Renewables End-User Cables & Accessories Market Size, By Sub End-User, 2015�2022 (USD Million)
Table 118 Middle East & Africa: Low Voltage Infrastructure Cables & Accessories Market Size, By Sub End-User, 2015�2022 (USD Million)
Table 119 Middle East & Africa: Low Voltage Cables & Accessories Market Size, By Installation, 2015�2022 (USD Million)
Table 120 Middle East & Africa: Low Voltage Overhead Cables & Accessories Market Size, By Product, 2015�2022 (USD Million)
Table 121 Middle East & Africa Low Voltage Overhead Cables & Accessories Market Size, for Conductors & Cables, By Type, 2015�2022 (USD Million)
Table 122 Middle East & Africa: Low Voltage Overhead Cables & Accessories Market Size, for Accessories, By Type, 2015�2022 (USD Million)
Table 123 Middle East & Africa: Low Voltage Underground Cables & Accessories Market Size, By Product, 2015�2022 (USD Million)
Table 124 Middle East & Africa: Low Voltage Cables & Accessories Market Size, By Country, 2015�2022 (USD Million)
Table 125 UAE: Low Voltage Cables & Accessories Market Size, By End-User, 2015�2022 (USD Million)
Table 126 Saudi Arabia: Low Voltage Cables & Accessories Market Size, By End-User, 2015�2022 (USD Million)
Table 127 South Africa: Low Voltage Cables & Accessories Market Size, By End-User, 2015�2022 (USD Million)
Table 128 Egypt: Low Voltage Cables & Accessories Market Size, By End-User, 2015�2022 (USD Million)
Table 129 Rest of the Middle East & Africa: Low Voltage Cables & Accessories Market Size, By End-User, 2015�2022 (USD Million)
Table 130 Market Developments Between 2013 and 2017
Table 131 Contracts & Agreements, 2013�2017
Table 132 Investments & Expansions, 2013�2017
Table 133 New Product Developments, 2014�2017
Table 134 Mergers & Acquisitions, 2013�2017
Table 135 Partnerships, Collaborations, Alliances, & Joint Ventures, 2016�2017
List of Figures (48 Figures)
Figure 1 Cables & Accessories Market, By Voltage
Figure 2 Low Voltage Cables & Accessories Market
Figure 3 Region-Wise Scope: Low Voltage Cables & Accessories Market
Figure 4 Research Design
Figure 5 Breakdown of Primary Interviews: By Company Type, Designation, & Region
Figure 6 Market Size Estimation Methodology: Bottom-Up Approach
Figure 7 Market Size Estimation Methodology: Top-Down Approach
Figure 8 Cables & Accessories Market: Market Estimation Approach & Data Triangulation Methodology
Figure 9 The Asia Pacific Market Dominated the Low Voltage Cables & Accessories Market in 2016
Figure 10 The Low Voltage Segment is Expected to Lead the Cables & Accessories Market, By Voltage Range, During the Forecast Period
Figure 11 The Overhead Segment is Expected to Lead the Low Voltage Cables & Accessories Market in 2017
Figure 12 The Infrastructure End-User Segment is Expected to Lead the Low Voltage Cables & Accessories Market
Figure 13 Government Initiatives to Expand Or Upgrade Distribution Networks are Expected to Drive the Low Voltage Cables & Accessories Market During the Forecast Period
Figure 14 The Chinese Market Held the Maximum Share of the Low Voltage Cables & Accessories Market in 2016
Figure 15 The US Market Held the Largest Share in 2016
Figure 16 The Low Voltage Range Segment is Projected to Dominate the Cables & Accessories Market During the Forecast Period
Figure 17 The Overhead Installation Segment is Expected to Lead the Low Voltage Cables & Accessories Market During the Forecast Period
Figure 18 The Infrastructure End-User Segment is Expected to Dominate the Low Voltage Cables & Accessories Market During the Forecast Period
Figure 19 Market Dynamics: Cables & Accessories Market
Figure 20 Renewable Energy Production, 2008�2020
Figure 21 Global Energy Consumption, 2012�2016
Figure 22 Copper Prices, 2013�2017
Figure 23 The Low Voltage Segment Held the Larger Share in 2016
Figure 24 The Infrastructure Segment is Expected to Dominate the Low Voltage Cables & Accessories Market During the Forecast Period
Figure 25 The Overhead Segment Dominated the Low Voltage Cables & Accessories Market in 2016
Figure 26 The Overhead Low Voltage Cables & Accessories Market in Asia Pacific is Expected to Grow at the Highest CAGR, From 2017 to 2022
Figure 27 The Conductors & Cables Segment Dominated the Overhead Low Voltage Cables & Accessories Market in 2016
Figure 28 The PVC Cables Segment Dominated the Underground Low Voltage Cables & Accessories Market in 2016
Figure 29 The PVC Cables Segment Dominated the Submarine Low Voltage Cables & Accessories Market in 2016
Figure 30 The Market in Asia Pacific is Expected to Grow at the Highest CAGR During the Forecast Period
Figure 31 Europe: Market Snapshot
Figure 32 Asia Pacific: Market Snapshot
Figure 33 Key Developments in the Cables & Accessories Market, 2013�2017
Figure 34 Market Rankings Based on Revenue, 2016
Figure 35 Prysmian: Company Snapshot
Figure 36 Prysmian: SWOT Analysis
Figure 37 Nexans: Company Snapshot
Figure 38 Nexans: SWOT Analysis
Figure 39 NKT Cables: Company Snapshot
Figure 40 NKT Cables: SWOT Analysis
Figure 41 General Cable: Company Snapshot
Figure 42 General Cables: SWOT Analysis
Figure 43 Sumitomo: Company Snapshot
Figure 44 Sumitomo: SWOT Analysis
Figure 45 ABB: Company Snapshot
Figure 46 Elsewedy: Company Snapshot
Figure 47 Furukawa: Company Snapshot
Figure 48 Kabelwerke: Company Snapshot


Growth opportunities and latent adjacency in Cables and Accessories Market