Artificial Photosynthesis Market by Application (Hydrocarbon, Hydrogen, Chemicals), Technology (Co-Electrolysis, Photo-Electro Catalysis, Nanotechnology, Hybrid Process), Region (North America, APAC, Europe, Rest of World) - Global Forecast to 2030
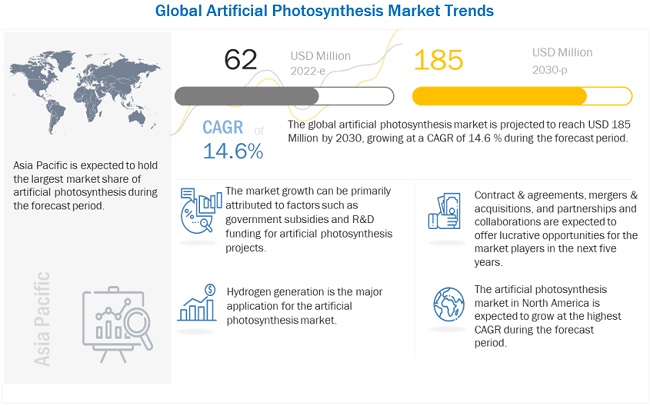
The artificial photosynthesis market size will grow to USD 185 million by 2030 from USD 62 million in 2022, at a CAGR of 14.6% during the forecast period. The global artificial photosynthesis market is driven by the government fundings and grants for the research and development of artificial photosynthesis technology; global plans for net zero emissions. Growing demand of green H2 and eco-friendly liquid fuels are expected to offer lucrative opportunities for the artificial photosynthesis market during the forecast period.

To know about the assumptions considered for the study, Request for Free Sample Report
Market Trends

Artificial photosynthesis Market Dynamics
Driver: Government fundings and increased R&D on Artificial Photosynthesis
Government fundings and grants for the research and development of artificial photosynthesis technology is among the important driving factors for the growth of the market. In 2020, the US Department of Energy (DOE) announced a plan to invest up to USD 100 million over five years in artificial photosynthesis research to produce fuels from sunlight. The Department's projected expenditure in the Fuels from Sunlight Hub program marks a long-term commitment of US scientific and technology resources to this aggressively competitive and promising field of study.
In Europe, Germany, Spain, and France are the prominent countries that are emphasizing the research activities of artificial Photosynthesis for various applications, including hydrogen generation, hydrocarbon generation. Several research institutes are collaborating with the OEMs to accelerate the research activities. In Germany, Evonik and Siemens Energy have begun a pilot plant using carbon dioxide and water to make chemicals, The project termed as Rheticus, is funded by the German Federal Ministry of Education and Research (BMBF) with a total of Euro 6.3 million. The pilot facility located in Marl, implements artificial photosynthesis technology to produce chemicals from CO2 and water through electrolysis with the help of bacteria. The project aims to close carbon cycle and reduce CO2 emission.
Restraint: High initial capital and research cost for the set-up
Artificial Photosynthesis is a complex process which integrates the hydrogen and carbon dioxide to obtain valuable fuels. Since the basic chemical process extremely challenging to replicate, to that of natural Photosynthesis, which uses abundant resources of sunlight, water, and carbon dioxide to produce oxygen and energy-rich carbohydrates. Although artificial leaves may be the fuel cells of the future, manufacturing costs remain a key concern. One of the most significant roadblocks to artificial Photosynthesis achieving high efficiency. During the research, the scientists have attempted to achieve higher operating efficiency, however, using expensive catalyst. Furthermore, the compatibility of the photocatalyst to achieve high efficiency rate, add-up to the research cost. Hence, the high initial capital and research cost for the set-up acts as a restraint to the artificial photosynthesis market
Opportunity: Growing demand of green H2 and eco-friendly liquid fuels
In the recent times, the demand for green hydrogen and clean fuel has witnessed progressive rise supplemented by the increasing fundings and grants. For instance, The President of the United States has pledged to develop green hydrogen that is less expensive than natural gas using renewable energy. The US Department of Energy (DOE) is investing up to USD 100 million on hydrogen and fuel cell research and development. To help accomplish the aims of its Green Deal, the European Union would invest USD 430 billion on green hydrogen by 2030. Furthermore, major economies such as, Chile, Japan, Germany, Saudi Arabia, and Australia are all investing heavily in green hydrogen. The preponderance of hydrogen now in use comes from a process known as steam methane reforming, which involves reacting methane and high-temperature steam with a catalyst to produce hydrogen, carbon monoxide, and a little amount of carbon dioxide. Carbon monoxide, steam, and a catalyst react in a later step to make additional hydrogen and carbon dioxide. Finally, contaminants and carbon dioxide are eliminated, leaving just pure hydrogen.
A research team from Liquid Sunlight Alliance (LiSA) and Berkeley Lab's Chemical Sciences Division in California, US, has developed a prototype of artificial photosynthesis device component that converts sunlight and carbon dioxide into two promising renewable fuels: ethylene and hydrogen. The findings also demonstrate the degradation phenomenon of the experimental set-up as well as suggest the preventive measures. The team also shed light on electrons and charge carriers known as "holes" contribute to photosynthetic degradation in artificial Photosynthesis.
Challenge: Need for optimized catalyst and stability of photoanode material
Sunlight is used in artificial Photosynthesis to produce high-value compounds from available resources. It is regarded as the most promising technology for producing sustainable fuels and chemicals. Recent research has resulted in effective light-absorbing semiconductors with high photoelectrochemical output, as well as effective catalysts for converting raw materials into a variety of products. These accomplishments demonstrate that artificial Photosynthesis is conceivable, although there are obstacles to overcome. Water splitting into H2 and O2 necessitates the use of integrated light gathering and catalytic conversion devices. The photoanode material's stability and performance must be increased. For the conversion of CO2 to products like CO, methane, or ethylene, optimised catalysts are required. Finding the correct transition metal catalyst for each desired reaction while balancing activity, selectivity, and stability can be difficult.
North America held the largest market share of global artificial photosynthesis market for the year 2021
North America is expected to dominate the global artificial photosynthesis market between 2022–2030 and is projected to grow at highest CAGR. The market growth in this region can be attributed to the supportives program and policies for sustainable innovation and development projects. Artificial photosynthesis being a R&D technology is best suited for these type of government incentives and policies.

To know about the assumptions considered for the study, download the pdf brochure
Key Market Players
The Major players who are actively carrying out research and development and moving slowly towards commercialization of the artificial photosynthesis market are Panasonic Corporation (Japan), and ENGIE (France), TOSHIBA CORPORATION (Japan), Siemens Energy (Germany), FUJITSU (Japan), Evonik Industries AG (Germany), FUJIFILM Corporation (Japan), Toyota Central R&D Labs., Inc.( Japan), Mitsubishi Chemical Corporation (Japan), Twelve (formerly known as, Opus 12)s (US) and etc.
Scope of the Report
|
Report Metric |
Details |
|
Market Size available for years |
2020–2030 |
|
Base year considered |
2021 |
|
Forecast period |
2022–2030 |
|
Forecast units |
Value (USD thousand) |
|
Segments covered |
Technology, Application, and Region |
|
Geographies covered |
Asia Pacific, North America, Europe, and RoW |
|
Companies covered |
The Major players who are actively carrying out research and development and moving slowly towards commercialization of artificial photosynthesis market are Panasonic Corporation (Japan), and ENGIE (France), TOSHIBA CORPORATION (Japan), Siemens Energy (Germany), FUJITSU (Japan), Evonik Industries AG (Germany), FUJIFILM Corporation (Japan), Toyota Central R&D Labs., Inc. (Japan), Mitsubishi Chemical Corporation (Japan), Twelve (formerly known as, Opus 12) (US) and etc |
This research report categorizes the artificial photosynthesis market based on Technology, Application, and Region.
Based on the technology:
- Co-electrolysis
- Photo-electro catalysis
- Others (nanotechnology, hybrid process)
Based on the application:
- Hydrocarbons
- Hydrogen
- Chemicals
Based on the region:
- North America
- Asia Pacific
- Europe
- Rest of the world
Recent Developments
- In July 2012, Panasonic corporation invested into development of an artificial photosynthesis system which converts carbon dioxide (CO2) to organic materials by illuminating with sunlight with an efficiency of 0.2%. The system generated Formic acid which is a important chemical in Hydrocarbon Industry
- In October 2016, FUJITSU and University of Tokyo collaborated for the testing of artificial Photosynthesis developed by FUJITSU. Crystal Interface laboratory of University of Tokyo (Japan) was the site for testing. FUJITSU is continuing to work on further advances in photocatalyst materials and process technology to improve the characteristics of photoreactive electrodes and is working on developing technologies for the dark-reaction part (CO2-reducing reactions) and the overall system, with the goal of implementing artificial photosynthesis technology
- In January 2020, ENGIE along with 8 partner institutes worked on a project named CONDOR. CONDOR is aimed at the production of fuels by using carbon dioxide (CO2) as feedstock and sunlight as the sole energy source. The project proposes a photosynthetic device made of two compartments a photoelectrochemical cell that splits water and CO2 and generates oxygen and syngas, a mixture of H2 and CO, and a (photo)reactor that converts syngas into methanol and dimethylether (DME), via bi-functional heterogeneous catalysts. The final target is a full photosynthetic device with 8% solar-to-syngas and 6% solar-to-DME efficiencies with three-months continuous outdoor operation
Frequently Asked Questions (FAQ):
What is the current market size of the artificial photosynthesis market?
The size of the global artificial Photosynthesis is USD 52 Million in 2021.
What are the major drivers for the artificial photosynthesis market?
The artificial Photosynthesis is driven by factors such as government fundings and grants for the research and development of artificial photosynthesis technology; global plans for net zero emissions.
Which region will hold the largest market share during the forecasted period in the artificial photosynthesis market?
Asia Pacific is projected to hold the largest market share during the forecast period. The region faces a tough challenge to reduce its carbon footprint from various fossil-fuel-powered operations, including power generation. Asia Pacific is one of the leading markets that has adopted green technologies to meet the targets set by the governments for reducing greenhouse gas emissions.
Which region will be the fastest-growing during the forecasted period in the artificial photosynthesis market?
North America is projected to be the fastest-growing region during the forecast period. The regional market is driven by the presence of supportive policies and incentives in the US for sustainable development projects. The rise in demand for uninterrupted power supply in the region will also boost the market growth during the forecast period.
Who are the leading players in the global artificial photosynthesis market?
Panasonic Corporation (Japan), FUJITSU (Japan), and ENGIE (France). .
To speak to our analyst for a discussion on the above findings, click Speak to Analyst

TABLE OF CONTENTS
1 INTRODUCTION (Page No. - 15)
1.1 STUDY OBJECTIVES
1.2 DEFINITION
1.2.1 ARTIFICIAL PHOTOSYNTHESIS MARKET: INCLUSIONS AND EXCLUSIONS
1.3 MARKET SCOPE
1.3.1 MARKET SEGMENTATION
1.3.2 REGIONS COVERED
1.3.3 YEARS CONSIDERED
1.4 CURRENCY
1.5 LIMITATIONS
1.6 STAKEHOLDERS
2 RESEARCH METHODOLOGY (Page No. - 19)
2.1 RESEARCH DATA
FIGURE 1 ARTIFICIAL PHOTOSYNTHESIS MARKET: RESEARCH DESIGN
2.2 MARKET BREAKDOWN AND DATA TRIANGULATION
FIGURE 2 DATA TRIANGULATION METHODOLOGY
2.2.1 SECONDARY DATA
2.2.1.1 Key data from secondary sources
2.2.2 PRIMARY DATA
2.2.2.1 Key data from primary sources
2.2.2.2 Breakdown of primaries
2.3 MARKET SIZE ESTIMATION
2.3.1 SUPPLY-SIDE ANALYSIS
2.3.1.1 Assumptions of supply-side analysis
2.3.1.2 Calculation of supply-side analysis
2.3.2 DEMAND-SIDE ANALYSIS
2.3.2.1 Assumptions for demand-side analysis
2.3.2.2 Limitation for demand-side analysis
2.3.2.3 Calculation of demand-side analysis
2.3.3 FORECAST
3 EXECUTIVE SUMMARY (Page No. - 25)
TABLE 1 ARTIFICIAL PHOTOSYNTHESIS MARKET SNAPSHOT
FIGURE 3 ASIA PACIFIC HELD LARGEST SHARE OF ARTIFICIAL PHOTOSYNTHESIS MARKET IN 2021
FIGURE 4 DURING 2018–2022, MOST-USED STRATEGY BY COMPANIES IN MARKET WAS COLLABORATIONS
4 PREMIUM INSIGHTS (Page No. - 27)
4.1 ATTRACTIVE OPPORTUNITIES IN ARTIFICIAL PHOTOSYNTHESIS MARKET
FIGURE 5 GROWING DEMAND FOR GREEN H2 AND ECO-FRIENDLY LIQUID FUELS TO BOOST MARKET GROWTH BETWEEN 2022 AND 2030
4.2 MARKET, BY REGION
FIGURE 6 MARKET IN NORTH AMERICA TO EXHIBIT HIGHEST CAGR DURING FORECAST PERIOD
5 MARKET OVERVIEW (Page No. - 29)
5.1 INTRODUCTION
5.2 MARKET DYNAMICS
FIGURE 7 MARKET: DRIVERS, RESTRAINTS, OPPORTUNITIES, AND CHALLENGES
FIGURE 8 ENERGY-RELATED CO2 EMISSIONS, 1990–2019 (GT CO2)
5.3 PATENT ANALYSIS
TABLE 2 ARTIFICIAL PHOTOSYNTHESIS: INNOVATIONS AND PATENT REGISTRATIONS, JUNE 2017–FEBRUARY 2022
5.4 CASE STUDY ANALYSIS
5.4.1 US AIR FORCE PLANS FOR TRANSITION TO SUSTAINABLE AVIATION FUEL
5.4.1.1 Problem statement
5.4.1.2 Solution
5.4.2 PROCTOR AND GAMBLE’S OATH FOR CARBON NEUTRALITY BY 2040
5.4.2.1 Problem statement
5.4.2.2 Solution
5.5 KEY CONFERENCES AND EVENTS IN 2022 & 2023
TABLE 3 ARTIFICIAL PHOTOSYNTHESIS: DETAILED LIST OF CONFERENCES & EVENTS
5.6 GOVERNMENT AGENCIES AND OTHER ORGANIZATIONS
TABLE 4 GOVERNMENT AGENCIES AND OTHER ORGANIZATIONS
5.7 TECHNOLOGICAL ANALYSIS
5.8 TRENDS/DISRUPTIONS IMPACTING VARIOUS PROBABLE END USERS
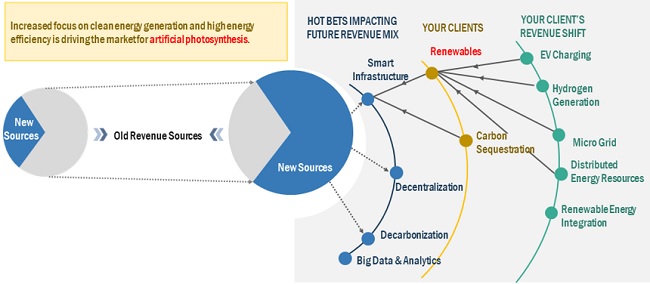
FIGURE 9 REVENUE SHIFT FOR ARTIFICIAL PHOTOSYNTHESIS PROVIDERS
5.9 ECOSYSTEM
TABLE 5 MARKET: ECOSYSTEM
5.10 INDICATIVE PRICING ANALYSIS
TABLE 6 AVERAGE PRICE OF TITANIUM DIOXIDE, BY REGION, QUARTER ENDING DECEMBER 2021
6 ARTIFICIAL PHOTOSYNTHESIS MARKET, BY APPLICATION (Page No. - 40)
6.1 INTRODUCTION
6.2 HYDROCARBONS
6.3 HYDROGEN
6.4 CHEMICALS
7 ARTIFICIAL PHOTOSYNTHESIS MARKET, BY TECHNOLOGY (Page No. - 43)
7.1 INTRODUCTION
7.2 PHOTO-ELECTRO CATALYSIS
7.3 CO-ELECTROLYSIS
7.4 OTHERS
7.4.1 NANOTECHNOLOGY
7.4.2 HYBRID PROCESS
8 GEOGRAPHICAL ANALYSIS (Page No. - 46)
8.1 INTRODUCTION
FIGURE 11 REGIONAL SNAPSHOT: MARKET IN NORTH AMERICA TO EXHIBIT HIGHEST CAGR DURING FORECAST PERIOD
FIGURE 12 MARKET SHARE (VALUE), BY REGION, 2021
TABLE 7 MARKET, BY REGION, 2020–2030 (USD THOUSAND)
8.2 NORTH AMERICA
FIGURE 13 NORTH AMERICA: REGIONAL SNAPSHOT
TABLE 8 ARTIFICIAL PHOTOSYNTHESIS PROJECTS IN NORTH AMERICA
8.2.1 BY COUNTRY
TABLE 9 MARKET IN NORTH AMERICA, BY COUNTRY, 2020–2030 (USD THOUSAND)
8.2.1.1 US
8.2.1.1.1 Growing demand for clean energy generation and emphasis on R&D of artificial photosynthesis technology
8.2.1.1.2 Macro factors
TABLE 10 US: HYDROGEN PRODUCTION CAPACITY AT REFINERIES, 2013–2017 (MILLION STANDARD CUBIC FEET PER DAY)
TABLE 11 US: GREENHOUSE GAS EMISSIONS, 2013–2017 (MILLION TONS OF CO2)
8.2.1.2 Canada
8.2.1.2.1 Increasing demand for green hydrogen is driving research activities for artificial photosynthesis
8.2.1.2.2 Macro factors
TABLE 12 CANADA: HYDROGEN PRODUCTION CAPACITY AT REFINERIES, 2013–2017 (MILLION STANDARD CUBIC FEET PER DAY)
TABLE 13 CANADA: GREENHOUSE GAS EMISSIONS, 2013–2017 (MILLION TONS OF CO2)
8.3 ASIA PACIFIC
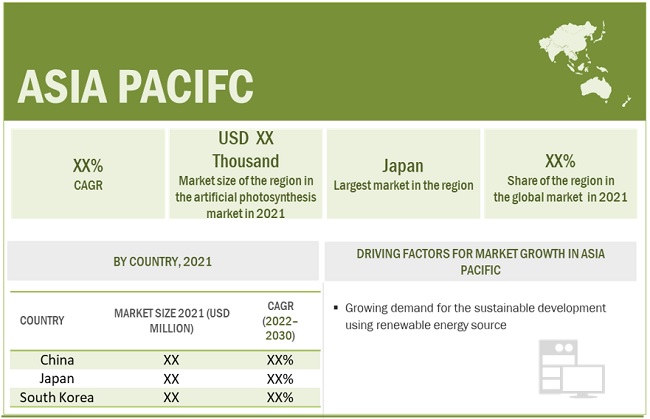
FIGURE 14 ASIA PACIFIC: REGIONAL SNAPSHOT
TABLE 14 ARTIFICIAL PHOTOSYNTHESIS PROJECTS IN ASIA PACIFIC
8.3.1 BY COUNTRY
TABLE 15 MARKET IN ASIA PACIFIC, BY COUNTRY, 2020–2030 (USD THOUSAND)
8.3.1.1 China
8.3.1.1.1 Growing research and development activities for sustainable hydrogen generation
8.3.1.1.2 Macro factors
TABLE 16 CHINA: HYDROGEN PRODUCTION CAPACITY AT REFINERIES, 2013–2017 (THOUSAND STANDARD CUBIC FEET PER DAY)
TABLE 17 CHINA: GREENHOUSE GAS EMISSIONS, 2013–2017 (THOUSAND TONS OF CO2)
8.3.1.2 Japan
8.3.1.2.1 Increasing funding by national R&D agency for establishing large-scale hydrogen supply chain
8.3.1.2.2 Macro factors
TABLE 18 JAPAN: HYDROGEN PRODUCTION CAPACITY AT REFINERIES, 2013–2017 (THOUSAND STANDARD CUBIC FEET PER DAY)
TABLE 19 JAPAN: GREENHOUSE GAS EMISSIONS, 2013–2017 (THOUSAND TONS OF CO2)
8.3.1.3 South Korea
8.3.1.3.1 Surging investments by government supporting hydrogen generation technologies
8.3.1.3.2 Macro factors
TABLE 20 SOUTH KOREA: HYDROGEN PRODUCTION CAPACITY AT REFINERIES, 2013–2017 (THOUSAND STANDARD CUBIC FEET PER DAY)
8.3.1.4 India
8.3.1.4.1 Rising focus of Government of India to increase share of renewables
8.3.1.4.2 Macro factors
TABLE 21 INDIA: HYDROGEN PRODUCTION CAPACITY AT REFINERIES, 2013–2017 (THOUSAND STANDARD CUBIC FEET PER DAY)
TABLE 22 INDIA: GREENHOUSE GAS EMISSIONS, 2013–2017 (THOUSAND TONS OF CO2)
8.4 EUROPE
TABLE 23 ARTIFICIAL PHOTOSYNTHESIS PROJECTS IN EUROPE
8.4.1 BY COUNTRY
TABLE 24 MARKET IN EUROPE, BY COUNTRY, 2020–2030 (USD THOUSAND)
8.4.1.1 Germany
8.4.1.1.1 Growing investments in R&D activities for artificial photosynthesis
8.4.1.1.2 Macro factors
TABLE 25 GERMANY: HYDROGEN PRODUCTION CAPACITY AT REFINERIES, 2013–2017 (THOUSAND STANDARD CUBIC FEET PER DAY)
TABLE 26 GERMANY: GREENHOUSE GAS EMISSIONS, 2013–2017 (THOUSAND TONS OF CO2)
8.4.1.2 France
8.4.1.2.1 Surging use of renewable energy sources for sustainable development
8.4.1.2.2 Macro factors
TABLE 27 FRANCE: HYDROGEN PRODUCTION CAPACITIES AT REFINERIES, 2013–2017 (MILLION STANDARD CUBIC FEET PER DAY)
TABLE 28 FRANCE: GREENHOUSE GAS EMISSIONS, 2013–2017 (MILLION TONS OF CO2)
8.4.1.3 Italy
8.4.1.3.1 Surging adoption of green technologies to curb carbon emission
8.4.1.3.2 Macro factors
TABLE 29 ITALY: HYDROGEN PRODUCTION CAPACITY AT REFINERIES, 2013–2017 (THOUSAND STANDARD CUBIC FEET PER DAY)
8.4.1.4 Spain
8.4.1.4.1 Rising expenditure on R&D activities on artificial photosynthesis
8.4.1.4.2 Macro factors
TABLE 30 SPAIN: HYDROGEN PRODUCTION CAPACITY AT REFINERIES, 2013–2017 (THOUSAND STANDARD CUBIC FEET PER DAY)
8.4.1.5 Rest of Europe
8.4.1.5.1 Macro factors
TABLE 31 REST OF EUROPE: HYDROGEN PRODUCTION CAPACITY AT REFINERIES, BY COUNTRY, 2013–2017 (THOUSAND STANDARD CUBIC FEET PER DAY)
8.5 REST OF THE WORLD
8.5.1 MACRO FACTORS
TABLE 32 REST OF WORLD: HYDROGEN PRODUCTION CAPACITY AT REFINERIES, BY COUNTRY, 2013–2017 (THOUSAND STANDARD CUBIC FEET PER DAY)
9 COMPETITIVE LANDSCAPE (Page No. - 62)
9.1 OVERVIEW
9.2 COMPETITIVE SCENARIO & TRENDS
TABLE 33 ARTIFICIAL PHOTOSYNTHESIS MARKET: DEALS, JANUARY 2016–FEBRUARY 2022
TABLE 34 MARKET: OTHERS JANUARY 2016-FEBRUARY 2022
9.3 RECENT MARKET DEVELOPMENTS
TABLE 35 KEY DEVELOPMENTS IN MARKET, JANUARY 2012–FEBRUARY 2022
9.4 INDUSTRY CONCENTRATION
9.5 COMPANY EVALUATION QUADRANT
9.5.1 STAR
9.5.2 PERVASIVE
9.5.3 EMERGING LEADER
9.5.4 PARTICIPANT
FIGURE 16 COMPETITIVE LEADERSHIP MAPPING: ARTIFICIAL PHOTOSYNTHESIS MARKET, 2020
TABLE 36 ARTIFICIAL PHOTOSYNTHESIS: COMPANY FOOTPRINT
TABLE 37 COMPETITIVE BENCHMARKING: DETAILED LIST OF KEY PLAYERS
9.6 COMPANY PRODUCT COVERAGE
TABLE 38 ARTIFICIAL PHOTOSYNTHESIS: COMPANY PRODUCT COVERAGE
10 COMPANY PROFILES (Page No. - 69)
(Business overview, Products offered, Recent Developments, MNM view)*
10.1 ORIGINAL EQUIPMENT MANUFACTURERS
10.1.1 ENGIE
TABLE 39 ENGIE: BUSINESS OVERVIEW
FIGURE 17 ENGIE: COMPANY SNAPSHOT 2020
TABLE 40 ENGIE: DEALS
10.1.2 PANASONIC CORPORATION
TABLE 41 PANASONIC CORPORATION: BUSINESS OVERVIEW
FIGURE 18 PANASONIC CORPORATION: COMPANY SNAPSHOT 2020
TABLE 42 PANASONIC CORPORATION: OTHERS
10.1.3 FUJITSU
TABLE 43 FUJITSU: BUSINESS OVERVIEW
FIGURE 19 FUJITSU: COMPANY SNAPSHOT 2020
TABLE 44 FUJITSU: DEALS
10.1.4 MITSUBISHI CHEMICAL CORPORATION
TABLE 45 MITSUBISHI CHEMICAL CORPORATION: BUSINESS OVERVIEW
TABLE 46 MITSUBISHI CHEMICAL CORPORATION: DEALS
10.1.5 TOSHIBA CORPORATION
TABLE 47 TOSHIBA CORPORATION: BUSINESS OVERVIEW
FIGURE 20 TOSHIBA CORPORATION: COMPANY SNAPSHOT 2020
TABLE 48 TOSHIBA CORPORATION: OTHERS
10.1.6 TOYOTA CENTRAL R&D LABS., INC.
TABLE 49 TOYOTA CENTRAL R&D LABS., INC.: BUSINESS OVERVIEW
TABLE 50 TOYOTA CENTRAL R&D LABS., INC.: OTHERS
10.1.7 SIEMENS ENERGY
TABLE 51 SIEMENS ENERGY: BUSINESS OVERVIEW
FIGURE 21 SIEMENS ENERGY: COMPANY SNAPSHOT 2020
TABLE 52 SIEMENS ENERGY: DEALS
10.1.8 FUJIFILM CORPORATION
TABLE 53 FUJIFILM CORPORATION: BUSINESS OVERVIEW
TABLE 54 FUJIFILM CORPORATION: DEALS
10.1.9 TWELVE (FORMERLY KNOWN AS, OPUS 12)
TABLE 55 TWELVE (FORMERLY KNOWN AS, OPUS 12): BUSINESS OVERVIEW
TABLE 56 TWELVE (FORMERLY KNOWN AS, OPUS 12): DEALS
10.1.10 EVONIK INDUSTRIES AG
TABLE 57 EVONIK INDUSTRIES AG: BUSINESS OVERVIEW
FIGURE 22 EVONIK INDUSTRIES AG: COMPANY SNAPSHOT 2020
TABLE 58 EVONIK INDUSTRIES AG: OTHERS
10.2 R&D INSTITUTES
10.2.1 BERKELEY LAB
TABLE 59 BERKELEY LAB: OVERVIEW
TABLE 60 BERKELEY LAB: DEALS
10.2.2 DEUTSCHE AKADEMIE DER NATURFORSCHER LEOPOLDINA
TABLE 61 DEUTSCHE AKADEMIE DER NATURFORSCHER LEOPOLDINA: OVERVIEW
TABLE 62 DEUTSCHE AKADEMIE DER NATURFORSCHER LEOPOLDINA: OTHERS
10.2.3 INDIAN INSTITUTE OF SCIENCE(IISC)
TABLE 63 INDIAN INSTITUTE OF SCIENCE (IISC): OVERVIEW
10.2.4 CENTER FOR HYBRID APPROACHES IN SOLAR ENERGY TO LIQUID FUELS (CHASE) 95
TABLE 64 CENTER FOR HYBRID APPROACHES IN SOLAR ENERGY TO LIQUID FUELS (CHASE): OVERVIEW
TABLE 65 CENTER FOR HYBRID APPROACHES IN SOLAR ENERGY TO LIQUID FUELS (CHASE): DEALS
10.2.5 ICIQ
TABLE 66 ICIQ: OVERVIEW
10.2.6 NEW ENERGY AND INDUSTRIAL TECHNOLOGY DEVELOPMENT ORGANIZATION
TABLE 67 NEW ENERGY AND INDUSTRIAL TECHNOLOGY DEVELOPMENT ORGANIZATION: OVERVIEW
TABLE 68 NEW ENERGY AND INDUSTRIAL TECHNOLOGY DEVELOPMENT ORGANIZATION: DEALS
10.2.7 UNIVERSITY OF TORONTO
10.2.8 THE UNIVERSITY OF PAU AND PAYS DE L’ADOUR
10.2.9 UNIVERSITY OF BOLOGNA
*Details on Business overview, Products offered, Recent Developments, MNM view might not be captured in case of unlisted companies.
11 APPENDIX (Page No. - 101)
11.1 INSIGHTS OF INDUSTRY EXPERTS
11.2 DISCUSSION GUIDE
11.3 KNOWLEDGE STORE: MARKETSANDMARKETS’ SUBSCRIPTION PORTAL
11.4 AVAILABLE CUSTOMIZATIONS
11.5 RELATED REPORTS
11.6 AUTHOR DETAILS
The study involved three major activities in estimating the current size of the global artificial photosynthesis market. Exhaustive secondary research was done to collect information on the market, the peer market, and the parent market. The next step was to validate these findings, assumptions, and market sizing with industry experts across the value chain through rigorous primary research. Both top-down and bottom-up approaches were used to estimate the total market size. The market breakdown and data triangulation techniques were employed to estimate the market size of the segments and the corresponding subsegments.
Secondary Research
This research study involved the use of extensive secondary sources, directories, and databases such as power generation, hydrogen generation, automotive, industry publications, several newspaper articles, Bloomberg, Factiva, and rental associations journal to identify and collect information useful for a technical, market-oriented, and commercial study of the artificial photosynthesis market. The other secondary sources included annual reports, press releases & investor presentations of companies, white papers, certified publications, articles by recognized authors, manufacturer associations, trade directories, and databases.
Primary Research
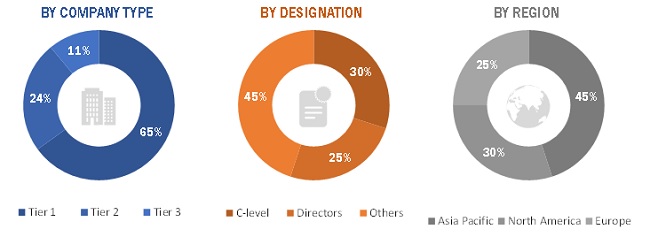
The artificial photosynthesis market comprises several stakeholders such as companies related to the industry, consulting companies in the power sector, power generation, hydrogen generation, automotive, government & research organizations, forums, alliances & associations, artificial photosynthesis service providers, state & national energy authorities, dealers & suppliers, and vendors. The breakdown of primary respondents is given below:

To know about the assumptions considered for the study, download the pdf brochure
Market Size Estimation
Both top-down and bottom-up approaches have been used to estimate and validate the size of the global artificial photosynthesis market and its dependent submarkets. These methods were also extensively used to estimate the size of various subsegments in the market. The research methodology used to estimate the market size includes the following:
- The key players in the industry and market have been identified through extensive secondary research, and their market shares in the respective regions have been determined through both primary and secondary research.
- All percentage shares, splits, and breakdowns have been determined using secondary sources and verified through primary sources.
Global Artificial photosynthesis Market Size: Bottom-Up Approach

To know about the assumptions considered for the study, Request for Free Sample Report
Data Triangulation
After arriving at the overall market size—using the market size estimation processes as explained above—the market was split into several segments and subsegments. To complete the entire market engineering process and arrive at the exact statistics of each market segment and subsegment, the data triangulation, and market breakdown procedures were employed, wherever applicable. The data was triangulated by studying various factors and trends from both the demand and supply sides in the artificial photosynthesis activities.
Report Objectives
- To define, describe and forecast the global artificial photosynthesis market by technology, application, and regions
- To provide detailed information regarding the major factors, such as drivers, restraints, opportunities, and industry-specific challenges, influencing the growth of the market
- To strategically analyze the market with respect to individual growth trends, future prospects, and the contribution of each segment to the market
- To strategically profile key players and comprehensively analyze their market shares and core competencies
- To track and analyze competitive developments such as contracts & agreements, expansions, mergers & acquisitions, and partnerships & collaborations in the artificial photosynthesis market
Available Customizations:
With the given market data, MarketsandMarkets offers customizations as per the client’s specific needs. The following customization options are available for this report:
Geographic Analysis
- Further breakdown of region or country-specific analysis
Company Information
- Detailed analyses and profiling of additional market players (up to 5)


 Generating Response ...


Growth opportunities and latent adjacency in Artificial Photosynthesis Market