
Solid Oxide Fuel Cell Market

Solid Oxide Fuel Cell Market by Type (Planar, Tubular), Component (Stack, Balance of Plant), Application (Stationary, Transport, Portable), End User (Commercial & Industrial, Data Center, Military & Defense, Residential) & Region - Global Forecast to 2030


OVERVIEW
Source: Secondary Research, Interviews with Experts, MarketsandMarkets Analysis
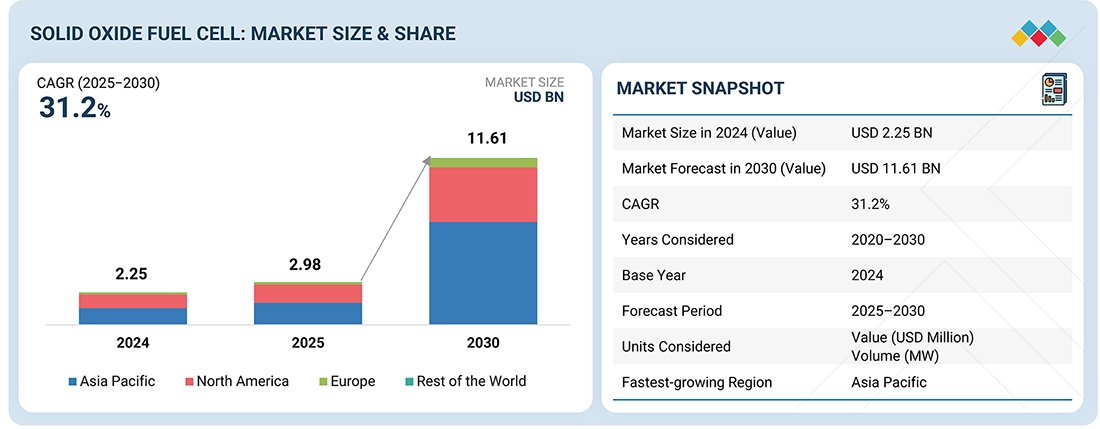
The solid oxide fuel cell market is projected to grow from USD 2.98 billion in 2025 to USD 11.61 billion by 2030, registering a robust CAGR of 31.2% during the forecast period. This significant growth is fueled by rising demand for high-efficiency and low-emission power systems across sectors such as commercial buildings, data centers, and industrial facilities. SOFCs are increasingly favored for their ability to deliver continuous, decentralized power, operate on multiple fuels, and support long-term carbon neutrality goals. The growing focus on grid resilience, coupled with advancements in hydrogen infrastructure, is boosting the deployment of SOFCs in both developed and emerging markets. These systems are particularly valued for their fuel flexibility, quiet operation, and ability to integrate into combined heat and power (CHP) configurations, offering higher overall energy efficiency.
KEY TAKEAWAYS
-
MARKET SNAPSHOT:Base Year Market Size (2024): USD 2.25 Billion
Current Market Size (2025): USD 2.98 Billion
Forecast Market Size (2030): USD 11.61 Billion
CAGR (2025–2030): 31.2% -
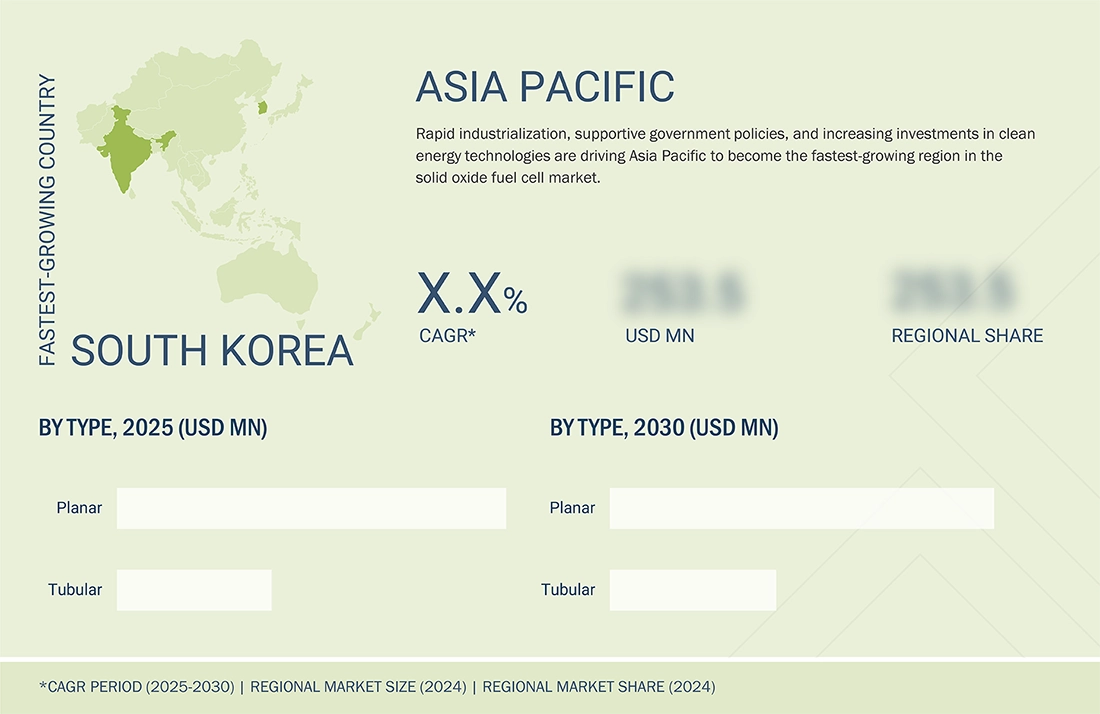
SEGMENT LEADERSHIPRegional Leader: The Asia Pacific region holds the largest market share in the Solid oxide fuel cell market.
Product Leader: Data centers are expected to emerge as the fastest-growing end-user segment in the stationary fuel cell market during the forecast period.
Application Leader: The stationary segment is expected to be the fastest-growing market during the forecast period.
Supply Type Leader:In the supply type segment, off-site hydrogen supply accounts for the dominant share as it allows fueling stations to source hydrogen produced at centralized plants and delivered via trucks or pipelines. This approach reduces the need for costly on-site production infrastructure, lowering initial capital requirements and enabling faster station deployment -
MARKET OUTLOOK & COMPETITIVE LANDSCAPEBloom energy, AISIN CORPORATION, and Panasonic Corporation have entered into a number of agreements and partnerships to cater to the growing demand for solid oxide fuel cell.
The solid oxide fuel cell (SOFC) market is primarily driven by the growing demand for efficient and clean energy solutions across residential, commercial, and industrial sectors. Increasing focus on decarbonization and energy security is encouraging the adoption of SOFCs for both stationary power generation and combined heat and power (CHP) applications. Supportive government initiatives, rising investments in distributed energy systems, and the ability of SOFCs to utilize various fuels such as hydrogen, natural gas, and biogas are further propelling market growth. Technological advancements are enhancing fuel cell durability and reducing costs, while collaborations between energy providers, system integrators, and OEMs are fostering large-scale commercialization of SOFC technology globally.
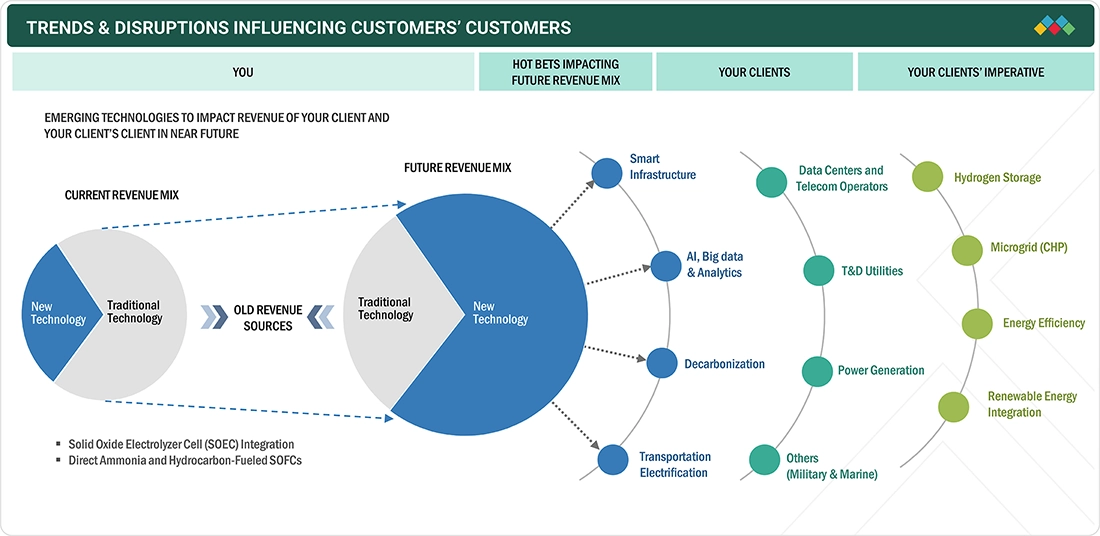
TRENDS & DISRUPTIONS IMPACTING CUSTOMERS' CUSTOMERS
The growing emphasis on high-efficiency, low-emission energy systems and strong government support for hydrogen and clean fuel infrastructure are expected to accelerate the Solid oxide fuel cell market. Additionally, SOFC manufacturers and their ecosystem partners are increasingly required to adopt innovations in system integration, localized hydrogen production, and thermal co-generation to stay competitive. The shift toward modular and distributed SOFC units is disrupting centralized generation models by enabling long-duration operation, fuel flexibility, and high combined heat and power (CHP) efficiency. These systems also support decarbonization in industrial, commercial, and institutional applications where reliability and energy cost optimization are critical. The Solid oxide fuel cell market is undergoing a strategic shift, driven by material science breakthroughs, fuel diversification strategies, and evolving carbon pricing mechanisms that make high-temperature fuel cells more viable across varied use cases
Source: Secondary Research, Interviews with Experts, MarketsandMarkets Analysis
MARKET DYNAMICS
Level
-
Government investments in fuel cell installation projects

-
Growing adoption of FCEVs across multiple transportation modes

Level
-
Competition from alternative clean energy technologies

Level
-
Rising demand for low-emission backup power solutions

Level
-
Rapid BEV infrastructure growth limits hydrogen station uptake in cities.

-
Competition from alternative clean energy technologies

Source: Secondary Research, Interviews with Experts, MarketsandMarkets Analysis
Driver: Government investments in fuel cell installation projects
A key factor driving the solid oxide fuel cell industry is government policies and incentives provided for fuel cell manufacturers. States such as California, Delaware, and Connecticut lead in fuel cell programs and offer installation incentives and subsidies, leading to the extensive adoption of SOFC. Clean energy tax incentives and other elements under the Inflation Reduction Act 2022 (IRA) would enhance domestic renewable energy output. The IRA’s sustainable energy incentives contain provisions for clean hydrogen and fuel cell technology, extending and creating federal tax credits. For example, in June 2025, the New York State Energy Research and Development Authority (NYSERDA) announced a USD 3.7 million investment to support clean hydrogen-based fuel cell resources in New York. This will advance developing and demonstrating innovative fuel cell technologies as a potential dispatchable solution to maintain grid reliability and resilience and decarbonize industrial processes while integrating increasing amounts of renewable energy like wind and solar
Restraint: Competition from alternative clean energy technologies
The SOFC market faces significant restraint from the growing competition posed by both alternative clean energy technologies and conventional power sources, particularly in large-scale and utility applications. For instance, utility-scale battery energy storage systems (BESS) installations reached over 68 GWh globally in 2023, according to BloombergNEF, offering rapid deployment, low maintenance, and grid integration advantages that SOFCs still struggle to match. PEMFC and direct methanol fuel cells (DMFC) are better suited for military applications, especially in portable and unmanned systems, as they operate at lower temperatures. Other technologies, such as molten carbonate fuel cells (MCFC) and phosphoric acid fuel cells (PAFC), compete with SOFC technology in the US, Japan, and South Korea. MCFC technology is in stiff competition with SOFC regarding installation cost per kilowatt and applications, such as combined heat and power (CHP) and power. Furthermore, solar PV installations alone added more than 360 GW globally in 2023, often paired with batteries, creating low-emission, dispatchable systems that can undercut SOFCs on levelized cost. These competing technologies benefit from larger manufacturing economies of scale, deeper policy support in many countries, and faster technological maturity, creating a challenging landscape for SOFC adoption, particularly in large and cost-sensitive applications.
Opportunity: Rising demand for low-emission backup power solutions
The growing demand for low-emission and highly reliable backup power solutions is creating strong growth opportunities for SOFCs in mission-critical sectors such as data centers and hospitals. These facilities require uninterrupted power to prevent data loss or life-threatening disruptions, and traditional diesel generators are increasingly being scrutinized for their emissions, noise, and fuel logistics. SOFCs offer a clean, quiet, and fuel-flexible alternative, with the ability to run on hydrogen, natural gas, or biogas while achieving electrical efficiencies of over 60%, and up to 85% in combined heat and power (CHP) configurations. According to Uptime Institute, over 90% of data centers now identify energy efficiency and sustainability as core strategic priorities, while the global healthcare sector is under pressure to decarbonize its operations in line with net-zero goals. The global data center industry consumed over 460 terawatt-hours (TWh) of electricity in 2022, and its carbon footprint is under growing scrutiny from governments and ESG-focused investors. Tech giants such as Microsoft and Google are targeting carbon-negative or 24/7 clean energy operations by 2030, creating a market for non-diesel, dispatchable backup solutions like SOFCs. The scalability, quiet operation, and grid-independent functionality of SOFCs make them an ideal solution for operators seeking both sustainability and resilience in backup power infrastructure.
Challenge: Lack of infrastructure for hydrogen production
Hydrogen is widely seen as a crucial solution for decarbonizing sectors like transportation and construction due to its versatility and zero-emission profile. However, its broader adoption faces several key challenges, especially in scaling up supporting infrastructure. Major obstacles include limited production capacity, underdeveloped storage and distribution systems, lack of standardized policies and regulations, and concerns about economic viability. According to Intelligent Energy, the current global capacity for low-carbon hydrogen is below 2 GW, while achieving net-zero targets will require producing approximately 150 million tonnes annually by 2030. The infrastructure needed for green hydrogen, in particular, is still in the early stages, with notable gaps in refueling stations, supply chains, and production facilities. For instance, the California Air Resources Board (CARB) recently reported a sharp decline in operational hydrogen fueling stations. Despite plans to establish 200 stations by 2025, only 62 remain operational after some Shell-operated sites closed and others faced disruptions. This slowdown raises concerns about the short-term growth and long-term viability of light-duty hydrogen vehicles within California's zero-emission transportation goals.
Solid Oxide Fuel Cell Market: COMMERCIAL USE CASES ACROSS INDUSTRIES
| COMPANY | USE CASE DESCRIPTION | BENEFITS |
|---|---|---|
 |
Walmart aimed to be fully powered by 100% renewable energy while keeping operational costs very low. However, it needed a clean energy solution that could provide reliable, continuous power—even during grid outages—and help lower energy costs, all while meeting strict sustainability and supplier evaluation standards. Traditional grid power was not only high in carbon emissions but also prone to interruptions, which threatened operational efficiency and product safety. Additionally, Walmart looked for a scalable solution that could be easily adopted across its widespread facilities without requiring major infrastructure upgrades. | To address this, Walmart installed Bloom Energy Servers—solid oxide fuel cells—at multiple stores and distribution centers, mainly powered by biogas. These on-site energy systems now provide up to 60–75% of their electricity, ensuring consistent, low-carbon, cost-effective power year-round, even during grid outages. This also supports their renewable energy goals, with over 40 Bloom installations currently at stores and distribution centers in California. The modular design of Bloom's system allowed for quick deployment and scalability across various locations. Additionally, the system's reliable performance and predictable costs have helped Walmart better plan and manage its energy needs. |
 |
Southern Linc—a subsidiary of Southern Company—was deploying over 1,300 new LTE Advanced cell sites to improve its critical communication network across the Southeast US. These sites needed reliable backup power to keep service running during storms, outages, and emergency grid repairs. However, many of the new locations lacked shelters or proper infrastructure, making it difficult and expensive to install traditional backup systems like diesel generators. Plus, diesel generators created operational issues, such as frequent refueling, high maintenance, noise, and emissions, which went against Southern Linc's goal of adopting a more modern, efficient, and eco-friendly solution. | To address these challenges, Southern Linc partnered with Plug Power to deploy about 500 GenSure hydrogen fuel cell backup systems in outdoor-rated cabinets. These systems combined fuel cell power, integrated DC systems, and LTE communications in a single, compact enclosure that requires up to 87% less site space than traditional diesel or battery solutions. Plug Power also supplied GenFuel hydrogen delivery services, allowing automatic, on-site fuel replenishment to remove the logistical burden of manual refueling. The solution achieved 99.6% uptime, cut annual O&M costs by 64%, needed far less maintenance than combustion-based generators, and lowered environmental impact through silent, zero-emission operation. The fuel cell systems also improved response capabilities during major weather events like Hurricane Irma, proving their resilience in real-world crisis situations. |
Logos and trademarks shown above are the property of their respective owners. Their use here is for informational and illustrative purposes only.
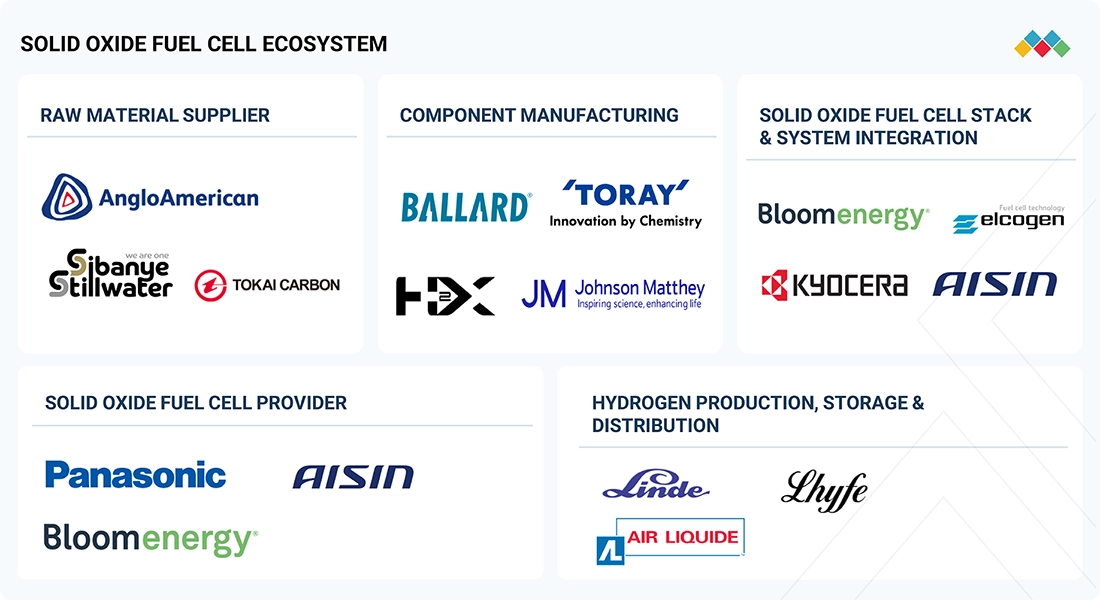
MARKET ECOSYSTEM
The solid oxide fuel cell (SOFC) ecosystem encompasses an integrated network comprising raw material suppliers, component manufacturers, system integrators, SOFC providers, and companies involved in hydrogen production, storage, and distribution. This structure embodies a highly collaborative value chain. Prominent entities such as Anglo American (UK), Sibanye Stillwater (South Africa), and Tokai Carbon (Japan) supply critical materials, thereby enabling sophisticated component manufacturing by firms like Johnson Matthey (UK) and Ballard Power Systems (Canada), which contribute specialized technologies essential for the operation of SOFCs. Leading SOFC providers, including Panasonic (Japan), Bloom Energy (US), and Aisin Corporation (Japan), propel commercialization and innovation, while the hydrogen sector—including Linde PLC (Ireland) and Air Liquide (France)—ensures a dependable fuel supply, supporting both market penetration and geographic expansion. This interconnected network fosters sectoral growth, accelerates technological advancements, and sustains a robust supply chain, which are vital for the progression of the SOFC market.
Logos and trademarks shown above are the property of their respective owners. Their use here is for informational and illustrative purposes only.
MARKET SEGMENTS
Source: Secondary Research, Interviews with Experts, MarketsandMarkets Analysis
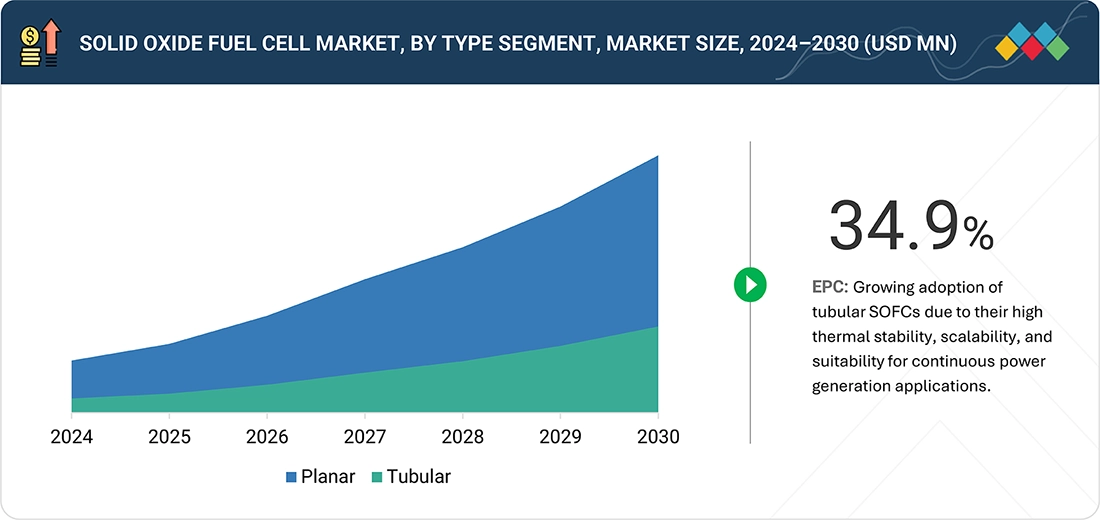
Solid oxide fuel cell market, by type
The planar solid oxide fuel cell (SOFC) segment is gaining popularity because of its high power density, compact design, and cost-effective manufacturing. These cells provide faster start-up times and efficient heat management, making them suitable for both stationary and portable power generation. Continuous improvements in ceramic materials and sealing technologies are boosting the performance and lifespan of planar SOFCs. Moreover, their compatibility with hydrogen and other alternative fuels supports the global move toward cleaner energy systems. As a result, the planar SOFC segment is seeing increased adoption in residential, commercial, and distributed energy applications worldwide.
Solid oxide fuel cell market, by component
The balance of plant (BoP) segment plays a vital role in the solid oxide fuel cell (SOFC) market by supporting the overall system’s functionality and performance. It includes essential components such as heat exchangers, pumps, blowers, compressors, and control systems that ensure efficient operation and integration of the fuel cell stack. Advancements in BoP component design are enhancing system reliability, thermal management, and fuel utilization efficiency. The increasing demand for compact and cost-effective BoP solutions is also driving innovation and standardization. As SOFC installations grow across stationary and distributed power applications, the BoP segment remains a key enabler of system efficiency and commercialization.
Solid oxide fuel cell market, by application
The stationary application segment dominates the solid oxide fuel cell (SOFC) market, driven by increasing demand for reliable and efficient on-site power generation. SOFC systems are being more widely used in commercial buildings, data centers, and industrial facilities to deliver continuous power with high efficiency and low emissions. Their capacity to operate on various fuels, including hydrogen and natural gas, improves energy security and grid independence. Technological advancements and decreasing system costs further promote adoption in distributed power generation and combined heat and power (CHP) systems. As global attention on decarbonization and sustainable energy grows, the stationary SOFC segment continues to experience strong growth and investment.
Solid oxide fuel cell market, by end user
The commercial and industrial end user segment accounts for a significant share of the solid oxide fuel cell (SOFC) market, driven by the demand for efficient, dependable, and low-emission power solutions. SOFC systems are increasingly adopted by manufacturing facilities, data centers, and large commercial buildings to ensure a continuous power supply and decrease reliance on the grid. Their capacity to deliver combined heat and power (CHP) improves overall energy efficiency and reduces operational costs. Additionally, the rising focus on sustainability and carbon reduction encourages industries to incorporate SOFC systems into their energy strategies. Ongoing advances in system scalability and fuel flexibility are further broadening their use across various industrial and commercial applications.
REGION
Asia Pacific is expected to witness the highest CAGR in global solid oxide fuel cell market during forecast period
Countries like Japan and South Korea are pioneering the adoption of SOFCs, especially in residential and commercial combined heat and power (CHP) systems. In Japan, the ENE-FARM program and a supportive national framework for fuel cell adoption in homes have driven widespread SOFC adoption. Additionally, there is a robust supply chain of key players in Asia Pacific that supports the scale-up of manufacturing and deployment of SOFC technology. Hydrogen is strongly supported as a future fuel source in Asia Pacific, making SOFCs even more attractive, as they can operate efficiently on hydrogen, natural gas, and biogas. Rising utility prices, grid stability concerns, and commitments to carbon reduction are prompting investments in SOFCs for residential energy, commercial backup power, and industrial applications. Due to existing policies, developed local capabilities, and increasing demand for cleaner energy technologies, the Asia Pacific region is leading SOFC development and is expected to maintain this position in the coming years.
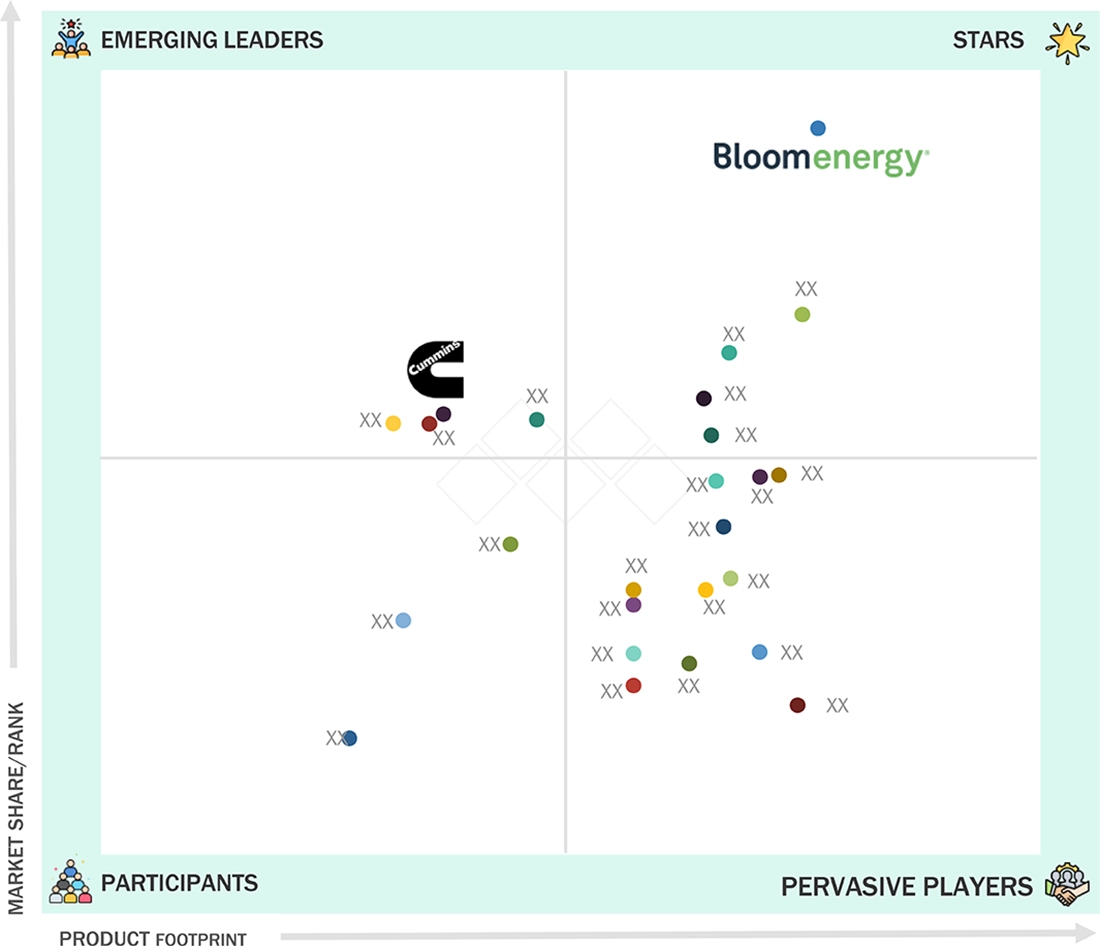
Solid Oxide Fuel Cell Market: COMPANY EVALUATION MATRIX
Bloom Energy (Market Leader) dominates the solid oxide fuel cell market, thanks to its advanced fuel cell technology, strong global presence, and proven commercial deployments. The company’s SOFC systems provide high electrical efficiency, fuel flexibility, and low emissions, making them suitable for both distributed power generation and grid support applications. Bloom Energy’s ongoing innovation in stack design and system integration has significantly lowered costs while improving reliability and scalability. Its strategic partnerships with major corporations and governments further strengthen its position, enabling large-scale adoption across commercial, industrial, and utility sectors worldwide.
Source: Secondary Research, Interviews with Experts, MarketsandMarkets Analysis
KEY MARKET PLAYERS
MARKET SCOPE
| REPORT METRIC | DETAILS |
|---|---|
| Market Size in 2024 (Value) | USD 2.25 Billion |
| Market Forecast in 2030 (Value) | USD 11.61 Billion |
| Growth Rate | CAGR of 31.2% from 2025-2030 |
| Years Considered | 2020-2030 |
| Base Year | 2024 |
| Forecast Period | 2030 |
| Units Considered | Value (USD Million/Billion) and Volume (MW) |
| Report Coverage | Revenue forecast, company ranking, competitive landscape, growth factors, and trends |
| Segments Covered |
|
| Regions Covered | North America, Asia Pacific, Europe, RoW |
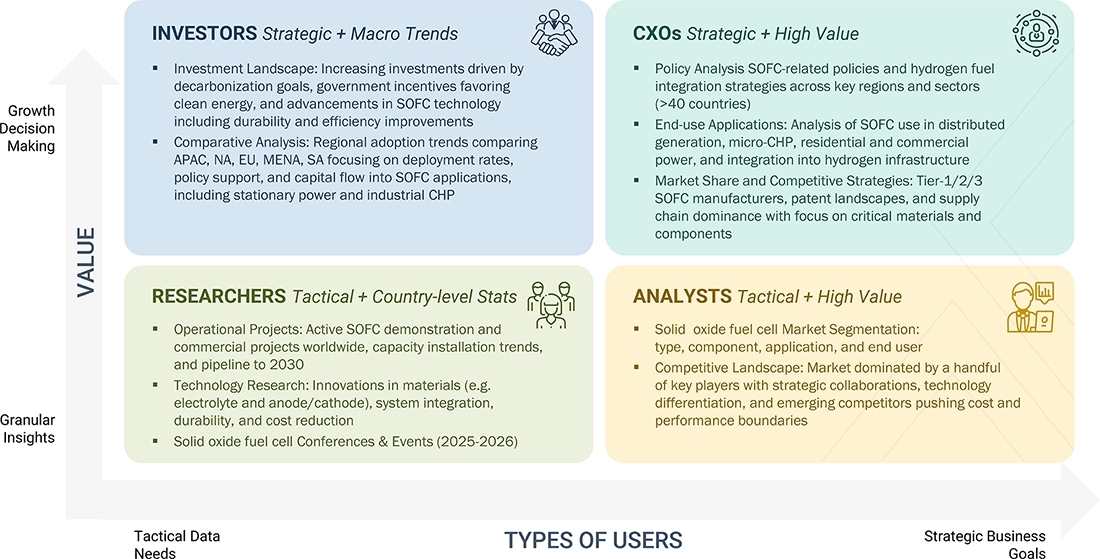
WHAT IS IN IT FOR YOU: Solid Oxide Fuel Cell Market REPORT CONTENT GUIDE
DELIVERED CUSTOMIZATIONS
We have successfully delivered the following deep-dive customizations:
| CLIENT REQUEST | CUSTOMIZATION DELIVERED | VALUE ADDS |
|---|---|---|
| US-based Stainless provide for SOFC |
|
|
RECENT DEVELOPMENTS
- April 2025 : Conagra Brands (US) and Bloom Energy (US) entered into a 15-year power purchase agreement (PPA) to deploy approximately 6 megawatts of Bloom's solid oxide fuel cell technology at Conagra's Troy and Archbold production facilities in Ohio. This agreement is expected to supply 70% to 75% of the electricity needs at these sites, reducing greenhouse gas emissions by approximately 19%.
- May 2025 : WATT Fuel Cell (US), in partnership with Essential Utilities (US), successfully installed the next-generation WATT HOME solid oxide fuel cell system in Peoples Natural Gas’s Western Pennsylvania service area. The installation represents a significant step forward in improving energy efficiency and reliability for residential customers.
- February 2025 : Bloom Energy (US) and Equinix (US) partnered to add over 100 megawatts of fuel cell capacity across 19 Equinix data centers in six US states. Beginning with a 1MW pilot in 2015, the partnership now includes 75MW operational and 30MW under construction, providing cleaner, on-site power to support the increasing energy needs of AI-driven computing. Bloom's fuel cells deliver reliable electricity with minimal environmental impact, strengthening Equinix's sustainability efforts and reducing dependence on traditional grid power.
- August 2024 : HD Hydrogen, a subsidiary of HD Korea Shipbuilding & Offshore Engineering (South Korea), invested 72 million euros to buy a controlling stake in Convion Oy, a leading Finnish fuel cell technology company. The partnership seeks to develop solid oxide fuel cell and electrolysis technologies, positioning HD Hydrogen as a leader in the global hydrogen fuel cell market.
- December 2023 : Convion (Finland), in partnership with Elcogen (Estonia), completed a 2000-hour test of a Solid Oxide electrolyzer featuring Elcogen’s cell technology. The system demonstrated exceptional performance, reaching over 85% electrical efficiency—equivalent to 39kWh per kilogram of green hydrogen produced—and outperformed competing PEM and alkaline technologies by 20-30%.
Table of Contents
 Exclusive indicates content/data unique to MarketsandMarkets and not available with any competitors.
Methodology
The study involved major activities in estimating the current size of the solid oxide fuel cell market. Exhaustive secondary research was done to collect information on the peer and parent markets. The next step was to validate these findings, assumptions, and sizing with industry experts across the value chain through primary research. The top-down and bottom-up approaches were employed to estimate the total market size. Thereafter, market breakdown and data triangulation techniques were used to estimate the market size of the segments and subsegments.
Secondary Research
This research study on the solid oxide fuel cell market involved the use of extensive secondary sources, directories, and databases, such as Hoover's, Bloomberg, Factiva, IRENA, International Energy Agency, and Statista Industry Journal, to collect and identify valuable information for a technical, market-oriented, and commercial study of the solid oxide fuel cell market. The other secondary sources included annual reports, press releases, and investor presentations of companies; white papers; certified publications; and articles by recognized authors, manufacturer associations, trade directories, and databases.
Primary Research
The LNG market comprises several stakeholders, such as engineering and design providers, equipment procurement providers, and transportation and logistics providers in the supply chain. The rising demand for onshore and floating LNG terminal types characterizes the demand side of this market. The supply side is characterized by prominent players' increasing focus on securing contracts from industrial players. Various primary sources from the supply and demand sides of the market were interviewed to obtain qualitative and quantitative information. The following is the breakdown of primary respondents.
In the complete market engineering process, the top-down and bottom-up approaches and several data triangulation methods were extensively used to perform the market size estimations and forecasts for all segments and subsegments listed in this report. Extensive qualitative and quantitative analyses were conducted to complete the market engineering process and list key information/insights throughout the report.

Note: The tiers of the companies are defined based on their total revenues as of 2024. Tier 1: > USD 1 billion, Tier 2:
From USD 500 million to USD 1 billion, and Tier 3: < USD 500 million. Others include sales managers, engineers, and regional managers.
To know about the assumptions considered for the study, download the pdf brochure
Market Size Estimation
The top-down and bottom-up approaches were used to estimate and validate the total size of the solid oxide fuel cell market. These methods were also used extensively to estimate the size of various subsegments in the market. The research methodology used to estimate the market size includes the following.
Solid Oxide Fuel Cell Market : Top-Down and Bottom-Up Approach

Data Triangulation
The total market was split into several segments and subsegments after arriving at the overall market size from the above estimation process. Data triangulation and market breakdown processes were employed to complete the overall market engineering process and arrive at the exact statistics for all the segments and subsegments, wherever applicable. The data was triangulated by studying various factors and trends from the demand and supply sides. In addition, the market size was validated using both the top-down and bottom-up approaches.
Market Definition
The solid oxide fuel cell market encompasses the global industry involved in planning, developing, constructing, operating, and commercializing liquefied natural gas (LNG) infrastructure used for import and export purposes. Solid oxide fuel cells are critical components of the LNG supply chain, enabling natural gas's efficient transportation and distribution by facilitating its liquefaction for shipment and regasification for end use. Export terminals convert natural gas into its liquid form for easier storage and transport, while import terminals revert LNG to its gaseous state for distribution into domestic pipelines and consumption markets.
Stakeholders
- Ceramic and electrolyte manufacturers
- Environmental research institutes
- Fuel cell and stack manufacturers
- Government and research organizations
- Institutional investors/shareholders
- Power and energy associations
- Repair and maintenance service providers
- SOFC technology manufacturing companies
- Organizations, forums, alliances, and associations
- Research and consulting companies
- State and national regulatory authorities
Report Objectives
- To define, describe, segment, and forecast the solid oxide fuel cell market based on type, component, application, and end user.
- To forecast the solid oxide fuel cell market, by region, in terms of volume.
- To describe and forecast the market size of various segments across four key regions—North America, Europe, Asia Pacific, and the Rest of the world.
- To provide detailed information regarding the drivers, restraints, opportunities, and challenges influencing the growth of the solid oxide fuel cell market.
- To strategically analyze the solid oxide fuel cell market with respect to individual growth trends, prospects, and contributions of each segment to the market.
- To analyze the supply chain, trends/disruptions impacting customer business, market/ecosystem, pricing trends, and regulatory landscape pertaining to solid oxide fuel cells.
- To analyze market opportunities for stakeholders and provide a detailed competitive landscape for market leaders.
- To benchmark players within the market using the company evaluation matrix, which analyzes market players based on several parameters within the broad categories of business and product strategies.
- To analyze the key market players with respect to their market share, product specifications, and applications.
- To strategically analyze the patents, Porter's five forces, trade values, key conferences, and case studies pertaining to the market under study.
- To strategically profile the key players and comprehensively analyze their market ranking and core competencies.
- To analyze competitive developments such as product developments, Sales contracts, agreements, investments, expansions, partnerships, and collaborations in the solid oxide fuel cell market.
Available Customizations
MarketsandMarkets offers customizations according to the specific needs of the companies using the given market data.
The following customization options are available for the report:
Product Analysis
- Product matrix, which gives a detailed comparison of the product portfolio of each company
Geographic Analysis as per Feasibility
- Further breakdown of the solid oxide fuel cell market, by country
Company Information
- Detailed analysis and profiling of additional market players (up to five)
Key Questions Addressed by the Report
What is the current size of the Solid Oxide Fuel Cell Market in 2025?
The current market size of the solid oxide fuel cell market is USD 2.98 billion in 2025.
What are the major drivers for the solid oxide fuel cell market?
Major solid oxide fuel cell market drivers include federal investments in fuel cell installation projects and reliance on renewable energy to ensure uninterrupted power supply in data centers.
Which is the largest market for the solid oxide fuel cell market during the forecasted period?
During the forecasted period, Asia Pacific is expected to be the largest market for Solid Oxide Fuel Cells, driven by strong government support, advanced hydrogen infrastructure, and rising demand for clean, reliable backup power across key industries.
Which segment, by type, is expected to be the largest segment in the solid oxide fuel cell market during the forecasted period?
By type, the planar segment is expected to be the largest market during the forecast period. This dominance is attributed to its compact design, high power density, and ease of integration into various stationary applications.
Which segment, by application, is expected to be the fastest-growing segment in the solid oxide fuel cell market during the forecasted period?
By application, the stationary segment is expected to be the fastest growing during the forecast period, which can be attributed to government support through incentives and growing emphasis on corporate sustainability targets.
Need a Tailored Report?
Customize this report to your needs
Get 10% FREE Customization
Customize This ReportPersonalize This Research
- Triangulate with your Own Data
- Get Data as per your Format and Definition
- Gain a Deeper Dive on a Specific Application, Geography, Customer or Competitor
- Any level of Personalization
Let Us Help You
- What are the Known and Unknown Adjacencies Impacting the Solid Oxide Fuel Cell Market
- What will your New Revenue Sources be?
- Who will be your Top Customer; what will make them switch?
- Defend your Market Share or Win Competitors
- Get a Scorecard for Target Partners

Custom Market Research Services
We Will Customise The Research For You, In Case The Report Listed Above Does Not Meet With Your Requirements
Get 10% Free CustomisationTESTIMONIALS

Kimberly Murphy
GLOBAL MARKETING DIRECTOR
Bently Nevada,
Leading Condition Monitoring & Asset Protectionwww.bakerhughesds.com/bently-nevada

MarketsandMarkets™ showed consistent rigor for success and relentlessly worked with Bently Nevada stakeholders to positively impact go-to-market strategy. Their proactiveness and flexibility has been instrumental in achieving the objectives to grow our sales pipeline in key industrial markets.

DARRICK HUEBER
Business Development Leader
Nexus Controls LLC,
Leading Manufacturer of Automation System & Electrical Panelswww.bakerhughesds.com/nexus-controls

We partnered with MarketsandMarkets to expand our business further by tapping into new industrial segments. It was critical for us to gather crucial business insights about specific markets to achieve this goal. MarketsandMarkets engagement model and client services helped us provide those insights, it was really impressive and valuable for my business. The team was extremely flexible and helpful.

Mike Schoff
Global Industrial Commercial Strategy Leader
Nexus Controls LLC
Leading Manufacturer of Automation System & Electrical Panelswww.bakerhughesds.com/nexus-controls
We consulted MarketsandMarkets for potential Partner Identification. Overall, it was a good experience. The insights provided through interviews conducted by the team helped us put together the questionnaire required for discussion with the selected partners. Their ability to provide insights through interviews with customers in a timely manner was quite impressive.
Growth opportunities and latent adjacency in Solid Oxide Fuel Cell Market


Noah
Jun, 2022
What are the key technological and market trends shaping the global solid oxide fuel cell market?.