Automotive Aluminum Market by Product Form (Cast Aluminum, Rolled Aluminum, & Extruded Aluminum), Application (Powertrain, Chassis & Suspension, & Car Body), Vehicle Type (Passenger Car, LCV, & HCV), Region - Global Forecast to 2026


The Automotive Aluminum Market is projected to grow USD 111.80 Billion by 2026, at a CAGR of 8.8% from 2016 to 2026.
The objectives of this study are:
- To define, describe, and forecast the automotive aluminum market on the basis of application, vehicle type, product form, and region
- To estimate and forecast the size of the automotive aluminum market, in terms of value (USD million) and volume (thousand metric tons)
- To provide the market share analysis of the major players in the automotive aluminum market
- To estimate and forecast the automotive aluminum market on the basis of product form, vehicle type, and application in key regions, namely, North America, Europe, Asia-Pacific, Middle East & Africa, and Latin America
- To identify and analyze the key drivers, restraints, threats, and opportunities influencing the automotive aluminum market
- To analyze region-specific trends in North America, Europe, Asia-Pacific, Middle East & Africa, and Latin America
- To strategically analyze micromarkets with respect to individual growth trends, future prospects, and contribution to the overall automotive aluminum market
- To strategically identify and profile key players in the automotive aluminum market and analyze their core competencies
- To track and analyze recent developments, such as new product launches, expansions, agreements, and acquisitions in the automotive aluminum market
The years considered for the study are:
- Base Year – 2015
- Estimated Year – 2016
- Projected Year – 2026
- Forecast Period – 2016 to 2026
- For company profiles in the report, 2015 has been considered as the base year. In certain cases, wherein information is unavailable for the base year, the years prior to it have been considered.
Research Methodology
This study aims to estimate the size of the automotive aluminum market for 2016 and project its demand till 2026. It also provides a detailed qualitative and quantitative analysis of the automotive aluminum market. Various secondary sources that include directories, industry journals, various associations, and databases have been used to identify and collect information useful for this extensive commercial study of the automotive aluminum market. Primary sources, such as experts from related industries and suppliers have been interviewed to obtain and verify critical information as well as to assess future prospects of the automotive aluminum market. Breakdown of profiles of primaries is shown in the figure below:
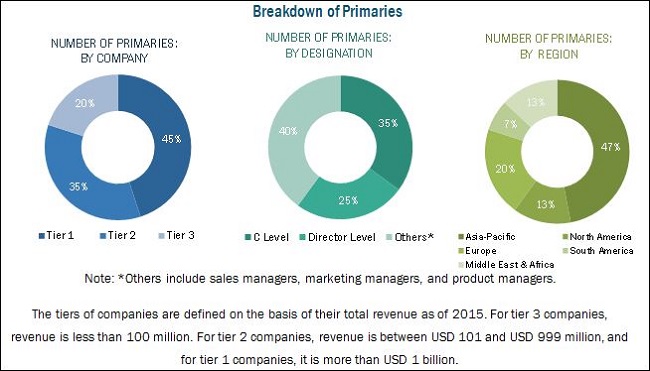
To know about the assumptions considered for the study, download the pdf brochure
Companies operating in the automotive aluminum market include Alcoa Inc./Arconic Inc. (U.S.), Novelis Inc. (U.S.), UACJ Corporation (Japan), Norsk Hydro ASA (Norway), AMG Advanced Metallurgical Group (Netherlands), Constellium N.V. (Netherlands), CHALCO (China), and Rio Tinto (U.K.), among others.
Key Target Audience
- Manufacturers of Automotive Aluminum
- Traders, Distributors, and Suppliers of Automotive Aluminum
- End-Use Industries Operating in the Supply Chain of Automotive Aluminum
- Government and Research Organizations
- Investment Banks and Private Equity Firms
Scope of the Automotive Aluminum Market Report: This research report categorizes the automotive aluminum market on the basis of product form, application, vehicle type, and region. It forecasts revenues as well as analyzes trends in each of the submarkets.
-
On the basis of Application:
- Powertrain
- Chassis & Suspension
- Car Body
-
On the basis of Product Form:
- Cast Aluminum
- Rolled Aluminum
- Extruded Aluminum
-
On the basis of Vehicle Type:
- Passenger Car
- LCV
- HCV
-
On the basis of Region:
- Asia-Pacific
- Europe
- North America
- Middle East & Africa
- Latin America
Available Customizations
By Application Analysis
- Further breakdown of the application segment into various subsegments, wherein automotive aluminum is used.
Country Analysis
- Value analysis of the consumption of automotive aluminum, in terms of capacity and type.
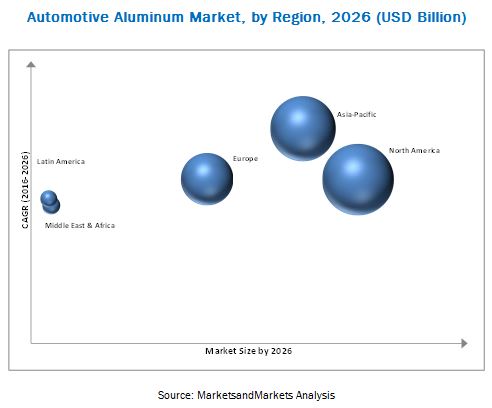
The automotive aluminum market is projected to grow from USD 47.91 Billion in 2016 to USD 111.80 Billion by 2026, at a CAGR of 8.8% from 2016 to 2026. Increased demand for lightweight and efficient materials from the automotive industry is fueling the demand for automotive aluminum as it not only reduces weight of automobile components, but also of the complete body of automobiles by up to 50%.
The powertrain application segment led the automotive aluminum market in 2016, in terms of value. The growth of the powertrain application segment of the automotive aluminum market can be attributed to increased use of aluminum in automotive manufacturing in the North American and Asia-Pacific regions.
Among product forms, the cast aluminum segment accounted for the largest share of the automotive aluminum market in 2016. The growth of this segment of the automotive aluminum market can be attributed to increasing demand for lightweight components made of cast aluminum for engines and powertrains that improve both, fuel efficiency as well as overall dynamics of vehicles.
The North American region accounted for the largest share of the automotive aluminum market in 2016. The growth of the North America automotive aluminum market can be attributed to implementation of Corporate Average Fuel Economy (CAFE) standards in the region, which mandate automobile companies to strive for fuel efficiency of 27.5 miles per gallon (mpg) for cars and 23.5 miles per gallon (mpg) for trucks by 2016 and 37.8 miles per gallon for cars (mpg) and 28.8 miles per gallon (mpg) for trucks within the next few years. Thus, automobile companies in the North American region prefer aluminum over steel as it helps to achieve improved aerodynamics and reduces weight of vehicles, thereby resulting in fuel savings.
The factor inhibiting the growth of the automotive aluminum market is higher manufacturing cost of aluminum as compared to steel. Key market players operating in the automotive aluminum market, such as Alcoa Inc./Arconic Inc. (U.S.), Novelis Inc. (U.S.), UACJ Corporation (Japan), Norsk Hydro ASA (Norway), AMG Advanced Metallurgical Group (Netherlands), Constellium N.V. (Netherlands), CHALCO (China), and Rio Tinto (U.K.), among others have adopted various strategies to increase their market shares and strengthen their position in the market. New product launches, expansions, acquisitions, and agreements are some of the key strategies adopted by market players to achieve growth in the automotive aluminum market.
Frequently Asked Questions (FAQ):
How big is the automotive aluminum market ?
Automotive Aluminum Market is projected to grow USD 111.80 Billion by 2026, at a CAGR of 8.8% from 2016 to 2026.
Who leading market players in automotive aluminum market?
Key market players operating in the automotive aluminum market, such as Alcoa Inc./Arconic Inc. (U.S.), Novelis Inc. (U.S.), UACJ Corporation (Japan), Norsk Hydro ASA (Norway), AMG Advanced Metallurgical Group (Netherlands), Constellium N.V. (Netherlands), CHALCO (China), and Rio Tinto (U.K.)
To speak to our analyst for a discussion on the above findings, click Speak to Analyst
 Exclusive indicates content/data unique to MarketsandMarkets and not available with any competitors.
Table of Contents
1 Introduction (Page No. - 15)
1.1 Objectives of the Study
1.2 Market Definition
1.3 Study Scope
1.3.1 Markets Covered
1.3.2 Years Considered for the Study
1.4 Currency Considered
1.5 Stakeholders
1.6 Limitations
2 Research Methodology (Page No. - 19)
2.1 Research Data
2.1.1 Secondary Data
2.1.1.1 Key Data From Secondary Sources
2.2 Primary Data
2.2.1 Key Data From Primary Sources
2.2.2 Key Industry Insights
2.2.3 Breakdown of Primary Interviews
2.3 Market Size Estimation
2.4 Market Breakdown and Data Triangulation
2.5 Research Assumptions
3 Executive Summary (Page No. - 27)
4 Premium Insights (Page No. - 32)
4.1 Attractive Opportunities in the Automotive Aluminum Market
4.2 Automotive Aluminum Market, By Product Form
4.3 Automotive Aluminum Market
4.4 Automotive Aluminum Market Growth
4.5 Automotive Aluminum Market, By Vehicle Type
4.6 Automotive Aluminum Market: Developing vs Developed Nations
5 Market Overview (Page No. - 37)
5.1 Introduction
5.2 Market Segmentation
5.3 Market Dynamics
5.3.1 Drivers
5.3.1.1 Growing Vehicle Production
5.3.1.2 Regulations for Fuel Efficiency and Emissions
5.3.1.3 Improved Driving Dynamics
5.3.2 Restraints
5.3.2.1 High Production Cost
5.3.3 Opportunities
5.3.3.1 Growing Market for Electric Vehicles
5.3.3.2 Integration of New Systems for Comfort and Safety
5.3.4 Challenges
5.3.4.1 Engineering Barriers
5.4 Cost Structure Analysis
6 Industry Trends (Page No. - 47)
6.1 Revenue Pocket Matrix
6.1.1 Revenue Pocket Matrix for Automotive Aluminum Market, By Product Form, 2015
6.1.2 Revenue Pocket Matrix for Automotive Aluminum Market, By Application, 2015
6.2 Economic Indicators
6.2.1 Impact of GDP on Total Vehicle Sales
6.2.2 Urbanization vs Passenger Cars Per 1000 People
7 Automotive Aluminum Market, By Product Form (Page No. - 52)
7.1 Introduction
7.2 Cast Aluminum
7.2.1 Die Casting
7.2.2 Permanent Mold Casting
7.2.3 Sand Casting
7.3 Rolled Aluminum
7.3.1 Aluminum Plate
7.3.2 Aluminum Sheet
7.3.3 Aluminum Foil
7.4 Extruded Aluminum
8 Automotive Aluminum Market, By Vehicle Type (Page No. - 59)
8.1 Introduction
8.2 Passenger Cars
8.3 Light Commercial Vehicles (LCV)
8.4 Heavy Commercial Vehicles (HCV)
9 Automotive Aluminum Market, By Application (Page No. - 68)
9.1 Introduction
9.2 Powertrain
9.2.1 Pistons
9.2.2 Engine Blocks
9.2.3 Fuel Systems
9.2.4 Heat Shields
9.2.5 Heat Exchangers
9.3 Chassis & Suspension
9.3.1 Suspension Parts
9.3.2 Wheels
9.3.3 Steering System
9.3.4 Break Systems
9.4 Car Body
9.4.1 Body Structure
9.4.2 Roof and Trim
9.4.3 Car Interiors
9.4.4 Hang-On Parts
10 Automotive Aluminum Market, By Region (Page No. - 76)
10.1 Introduction
10.2 North America
10.2.1 U.S.
10.2.2 Mexico
10.2.3 Canada
10.3 Asia-Pacific
10.3.1 China
10.3.2 Japan
10.3.3 India
10.3.4 South Korea
10.3.5 Rest of Asia-Pacific
10.4 Europe
10.4.1 Germany
10.4.2 Italy
10.4.3 Spain
10.4.4 France
10.4.5 U.K.
10.4.6 Switzerland
10.4.7 Russia
10.4.8 Rest of Europe
10.5 Middle East & Africa
10.5.1 Saudi Arabia
10.5.2 South Africa
10.5.3 Rest of Middle East & Africa
10.6 Latin America
10.6.1 Brazil
10.6.2 Argentina
10.6.3 Rest of Latin America
11 Competitive Landscape (Page No. - 112)
11.1 Overview
11.2 Automotive Aluminum Market: Company Share Analysis
11.3 Expansions
11.4 New Product Launches
11.5 Supply Contracts
11.6 Joint Ventures
11.7 Mergers & Acquisitions
11.8 Agreements
11.9 Partnerships
12 Company Profiles (Page No. - 120)
(Overview, Financial*, Products & Services, Strategy, and Developments)
12.1 Novelis, Inc.
12.2 Alcoa Inc. (Arconic Inc.)
12.3 Constellium N.V.
12.4 AMG Advanced Metallurgical Group
12.5 UACJ Corporation
12.6 Norsk Hydro ASA
12.7 RIO Tinto
12.8 Aluminum Corporation of China Limited
12.9 Aleris
12.10 Autoneum Holding AG
12.11 Federal-Mogul Holding Corporation
12.12 Dana Holding Corporation
12.13 Elringklinger AG
12.14 Progress-Werk Oberkirch AG
12.15 Thermotec Automotive Products
*Details Might Not Be Captured in Case of Unlisted Companies.
13 Appendix (Page No. - 156)
13.1 Discussion Guide
13.2 Knowledge Store: Marketsandmarkets Subscription Portal
13.3 Introducing RT: Real Time Market Intelligence
13.4 Available Customizations
13.5 Related Reports
13.6 Author Details
List of Tables (81 Tables)
Table 1 Snapshot
Table 2 By Product Form
Table 3 By Application
Table 4 By Vehicle Type
Table 5 By Region
Table 6 Overview of Emission and Fuel Economy Regulation Specifications for LCVs
Table 7 Automotive Aluminum: Cost Structure Analysis
Table 8 Vehicle Production, By Country, 2013-2015 (Units)
Table 9 By Product Form, 2014–2026 (Thousand Metric Tons)
Table 10 By Product Form, 2014–2026 (USD Billion)
Table 11 Cast By Region, 2014–2026 (Thousand Metric Tons)
Table 12 Cast By Region, 2014–2026 (USD Billion)
Table 13 Rolled, By Region, 2014–2026 (Thousand Metric Tons)
Table 14 Rolled, By Region, 2014–2026 (USD Billion)
Table 15 Extruded Automotive Aluminum Market, By Region, 2014–2026 (Thousand Metric Tons)
Table 16 Extruded Automotive Aluminum Market, By Region, 2014–2026 (USD Billion)
Table 17 Automotive Aluminum Market: By Vehicle Type, 2014-2026 (Thousand Metric Tons)
Table 18 Automotive Aluminum Market: By Vehicle Type, 2014-2026 (USD Billion)
Table 19 Market for Passenger Cars, By Region, 2014-2026 (Thousand Metric Tons)
Table 20 Automotive Aluminum Market for Passenger Cars, By Region, 2014-2026 (USD Billion)
Table 21 Market for LCVs, By Region, 2014-2026 (Thousand Metric Tons)
Table 22 Market for LCVs, By Region, 2014-2026 (USD Billion)
Table 23 Market for HCVs, By Region, 2014-2026 (Thousand Metric Tons)
Table 24 Market for HCVs, By Region, 2014-2026 (USD Billion)
Table 25 By Market, By Application, 2014–2026 (Thousand Metric Tons)
Table 26 By Market, By Application, 2014–2026 (USD Billion)
Table 27 Market for Powertrain, By Region, 2014–2026 (Thousand Metric Tons)
Table 28 Market for Powertrain, By Region, 2014–2026 (USD Billion)
Table 29 Market for Chassis & Suspension, By Region, 2014–2026 (Thousand Metric Tons)
Table 30 Market for Chassis & Suspension, By Region, 2014–2026 (USD Billion)
Table 31 Market for Car Body, By Region, 2014–2026 (Thousand Metric Tons)
Table 32 Market for Car Body, By Region, 2014–2026 (USD Billion)
Table 33 By Market, By Region, 2014–2026 (Thousand Metric Tons)
Table 34 By Market, By Region, 2014–2026 (USD Billion)
Table 35 North America Automotive Aluminum Market, By Country, 2014–2026 (Thousand Metric Tons)
Table 36 North America Market, By Country, 2014–2026 (USD Billion)
Table 37 North America Market, By Application, 2014–2026 (Thousand Metric Tons)
Table 38 North America Market, By Application, 2014–2026 (USD Billion)
Table 39 North America Market, By Vehicle Type, 2014–2026 (Thousand Metric Tons)
Table 40 North America Market, By Vehicle Type, 2014–2026 (USD Billion)
Table 41 North America Market, By Product Form, 2014–2026 (Thousand Metric Tons)
Table 42 North America Market, By Product Form, 2014–2026 (USD Billion)
Table 43 Asia-Pacific, By Country, 2014–2026 (Thousand Metric Tons)
Table 44 Asia-Pacific Market, By Country, 2014–2026 (USD Billion)
Table 45 Asia-Pacific Market, By Application, 2014–2026 (Thousand Metric Tons)
Table 46 Asia-Pacific Market, By Application, 2014–2026 (USD Billion)
Table 47 Asia-Pacific Market, By Vehicle Type, 2014–2026 (Thousand Metric Tons)
Table 48 Asia-Pacific Market, By Vehicle Type, 2014–2026 (USD Billion)
Table 49 Asia-Pacific Market, By Product Form, 2014–2026 (Thousand Metric Tons)
Table 50 Asia-Pacific Market, By Product Form, 2014–2026 (USD Billion)
Table 51 Europe, By Country, 2014–2026 (Thousand Metric Tons)
Table 52 Europe Market, By Country, 2014–2026 (USD Billion)
Table 53 Europe Market, By Application, 2014–2026 (Thousand Metric Tons)
Table 54 Europe Market, By Application, 2014–2026 (USD Billion)
Table 55 Europe Market, By Vehicle Type, 2014–2026 (Thousand Metric Tons)
Table 56 Europe Market, By Vehicle Type, 2014–2026 (USD Billion)
Table 57 Europe Market, By Product Form, 2014–2026 (Thousand Metric Tons)
Table 58 Europe Market, By Product Form, 2014–2026 (USD Billion)
Table 59 Middle East & Africa, By Country, 2014–2026 (Thousand Metric Tons)
Table 60 Middle East & Africa Market, By Country, 2014–2026 (USD Billion)
Table 61 Middle East & Africa Market, By Application, 2014–2026 (Thousand Metric Tons)
Table 62 Middle East & Africa Market, By Application, 2014–2026 (USD Billion)
Table 63 Middle East & Africa Market, By Vehicle Type, 2014–2026 (Thousand Metric Tons)
Table 64 Middle East & Africa Market, By Vehicle Type, 2014–2026 (USD Billion)
Table 65 Middle East & Africa Market, By Product Form, 2014–2026 (Thousand Metric Tons)
Table 66 Middle East & Africa Market, By Product Form, 2014–2026 (USD Billion)
Table 67 Latin America Automotive Aluminum Market, By Country, 2014–2026 (Thousand Metric Tons)
Table 68 Latin America Market, By Country, 2014–2026 (USD Billion)
Table 69 Latin America Market, By Application, 2014–2026 (Thousand Metric Tons)
Table 70 Latin America Market, By Application, 2014–2026 (USD Billion)
Table 71 Latin America Market, By Vehicle Type, 2014–2026 (Thousand Metric Tons)
Table 72 Latin America Market, By Vehicle Type, 2014–2026 (USD Billion)
Table 73 Latin America Market, By Product Form, 2014–2026 (Thousand Metric Tons)
Table 74 Latin America Market, By Product Form, 2014–2026 (USD Billion)
Table 75 Expansions, 2013-2015
Table 76 New Product Launches, 2014-2015
Table 77 Supply Contracts, 2014-2015
Table 78 Joint Ventures, 2012-2015
Table 79 Mergers & Acquisitions, 2013-2015
Table 80 Agreements, 2014-2015
Table 81 Partnerships, 2015
List of Figures (76 Figures)
Figure 1 Automotive Aluminum Market: Research Design
Figure 2 Breakdown of Primary Interviews, By Company, Designation, and Region
Figure 3 Market Size Estimation: Bottom-Up Approach
Figure 4 Market Size Estimation: Top-Down Approach
Figure 5 Powertrain Application Segment Projected to Lead the Automotive Aluminum Market Between 2016 and 2021
Figure 6 Rolled Aluminum Segment is Projected to Grow at the Highest CAGR Between 2016 and 2021
Figure 7 Automotive Aluminum Market, By Region, 2015
Figure 8 North America to Grow at the Highest CAGR Between 2016 and 2021
Figure 9 Increasing Use of Aluminum in Car Body Projected to Drive the Market During the Forecast Period
Figure 10 Rolled Aluminum Segment Projected to Grow at the Highest CAGR Between 2016 and 2021
Figure 11 Passenger Car Segment Accounted for the Largest Share of the Automotive Aluminum Market in 2015
Figure 12 Canada to Grow at the Highest CAGR Between 2016 and 2021
Figure 13 Passenger Car Segment Estimated to Account for the Largest Share of the Automotive Aluminum Market in 2016
Figure 14 Developing Nations to Grow at A Higher CAGR Between 2016 and 2021
Figure 15 Weight Reduction to Improve Vehicle Efficiency is A Major Driver for the Automotive Aluminum Market
Figure 16 Growing Vehicle Production, By Region
Figure 17 Europe: Increasing Average Weight of Passenger Cars vs CO2 Emissions
Figure 18 Automotive Aluminum: Cost Structure Analysis
Figure 19 Revenue Pocket Matrix: By Market, By Product Form, 2015
Figure 20 Revenue Pocket Matrix: By Market, By Application, 2015
Figure 21 Gross Domestic Product (GDP) vs Total Vehicle Sales
Figure 22 Urbanization vs Passenger Cars Per 1000 People
Figure 23 By Product Form, 2016 & 2021 (USD Billion)
Figure 24 Passenger Car Segment Estimated to Hold the Largest Share
Figure 25 Passenger Cars: North America Estimated to Be the Dominant Market During the Forecast Period
Figure 26 Market for LCV: North America Estimated to Be the Dominant Market During the Forecast Period
Figure 27 Market for HCV: North America Estimated to Dominate the Market During the Forecast Period
Figure 28 By Market, By Application, 2016 & 2021 (USD Million)
Figure 29 By Market: Regional Snapshot (2016-2021)
Figure 30 North America Automotive Aluminum Market Snapshot
Figure 31 U.S. Market, 2016 & 2021 (USD Billion)
Figure 32 Mexico Market, 2016 & 2021 (USD Billion)
Figure 33 Canada Market, 2016 & 2021 (USD Billion)
Figure 34 Asia-Pacific Market Snapshot
Figure 35 China Market, 2016 & 2021 (USD Billion)
Figure 36 Japan Market, 2016 & 2021 (USD Billion)
Figure 37 India Market, 2016 & 2021 (USD Billion)
Figure 38 South Korea Market, 2016 & 2021 (USD Billion)
Figure 39 Rest of Asia-Pacific Market, 2016 & 2021 (USD Billion)
Figure 40 Europe Market Snapshot
Figure 41 Germany Market, 2016 & 2021 (USD Billion)
Figure 42 Italy Market, 2016 & 2021 (USD Billion)
Figure 43 Spain Market, 2016 & 2021 (USD Billion)
Figure 44 France Market, 2016 & 2021 (USD Billion)
Figure 45 U.K. Market, 2016 & 2021 (USD Billion)
Figure 46 Switzerland Market, 2016 & 2021 (USD Billion)
Figure 47 Russia Market, 2016 & 2021 (USD Billion)
Figure 48 Rest of Europe minum Market, 2016 & 2021 (USD Billion)
Figure 49 Saudi Arabia Market, 2016 & 2021 (USD Billion)
Figure 50 South Africa Market, 2016 & 2021 (USD Billion)
Figure 51 Rest of Middle East & Africa Market, 2016 & 2021 (USD Billion)
Figure 52 Brazil Market, 2016 & 2021 (USD Billion)
Figure 53 Argentina Market, 2016 & 2021 (USD Billion)
Figure 54 Rest of Latin America Market, 2016 & 2021 (USD Billion)
Figure 55 Company Share Analysis, 2015 (%)
Figure 56 Expansion Was the Key Growth Strategy Adopted By the Companies
Figure 57 Novelis, Inc.: Company Snapshot
Figure 58 Novelis, Inc.: SWOT Analysis
Figure 59 Alcoa Inc.: Company Snapshot
Figure 60 Alcoa Inc.: SWOT Analysis
Figure 61 Constellium N.V.: Company Snapshot
Figure 62 AMG Advanced Metallurgical Group: Company Snapshot
Figure 63 UACJ Corporation: Company Snapshot
Figure 64 Norsk Hydro ASA: Company Snapshot
Figure 65 Norsk Hydro ASA: SWOT Analysis
Figure 66 RIO Tinto: Company Snapshot
Figure 67 Aluminum Corporation of China Limited: Company Snapshot
Figure 68 Autoneum Holding AG: Company Snapshot
Figure 69 Autoneum Holdings AG: SWOT Analysis
Figure 70 Federal Mogul Holding Corporation: Company Snapshot
Figure 71 Federal Mogul Holding Corporation: SWOT Analysis
Figure 72 Dana Holding Corporation: Company Snapshot
Figure 73 Dana Holding Corporation: SWOT Analysis
Figure 74 Elringklinger AG: Company Snapshot
Figure 75 Elringklinger AG: SWOT Analysis
Figure 76 Progress-Werk Oberkirch AG: Company Snapshot


Growth opportunities and latent adjacency in Automotive Aluminum Market