
Automotive Heat Shield Market Size, Share & Analysis

Automotive Heat Shield Market by Application (Engine, Exhaust, Under-bonnet, Under-chassis, Turbocharger), Product (Single-shell, Double-shell, Sandwich), Function (Acoustic, Non-acoustic), Material, Vehicle Type, EV Type, and Region - Global Forecast to 2032


OVERVIEW
Source: Secondary Research, Interviews with Experts, MarketsandMarkets Analysis
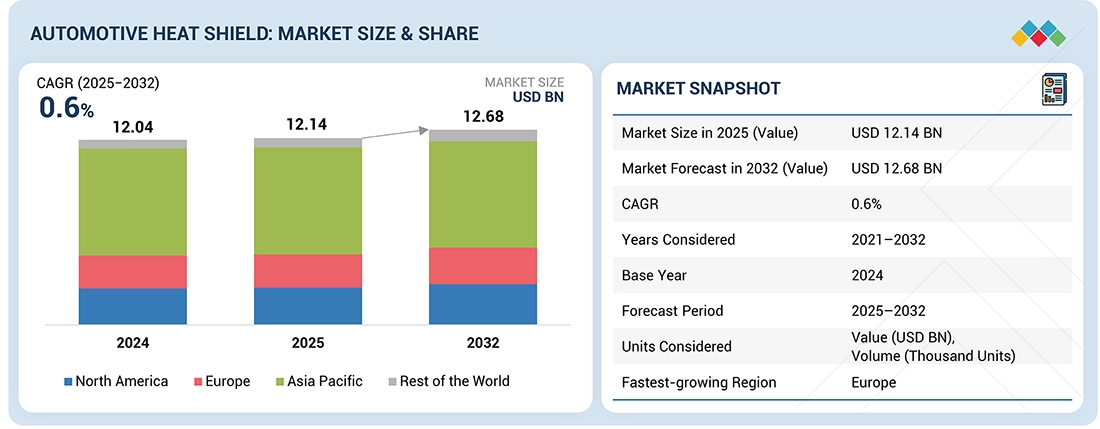
The automotive heat shield market is projected to grow from USD 12.14 billion in 2025 to USD 12.68 billion by 2032 at a CAGR of 0.6%. As automakers focus on enhancing engine efficiency and preventing heat-related damage such as component degradation, wiring and insulation damage, and fuel system risks, heat shields have become essential in both ICE and EVs. The automotive heat shield market is growing at fastest rate in Europe region due to the surge in electrified powertrains (EVs, hybrids) and turbocharged engines, both of which heighten the need for advanced thermal management to protect batteries, electronics, and power-dense engines from excess heat and to comply with ever-tougher emissions and efficiency regulations. Alternatively, higher cost and complexity of advanced multilayer or composite heat shields, as well as integration hurdles with new vehicle platforms and tight spaces in EV architectures, are the challenges still faced by the industry.
Automotive Heat Shield Market Size and Forecast:
- Market Size Value in 2025: USD 12.14 Billion
- Revenue Forecast in 2032: USD 12.68 Billion
- Growth Rate: CAGR of 0.6% from 2025 to 2032
- Data available from 2021 to 2032
- Base year: 2024
- Forecast period: 2025–2032
- Largest Growing Region: Europe
- Units Considered: Value (USD Billion), Volume (Units)
Key Market Trends and Insights
- Market Growth: The automotive heat shield market growth is driven by increasing vehicle electrification, demand for advanced thermal management, and rising adoption of turbocharged engines.
-
IoT Impact: IoT-enabled thermal monitoring systems improve heat management, component protection, and predictive maintenance capabilities.
- Growing Trends: The automotive heat shield market is witnessing increased adoption of lightweight materials, multilayer insulation, and EV-specific heat shielding solutions.
- Growth Opportunities: The automotive heat shield market opportunities are driven by advanced thermal protection solutions for EV batteries, power electronics, and autonomous vehicle systems.
KEY TAKEAWAYS
-
By ProductThe automotive heat shield market by product type is segmented into single-shell, double-shell, and sandwich-type heat shields. Among these, the double-shell heat shield is projected to hold the largest share of the market, mainly because of its excellent thermal protection in high-temperature areas like under the hood and turbocharger applications. These heat shields are made with two metal layers, providing better insulation and durability. The increasing demand for fuel-efficient vehicles, the growing use of lightweight materials, and stricter emissions regulations are the main factors driving the demand for double-shell heat shields.
-
BY ApplicationThe market has been divided into exhaust system heat shields, engine compartment heat shields, under-bonnet heat shields, under-chassis heat shields, and turbocharger heat shields. Of all the functions of heat shields examined in the study, the turbocharger heat shield segment is expected to grow the fastest due to the increasing adoption of turbocharged engines in passenger and commercial vehicles. Designed for high thermal resistance, flexibility, and durability under extreme conditions, these shields often use materials like stainless steel, silicone, and fiberglass. Their main purpose is to improve heat retention and lower under-hood temperatures, which significantly enhances turbo efficiency and engine performance, making them an important solution for protecting expensive engine parts.
-
BY FunctionThe market is divided by function into acoustic and non-acoustic heat shields. The acoustic heat shield is expected to be the largest segment in this market because it provides both thermal insulation and noise reduction. Europe is the fastest-growing region in this segment as modern vehicles increasingly prioritize passenger comfort and regulatory compliance, with manufacturers adding acoustic heat shields to reduce engine and exhaust noise while efficiently managing heat dissipation.
-
BY Material TypeThe market has been categorized based on material type into metallic and non-metallic segments. The metallic heat shields segment is estimated to account for the largest share in the market, primarily due to increasing vehicle production, stringent emission regulations, and rising demand for improved thermal management in high-temperature areas such as exhaust systems, engine compartments, and under the chassis.
-
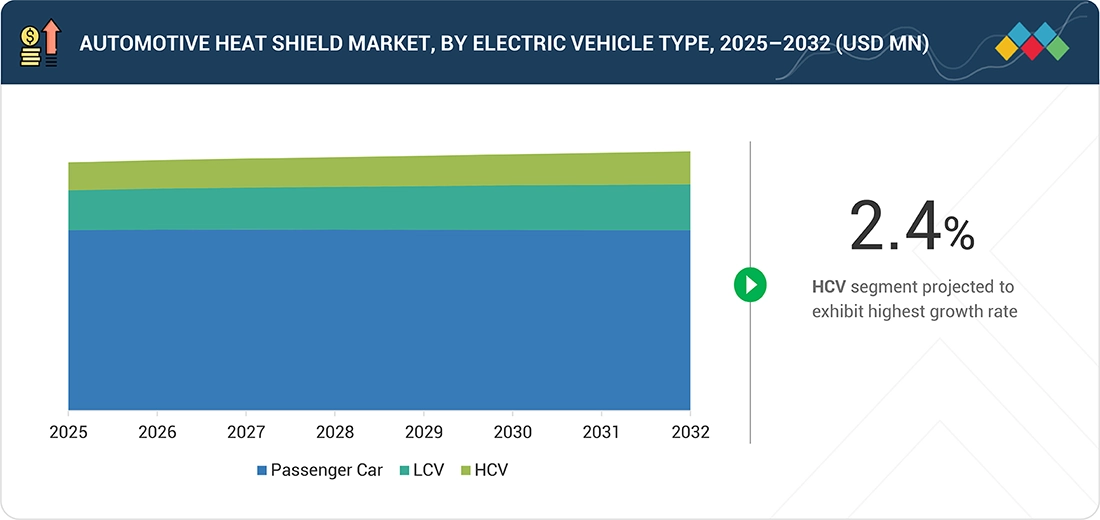
By Vehicle TypeIn this chapter, three vehicle types are examined for research: passenger cars, light commercial vehicles (LCVs), and heavy commercial vehicles (HCVs). The passenger car segment is expected to lead the automotive heat shield market, driven by consistent ICE vehicle production and improvements in engine efficiency. Automakers are adopting turbocharged and high-performance engines that produce more heat, requiring effective thermal management solutions.
-
By Electric Vehicle TypeThe market is divided by electric vehicle type into battery electric vehicles (BEVs), plug-in hybrid electric vehicles (PHEVs), fuel cell electric vehicles (FCEVs), and hybrid electric vehicles (HEVs). Battery electric vehicles (BEVs) hold the largest market share in the market among electric vehicle types because of their high energy density and extensive thermal management needs. BEV heat shields are vital for battery packs where advanced thermal insulation materials—such as microcellular polyurethanes, mica sheets, and multi-layer laminates—are used to prevent thermal runaway and ensure even temperature distribution across cells. These shields differ from traditional ICE heat shields by emphasizing electrical insulation, fire containment, and the integration of phase change materials, enabling safe, efficient thermal management crucial for battery durability and safety in high-voltage EV settings.
-
By RegionThe market, by region, has been divided into Asia Pacific, Europe, North America, and the Rest of the World (RoW). The Asia Pacific region is expected to lead the market during the forecast period. As the largest automotive producer, China drives demand for heat shields with high vehicle manufacturing volumes. Likewise, with a strong presence of ICE vehicles, India experiences sustained demand for engine and exhaust heat shields.
The automotive heat shield market is expanding steadily as vehicles become more sophisticated, especially with the increasing adoption of electric vehicles (EVs), hybrid systems, and turbocharged engines. Modern vehicles produce higher thermal loads, which boosts the demand for lightweight, durable heat shields capable of withstanding extreme temperatures while enhancing fuel efficiency and safety. The market is also shaped by strict emission regulations, encouraging OEMs to use advanced materials such as aluminum, composites, and multilayer insulation. Additionally, there is growing demand for custom designs that fit tight engine compartments and protect sensitive electronics in EVs and ADAS systems. Overall, the industry’s future is closely tied to electrification, emission standards, and the move toward lightweight solutions that boost performance and cut operating costs.
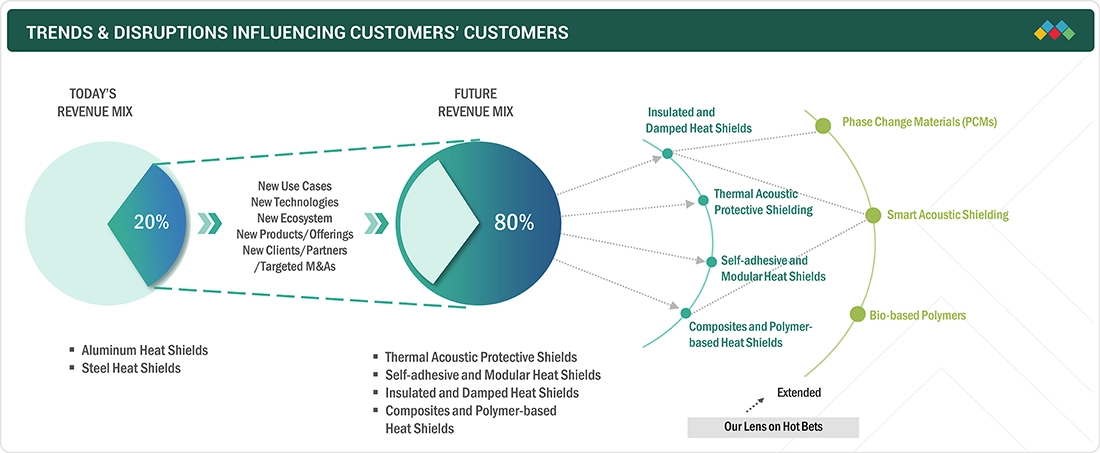
TRENDS & DISRUPTIONS IMPACTING CUSTOMERS' CUSTOMERS
The automotive heat shield market is likely to see a change in revenue patterns, shifting from traditional uses primarily for ICE vehicles to a wider demand that includes EVs. Innovations like thermal acoustic protective shielding, composite-based heat shields, and self-adhesive options are expected to play a major role in this expansion. As sales of both ICE and electric vehicles continue to grow, the need for automotive heat shields is forecasted to rise as well. Additionally, the increasing adoption of PHEVs is anticipated to boost demand for efficient thermal management solutions for batteries and electric drive units (EDUs).
Source: Secondary Research, Interviews with Experts, MarketsandMarkets Analysis
MARKET DYNAMICS
Level
-
Innovation in heat shield insulation techniques for enhanced thermal resistance

-
Growing focus on light-weighting and fuel efficiency standards

Level
-
Restrictions on ICE vehicles by key countries

-
Customization requirements increasing production complexity and cost

Level
-
Rising demand for PHEVs

-
Recycling scrap automotive heat shield insulation material

Level
-
Active cooling systems reducing reliance on passive heat shielding

Source: Secondary Research, Interviews with Experts, MarketsandMarkets Analysis
Driver: Rise in Electrical/Electronic Components in Vehicles
With increased demand for EVs and driver assistance systems, the demand for advanced thermal management solutions is growing around high-voltage battery packs, inverters, and electric motors that generate heat during charging cycles. Specialized heat shields utilize advanced materials like aluminum-coated fiberglass, aerogels, and phase-change materials to ensure component safety and performance, differentiating them from conventional engine shields. Strategically, as modern vehicles integrate more sensitive electronics, heat shields are evolving into multifunctional thermal protection systems essential for vehicle reliability and regulatory compliance. With growing EVs that incorporate complex electronics, heat shields are evolving into multifunctional thermal protection systems vital for reliability and regulatory compliance, driving innovation in design and materials as a strategic imperative in modern vehicles.
Restraint: Restrictions on ICE Vehicles by Major Countries
Many countries are enforcing strict emission rules and setting deadlines to phase out petrol and diesel vehicles, which decreases the demand for traditional heat shields used in ICE engines, exhaust systems, and turbochargers. Several major economies have announced bans on ICE vehicle sales in the coming years. For example, the European Union aims to ban new ICE vehicle sales by 2035 as part of its climate action plan. These policies directly reduce the demand for traditional heat shields used in engine compartments, exhaust systems, and fuel management components.
Opportunity: Recycling Scrap Automotive Heat Shield Insulation Material
As environmental concerns and sustainability efforts gain urgency, manufacturers focus on reducing waste and reusing materials more effectively. Heat shields, usually made from materials like aluminum, stainless steel, fiberglass, and ceramic composites, often produce significant scrap during manufacturing. By adopting efficient recycling methods, companies can lower material costs, cut waste, and support eco-friendly manufacturing practices. Aluminum-based heat shields are popular in vehicles because of their lightweight and heat-resistant qualities. Aluminum is highly recyclable, and recycling scrap aluminum from heat shield production consumes much less energy compared to making new aluminum from raw resources.
Challenge: Active Cooling Systems Reducing Reliance on Passive Heat Shielding
Advanced cooling technologies, such as liquid cooling systems and heat exchangers, are becoming more effective at managing thermal loads, reducing the need for traditional passive heat shields in certain applications. Liquid cooling systems, commonly used in EVs and high-performance vehicles, efficiently manage heat by circulating coolant through dedicated channels around key components. For example, Tesla's Model S and Model 3, BMW i-3 and i-8, Chevrolet Volt, Ford Focus, and Jaguar i-Pace, among others, employ advanced liquid cooling systems to regulate battery pack temperatures, minimizing but not eliminating the need for passive heat shielding. Similarly, liquid-cooled turbochargers are increasingly being adopted in ICE vehicles to prevent overheating, reducing the need for additional heat shields around turbo systems.
Automotive Heat Shield Market: COMMERCIAL USE CASES ACROSS INDUSTRIES
| COMPANY | USE CASE DESCRIPTION | BENEFITS |
|---|---|---|
 |
Manufactures multilayer aluminum/composite heat shields for turbochargers and exhausts in ICEs and hybrids/EVs | Improved thermal management, enhanced fuel efficiency, extended component lifespan, compliance with emission norms |
 |
Develops lightweight, high-temperature resistant heat shields for battery enclosures and power electronics in EVs | Increased EV safety and reliability, protection of sensitive electrical components, efficient thermal dissipation |
 |
Provides custom acoustic and thermal shielding systems for engines, underbody, and bulkheads in premium vehicles | Noise and heat reduction, greater passenger comfort, protection of interior electronics, premium positioning |
 |
Supplies underbody shields and thermal-acoustic insulation for various OEMs, tailored for both ICE and electric cars | Enhanced energy efficiency, occupant comfort, reduced NVH (noise, vibration, harshness), regulatory compliance |
Logos and trademarks shown above are the property of their respective owners. Their use here is for informational and illustrative purposes only.
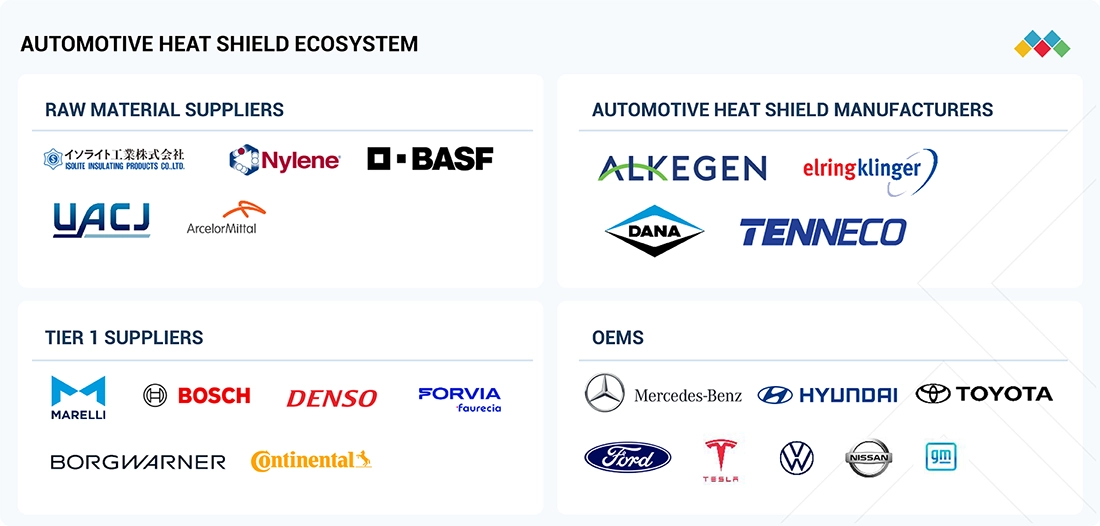
MARKET ECOSYSTEM
The ecosystem analysis highlights various players such as OEMs, automotive heat shield manufacturers, Tier 1 Suppliers, and raw material suppliers. Some major automotive heat shield manufacturers include Tenneco Inc. (US), ElringKlinger AG (Germany), Dana Limited (US), Alkegen (US), and Autoneum (Switzerland), among others.
Logos and trademarks shown above are the property of their respective owners. Their use here is for informational and illustrative purposes only.
MARKET SEGMENTS
Source: Secondary Research, Interviews with Experts, MarketsandMarkets Analysis
By Product
The automotive heat shield market by product type is divided into single-shell, double-shell, and sandwich-type heat shields. The double-shell heat shield is projected to hold the largest share of the market, mainly due to its effective thermal protection in high-temperature areas such as under the hood and turbocharger applications. North America is expected to represent a significant market for double-shell automotive heat shields, driven by strict emission regulations, increasing vehicle production, and rising demand for thermal management solutions in EVs and ICE vehicles.
By Application
The market has been divided into exhaust system heat shields, engine compartment heat shields, under-hood heat shields, under-chassis heat shields, and turbocharger heat shields. The turbocharger heat shield segment is projected to grow at a higher CAGR in the market due to the increasing use of turbocharged engines in passenger and commercial vehicles. The Asia Pacific region is expected to hold the largest market share for turbocharged heat shield applications within the industry, primarily because of the growing adoption of turbocharged engines across various vehicle segments.
By Function
The market is divided by function into acoustic and non-acoustic heat shields. The acoustic heat shield is expected to be the largest segment due to its dual role in thermal insulation and noise reduction. The Asia-Pacific region is projected to hold the largest market share for acoustic heat shields, driven by high vehicle production in countries like China, India, Japan, and South Korea.
By Material Type
The automotive heat shield market is divided into metallic and non-metallic segments based on material type. The metallic heat shields segment is expected to hold the largest share in the market, mainly due to increasing vehicle production, strict emission standards, and growing demand for better thermal management in high-temperature areas such as exhaust systems, engine compartments, and beneath the chassis. Asia Pacific is projected to be the largest market for automotive metallic heat shields during the forecast period. The demand for metallic heat shields is fueled by the strong preference for ICE vehicles in countries like China and India, where traditional vehicles continue to dominate the market.
By Vehicle Type
This chapter examines three vehicle types: passenger cars, light commercial vehicles (LCVs), and heavy commercial vehicles (HCVs). The passenger car segment is projected to dominate the market, fueled by ongoing ICE vehicle production and improvements in engine efficiency. Asia Pacific is expected to lead the passenger car market for automotive heat shields, driven by high vehicle output and rising adoption of fuel-efficient ICE technologies. Countries like China, India, and Japan are key manufacturing centers, with automakers investing in advanced thermal management solutions to meet strict emission standards.
BY Electric Vehicle Type
The market is divided by electric vehicle type into battery electric vehicles (BEVs), plug-in hybrid electric vehicles (PHEVs), fuel cell electric vehicles (FCEVs), and hybrid electric vehicles (HEVs). Battery electric vehicles (BEVs) have the largest market share in the automotive heat shield industry among electric vehicle types because of their high energy density and significant thermal management needs.
By Region
The automotive heat shield market, by region, has been divided into Asia Pacific, Europe, North America, and the Rest of the World (RoW). The Asia Pacific region is expected to lead the market during the forecast period. China is projected to be the largest market for automotive heat shields during this period, supported by its strong automotive industry presence. Leading OEMs such as BYD Company Ltd., Beijing Automotive Group Co., Ltd., and Geely Auto make significant contributions to vehicle production.
REGION
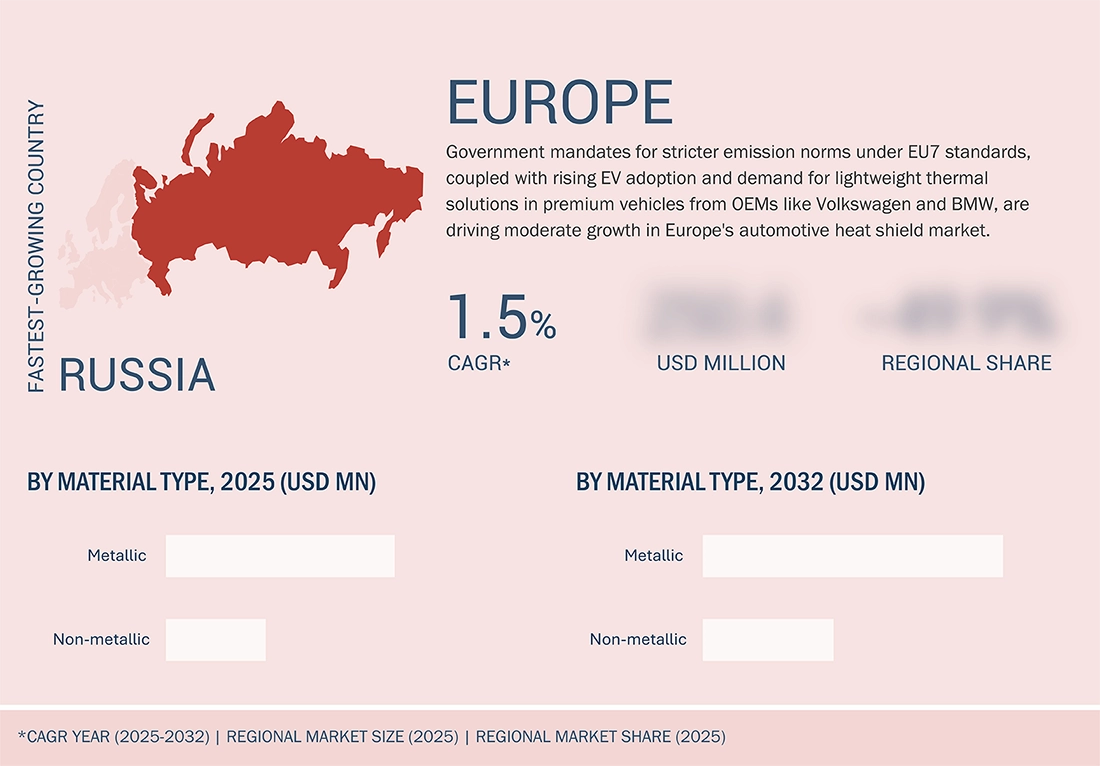
During the forecast period, Europe is projected to dominate the automotive heat shield market.
During the forecast period, Europe is expected to record the highest growth rate in the market, driven by strong demand for fuel-efficient vehicles and strict emission regulations. Countries like Germany, France, Italy, and the UK are experiencing significant market growth because of high passenger vehicle production and increasing adoption of advanced thermal management solutions. The region’s focus on lightweight, high-performance heat shield materials for internal combustion, hybrid, and electric vehicles speeds up innovation. Manufacturers such as Ford, Stellantis, Trelleborg, and Magna International have expanded their presence in Europe, shaping market growth through new product development and collaborations. These factors together establish Europe as the fastest-growing region for automotive heat shields.
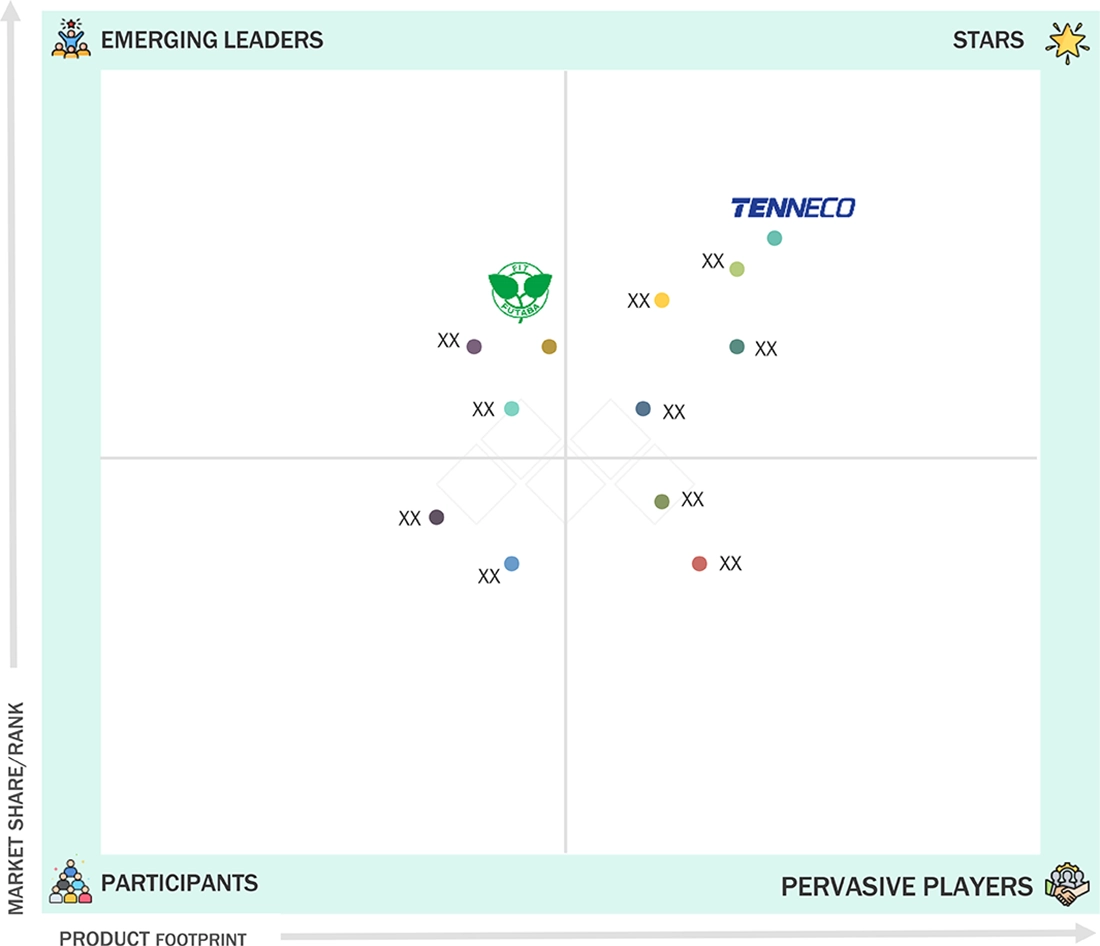
Automotive Heat Shield Market: COMPANY EVALUATION MATRIX
Microquadrants provide information about the major players in the automotive heat shield market. Tenneco is positioned in the Star quadrant because it has a strong global presence, advanced product technology, and steady demand from major automakers. Conversely, Futaba Industrial Co. is in the Emerging quadrant as it has good capabilities but still a smaller market reach and lower global visibility. To move into the Star quadrant, Futaba needs to expand partnerships with leading OEMs, invest more in lightweight and advanced materials, and grow its international customer base. This shift would help it gain a larger market share and a stronger position.
Source: Secondary Research, Interviews with Experts, MarketsandMarkets Analysis
KEY MARKET PLAYERS
MARKET SCOPE
| REPORT METRIC | DETAILS |
|---|---|
| Market Size in 2025 (Value) | USD 12.14 Billion |
| Market Forecast in 2032 (Value) | USD 12.68 Billion |
| CAGR | CAGR of 0.6% from 2025-2032 |
| Years Considered | 2021-2032 |
| Base Year | 2024 |
| Forecast Period | 2025-2032 |
| Units Considered | Value (USD Million/Billion), Volume (Thousand Units) |
| Report Coverage | Revenue forecast, company ranking, competitive landscape, growth factors, and trends |
| Segments Covered |
|
| Regional Scope | Asia Pacific, Europe, North America, Rest of the World |
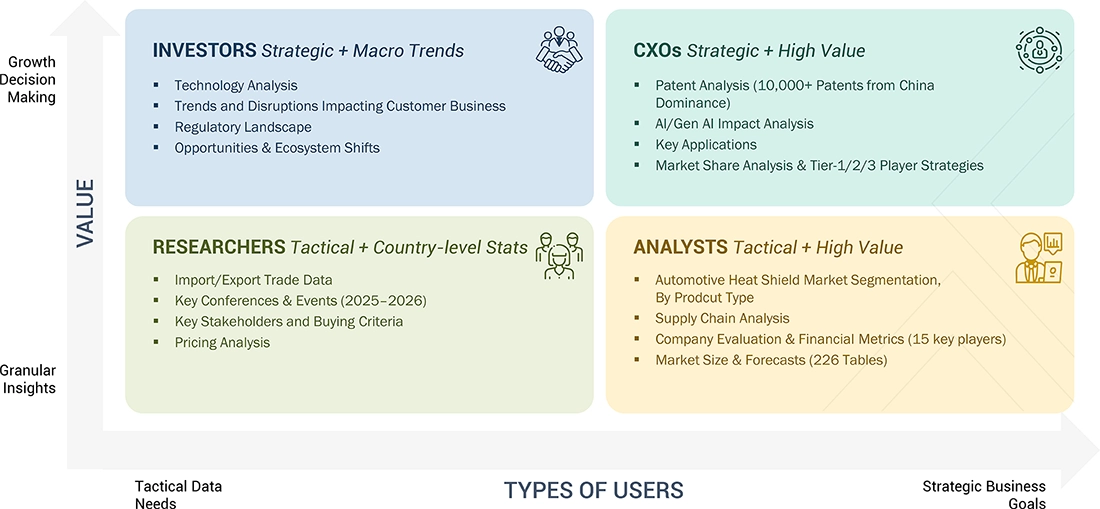
WHAT IS IN IT FOR YOU: Automotive Heat Shield Market REPORT CONTENT GUIDE
DELIVERED CUSTOMIZATIONS
We have successfully delivered the following deep-dive customizations:
| CLIENT REQUEST | CUSTOMIZATION DELIVERED | VALUE ADDS |
|---|---|---|
| Global OEM (US) | Competitive benchmarking of advanced heat shield materials and designs used by key players like Tenneco, Dana, and ElringKlinger | Provided insights for material selection and light-weighting strategies to enhance thermal management efficiency |
| Tier-1 Suppliers | Detailed analysis of heat shield integration challenges in hybrid and electric vehicles focusing on battery and powertrain protection | Optimized shielding solutions for high-temperature zones, improving component lifespan and vehicle safety |
| Electric Vehicle Manufacturers | Forecasting market demand and technology trends for heat shields tailored to EV batteries, inverters, and electric motors | Supported R&D prioritization and go-to-market strategies for EV-specific thermal protection solutions |
| Commercial Vehicle OEMs | Assessment of heat shield requirements in heavy-duty engines, exhaust systems, and turbochargers under stringent emission regulations | Enabled compliance assurance and durability enhancements for commercial vehicles operating under harsh conditions |
| Thermal Management Innovators (Global) | Review of emerging materials (aerogels, composites) and multi-layer designs providing acoustic plus thermal insulation benefits | Facilitated development of next-gen heat shields combining noise reduction with heat protection for premium segments |
RECENT DEVELOPMENTS
- November 2024 : Autoneum (Switzerland) opened a new Research & Technology (R&T) Center in Shanghai, China, to focus on New Mobility and expand its presence there. The center supports developing and producing components and materials for e-mobility.
- October 2024 : At the International Suppliers Fair (IZB) 2024, ElringKlinger AG from Germany introduced ElroForm TP-ECO and ElroSafe shielding for battery systems. These solutions safeguard against thermal propagation, prevent short circuits caused by metallic venting particles, and improve thermal shielding between the battery case and the surrounding environment or passenger compartment.
- October 2024 : The Battery Show North America 2024 featured a presentation by ElringKlinger AG (Germany), which showcased ElroSafe underbody shielding for battery protection, a thermoplastic cover with integrated electromagnetic interference (EMI) shielding, as well as ElroShield EV+.
- April 2024 : Alkegen (US) announced that JLR (UK) chose its new range of anti-thermal propagation products to improve thermal protection in JLR's next-generation electric vehicles. This product line offered advanced solutions with multiple protection levels for the battery. The products were designed for easy integration into various battery applications, making them adaptable to different EV models.
- April 2024 : Aspen Aerogels, Inc. (US) received a PyroThin design order from Valmet Automotive, a manufacturing partner for Porsche's next-generation electric 718 series. Aspen Aerogels will supply PyroThin for this fully electric vehicle lineup. PyroThin is a thin, lightweight insulation and fire barrier designed to help prevent thermal runaway at the cell, module, and battery pack levels.
Table of Contents
 Exclusive indicates content/data unique to MarketsandMarkets and not available with any competitors.
Methodology
The study encompassed four primary tasks to determine the present and future scope of the automotive heat shield market. Initially, extensive secondary research was conducted to gather data on the market, its related sectors, and overarching industries. Subsequently, primary research involving industry experts across the value chain corroborated and validated these findings and assumptions. The complete market size was estimated by using both top-down and bottom-up methodology. Following this, a data triangulation approach was utilized to determine the size of specific segments and subsegments within the market.
Secondary Research
In the secondary research process, various secondary sources such as company annual reports/presentations, press releases, industry association publications [for example, International Organization of Motor Vehicle Manufacturers (OICA), National Highway Traffic Safety Administration (NHTSA), International Energy Association (IEA)], articles, directories, technical handbooks, trade websites, technical articles, and databases (such as Marklines and Factiva) have been used to identify and collect information useful for an extensive commercial study of the global automotive heat shield market.
Primary Research
In the primary research process, various primary sources from both the supply and demand sides were interviewed to obtain qualitative and quantitative information on the market. The primary sources from the supply side included various industry experts, such as CXOs, vice presidents, directors from business development, marketing, product development/innovation teams, and related key executives from various key companies. Various system integrators, industry associations, independent consultants/industry veterans, and key opinion leaders were also interviewed.
Primary interviews have been conducted to gather insights such as sizing estimates on the automotive heat shield market and forecast, future technology trends, and upcoming technologies in the market. Data triangulation of all these points was done using the information gathered from secondary research and model mapping. Stakeholders from the demand and supply sides have been interviewed to understand their views on the abovementioned points.

Note 1: Others include sales managers, marketing managers, and product managers.
Note 2: Tier 1 companies’ revenues are more than USD 10 billion; tier 2 companies’ revenues range between USD 1 and 10 billion; and tier 3 companies’ revenues range between USD 500 million and USD 1 billion.
Source: Industry Experts
To know about the assumptions considered for the study, download the pdf brochure
Market Size Estimation
Both top-down and bottom-up approaches were used to estimate and validate the total size of the automotive heat shield market. These methods were also used extensively to estimate the size of various subsegments in the market. The research methodology used to estimate the market size includes the following:
Automotive Heat Shield Market : Top-Down and Bottom-Up Approach

Data Triangulation
After arriving at the overall market size—using the market size estimation processes as explained above—the market was split into several segments and subsegments. Data triangulation was employed to complete the overall market engineering process and arrive at the exact statistics of each market segment and subsegment, wherever applicable. The data was triangulated by studying various factors and trends from both the demand and supply sides.
Market Definition
Automotive heat shields are protective barriers designed to prevent heat from engine components, exhaust systems, or other high-temperature areas from affecting surrounding parts. They help enhance vehicle performance, safety, and durability by managing heat dissipation efficiently.
Stakeholders
- Automotive component manufacturers
- Associations, forums, and alliances related to automobiles
- Automotive original equipment manufacturers
- Automotive investors
- Automotive heat shield manufacturers
- Raw material suppliers for automotive heat shields
- Government agencies and policymakers
- Traders and distributors of automotive heat shields
Report Objectives
-
To define, segment, and forecast the size of the automotive heat shield market in terms of value (USD million) from 2025 to 2032, based on the following:
- Product type (single shell, double shell, and sandwich)
- Application (exhaust system heat shield, turbocharger heat shield, under bonnet heat shield, engine compartment heat shield, and under chassis heat shield)
- Function (acoustic and non-acoustic)
- Material type (metallic and non-metallic)
- Vehicle type (passenger cars, light commercial vehicles, and heavy commercial vehicles)
- Electric vehicle type (battery electric vehicles, plug-in hybrid electric vehicles, and fuel-cell electric vehicles)
- Region (Asia Pacific, Europe, North America, and Rest of the World)
- To identify and analyze key drivers, restraints, opportunities, and challenges influencing market growth
- To strategically analyze the market for individual growth trends, prospects, and contributions to the total market
-
To study the following with respect to the market
- Value chain analysis
- Ecosystem analysis
- Technology analysis
- Trade analysis
- Pricing analysis
- Case study analysis
- Patent analysis
- Regulatory framework
- Key stakeholders and buying criteria
- MnM insight on the average weight of heat shields in passenger car
- To strategically profile key players and comprehensively analyze their market share and core competencies
- To analyze the opportunities for stakeholders and the competitive landscape for market leaders
- To track and analyze competitive developments such as deals (collaboration, agreement, and acquisition), product launches/developments, expansions, and other activities undertaken by the key industry participants
Available Customizations
With the given market data, MarketsandMarkets offers customizations in accordance with company-specific needs.
Product Analysis
- Automotive heat shield market, by application, at country level
- Automotive heat shield market, by product type, at country level
Company Information
- Profiling of additional market players (up to five)
Key Questions Addressed by the Report
Need a Tailored Report?
Customize this report to your needs
Get 10% FREE Customization
Customize This ReportPersonalize This Research
- Triangulate with your Own Data
- Get Data as per your Format and Definition
- Gain a Deeper Dive on a Specific Application, Geography, Customer or Competitor
- Any level of Personalization
Let Us Help You
- What are the Known and Unknown Adjacencies Impacting the Automotive Heat Shield Market
- What will your New Revenue Sources be?
- Who will be your Top Customer; what will make them switch?
- Defend your Market Share or Win Competitors
- Get a Scorecard for Target Partners

Custom Market Research Services
We Will Customise The Research For You, In Case The Report Listed Above Does Not Meet With Your Requirements
Get 10% Free CustomisationTESTIMONIALS

JIM NAAS
PRODUCT DIRECTOR, WEASLER
Weasler Engineering, a CentroMotion organization
Global Provider of Industrial Actuation & Control Solutionswww.weasler.com
Our organization was interested in learning more about the attractiveness of a particular market space. We contacted MarketsandMarkets to help us based on previous positive experiences we had with them. The results did not disappoint! We discussed our objectives with them, and the team at MarketsandMarkets developed and executed a proposal that met our needs precisely. We were very impressed by their level of expertise, the quality of the analysis and their insightful recommendations. We would not hesitate in working with them again in the future.

Matt Kardel,
Vice President
Aptiv,
A global technology company that develops safer, greener and more connected solutions.www.aptiv.com
We contracted with
MarketsandMarkets to evaluate the value chain and potential go-to-market partners related to our
interest in the Fleet Management space. The team successfully completed the work on time and at the
pricing agreed. MarketsandMarkets listened and understood our objectives and collaborated well with
us to help us get the visibility we needed to make an investment.
We have subsequently used
MarketsandMarkets again related to Smart Cities to good results.


Growth opportunities and latent adjacency in Automotive Heat Shield Market