The study encompassed four primary tasks to determine the present scope of the automotive gears market. Initially, extensive secondary research was conducted to gather data on the market, its related sectors, and overarching industries. Subsequently, these findings and assumptions were corroborated and validated through primary research involving industry experts across the value chain. Employing both bottom-up and top-down methodologies, the complete market size was estimated. Following this, a market breakdown and data triangulation approach were utilized to determine the size of specific segments and subsegments within the market.
Secondary Research
The secondary sources referred to for the study of the automotive gears market are directly dependent on end-use industry growth. Market sales and end-use industry demand are derived through secondary sources such as the International Organization of Motor Vehicle Manufacturers (OICA), European Automobile Manufacturers Association (ACEA), International Council on Clean Transportation (ICCT), Automotive Component Manufacturers Association of India (ACMA), Japan Automobiles Manufacturers Association (JAMA), corporate filings such as annual reports, investor presentations, and financial statements, and paid repository. Historical production data has been collected and analyzed, and the industry trend is considered to arrive at the forecast, further validated by primary research.
Primary Research
In the primary research process, various primary sources from both the supply and demand sides were interviewed to obtain qualitative and quantitative information on the market. The primary sources from the supply side included various industry experts, such as CXOs, vice presidents, directors from business development, marketing, product development/innovation teams, and related key executives from various key companies. Various system integrators, industry associations, independent consultants/industry veterans, and key opinion leaders were also interviewed.
Primary interviews have been conducted to gather insights such as automotive gears market sizing estimation and forecast, future technology trends, and upcoming technologies in the market. Data triangulation of all these points was done using the information gathered from secondary research and model mapping. Stakeholders from the demand and supply sides have been interviewed to understand their views on the aforementioned points.
Primary interviews have been conducted with market experts from the demand-side (end-use industries) and supply-side (automotive gears providers) across four regions: North America, Europe, Asia Pacific, and the Rest of the World. Approximately 50% and 50% of the primary interviews were conducted on the OEMs and component manufacturer sides. Primary data has been collected through questionnaires, emails, and telephonic interviews. After communicating with primaries, we have strived to cover various departments within organizations, such as sales and operations, to provide a holistic viewpoint in our report. After interacting with industry experts, we have also conducted brief sessions with highly experienced independent consultants to reinforce the findings from our primaries. This and the in-house subject matter experts’ opinions have led us to the conclusions described in the remainder of this report.

To know about the assumptions considered for the study, download the pdf brochure
Market Size Estimation
As mentioned below, a detailed market estimation approach was followed to estimate and validate the value of the automotive gears market and other dependent submarkets.
-
Key players in the automotive gears market were identified through secondary research, and their global market ranking was determined through primary and secondary research.
-
The research methodology included a study of annual and quarterly financial reports, regulatory filings of major market players (public), and interviews with industry experts for detailed market insights.
-
All vehicle level penetration rates, percentage shares, splits, and breakdowns for the market were determined using secondary sources and verified through primary sources.
-
All key macro indicators affecting the revenue growth of the market segments and subsegments were accounted for, viewed in extensive detail, verified through primary research, and analyzed to obtain validated and verified quantitative and qualitative data.
-
The gathered market data was consolidated, enhanced with detailed inputs, analyzed, and presented in this report.
Global Automotive Gears Market Size: Bottom-Up Approach By Vehicle Type and Country

To know about the assumptions considered for the study, Request for Free Sample Report
Data Triangulation
All percentage shares, splits, and breakdowns have been determined using secondary sources and verified by primary sources. All parameters that affect the markets covered in this research study have been accounted for, viewed in extensive detail, and analyzed to obtain the final quantitative and qualitative data. This data has been consolidated and enhanced with detailed inputs and analysis from MarketsandMarkets and presented in the report.
Market Definition
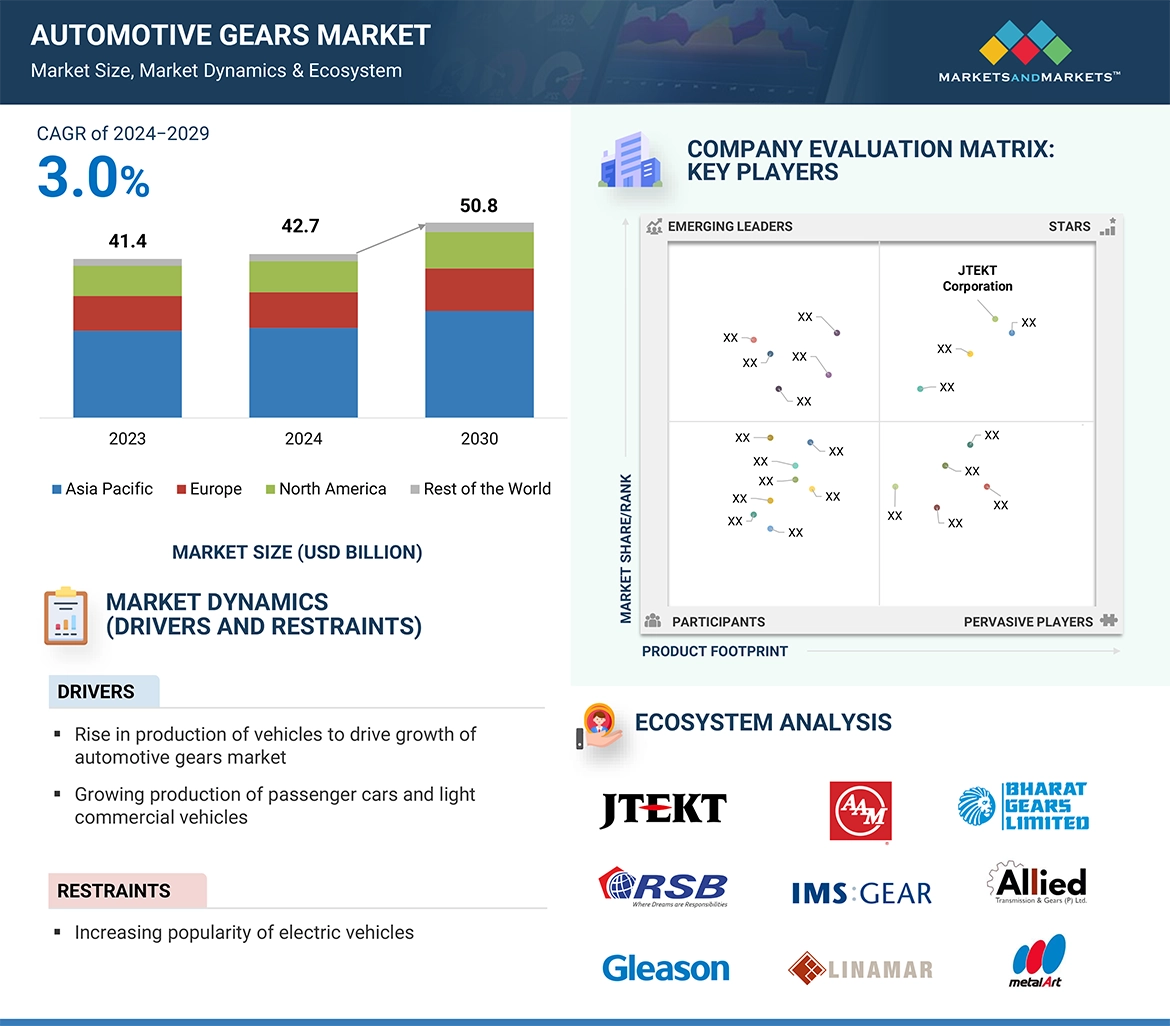
Automotive Gear: A gear is a roller-shaped component with teeth along its outer edge, used in machines to transfer speed and torque between vehicle shafts. Gears enable different torque and speed ratios and can change the direction of the driven or driving shaft—the teeth on the gear wheel interlock to facilitate the transfer of speed and torque. Automotive Gears are mainly used in automotive transmissions, differentials, steering systems, and other applications.
Key Stakeholders
-
Senior Management
-
End User Finance/Procurement Department
-
R&D Department
Report Objectives
-
To define, describe, and forecast the size of the automotive gears market in terms of value (USD million) and volume (thousand units) between 2024 and 2030 based on the following segments:
-
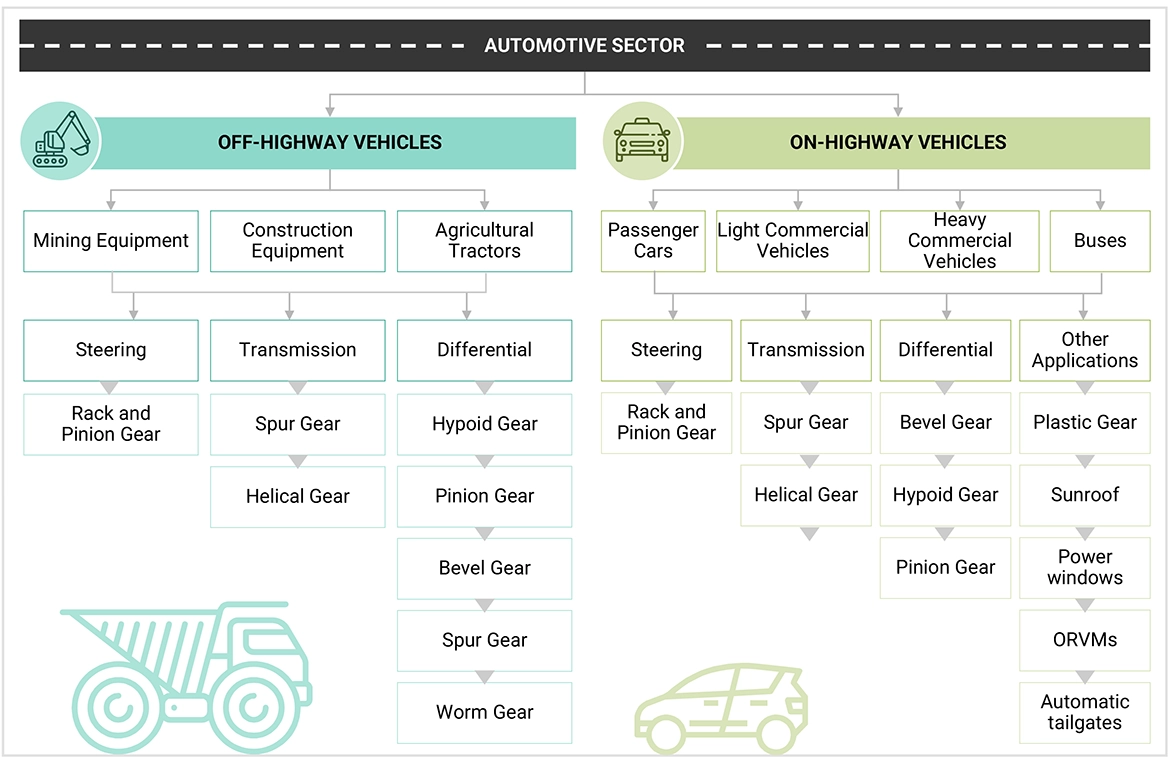
By Application (Transmission System, Differential System, Steering System, and Other Automotive Applications)
-
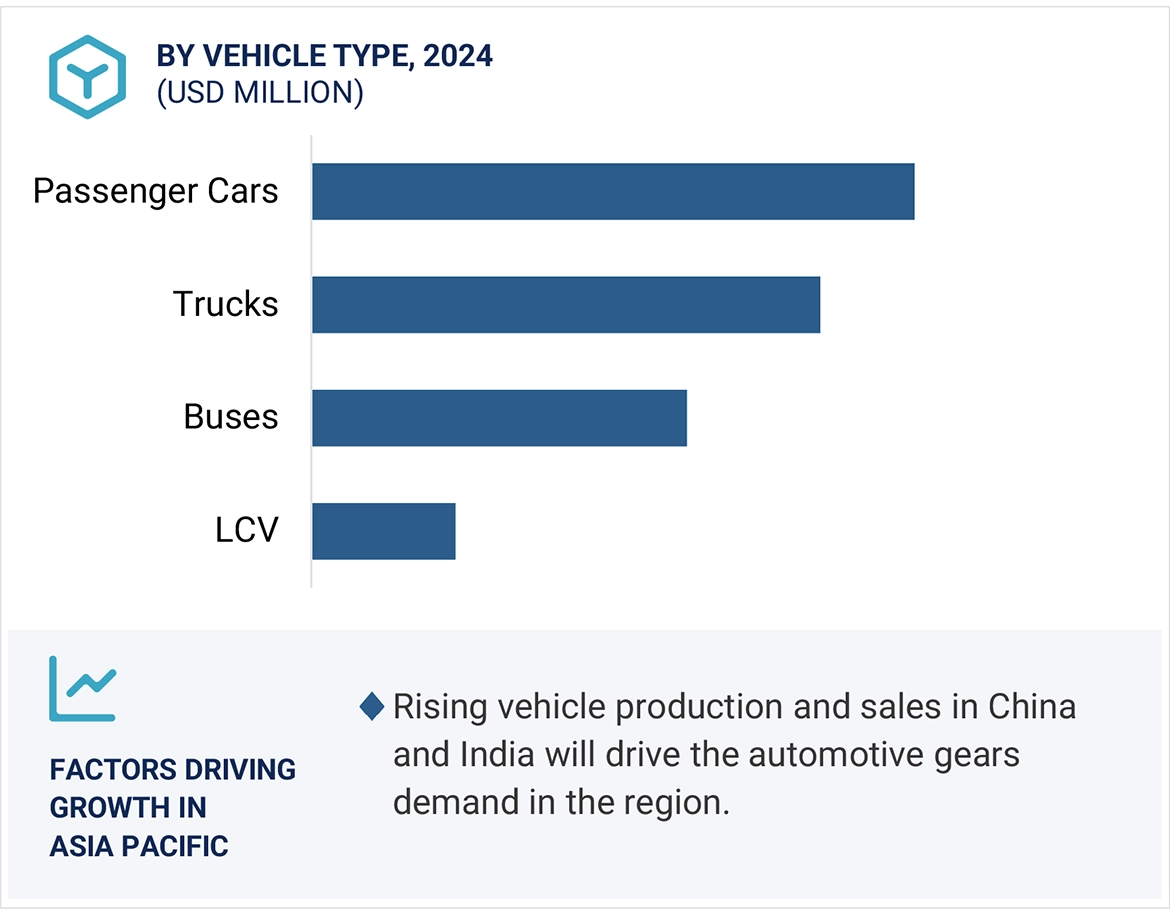
By Vehicle Type (Passenger Cars, Light Commercial Vehicles, and Heavy Commercial vehicles)
-
By Material Type (Metallic and Non-metallic)
-
By Gear Type (Planetary gears, Bevel gears, Rack and Pinion gears, Hypoid gears, Worm gears, Helical gears, Spur gears, Pinion gears and Non-metallic gears)
-
Hybrid Vehicle gear market by application (Transmission System, Differential System, Steering System, and Other Automotive Applications)
-
Transmission gear market by transmission type (Automatic transmission, Automated manual transmission, Manual transmission, and Dual clutch transmission)
-
Differential Gears market by Gear type (Bevel gears, Pinion gears, Hypoid gears, Helical gears, Worm gears and Spur gears)
-
By Region (Asia Pacific, Europe, North America, and Rest of the World)
-
To identify and analyze key drivers, restraints, opportunities, and challenges influencing the market
-
To analyze the market share of leading players in the automotive gears market and evaluate competitive leadership mapping.
-
To strategically analyze key player strategies and company revenue analysis
-
To study the following with respect to the market
-
Trends and Disruptions Impacting Customers’ Businesses
-
Market Ecosystem
-
Technology Analysis
-
Supply Chain Analysis
-
Patent Analysis
-
Regulatory Landscape
-
Case Study Analysis
-
Key Stakeholders and Buying Criteria
-
Key Conferences and Events
-
Trade Analysis
-
Investment and Funding Scenario
-
Pricing Analysisn
-
To analyze recent developments, including product launches, partnerships, acquisitions, expansions, and other developments undertaken by key industry participants in the market
-
To give a brief understanding of the automotive gears market in the recommendations chapter
AVAILABLE CUSTOMIZATIONS
With the given market data, MarketsandMarkets offers customizations in accordance with the company’s specific needs.
TRANSMISSION GEARS MARKET, BY TRANSMISSION TYPE AND COUNTRY
-
Automatic Transmission
-
Automated Manual Transmission
-
Manual Transmission
-
Dual Clutch Transmission
Note: The transmission type market can be provided for each vehicle type in terms of volume and value at the country level.
DIFFERENTIAL GEARS MARKET BY GEAR TYPE AND COUNTRY
-
Bevel Gears
-
Spur Gears
-
Worm Gears
-
Hypoid Gears
-
Helical Gears
-
Pinion gears
Note: The market for each differential gear type can be provided for each mentioned vehicle type in terms of volume and value at the country level.
TRANSMISSION GEARS MARKET BY GEAR TYPE
-
Planetary Gears
-
Spur Gears
-
Helical Gears


Growth opportunities and latent adjacency in Automotive Gears Market