Torque Vectoring Market for Automotive by Vehicle type (PC and LCV), Technology (ATVS and PTVS), Propulsion (AWD/4WD, FWD, RWD), EV Type (BEV and HEV), Clutch Actuation Type (Hydraulic and Electronic), and Region - Global Forecast to 2025


The Automotive Torque Vectoring Market is primarily driven by the increased demand for luxury and performance vehicles (including SUVs, crossovers, and off-highway vehicles). The automotive torque vectoring market is projected to grow at a CAGR of 20.01% from 2018 to 2025. From a market size of USD 5.22 billion in 2018, it is projected to reach a market size of USD 18.70 billion by 2025.
The base year considered for the study is 2017 and the forecast period considered for the study is from 2018 to 2025. The objective is to define, describe, and forecast the toque vectoring market for automotive based on vehicle type (Passenger Cars and Light Commercial Vehicle), Technology (Active Torque Vectoring System and Passive Torque Vectoring System), Propulsion (AWD/4WD, Front Wheel Drive, Rear Wheel Drive), EV Type (Battery Electric Vehicle and Hybrid Electric Vehicle), Clutch Actuation Type (Hydraulic and Electronic) and Region (Asia Pacific, Europe, North America.
The research methodology used in the report involves various secondary sources such as Marklines, European Automobile Manufacturers Association (ACEA), Automotive Maintenance and Repair Association (AMRA), and paid databases and directories. The market numbers are based on country-wise production, which is further added to arrive at the regional market. The regional data is then added to derive the global data. Vehicle production numbers have been considered to arrive at the market size, in terms of volume. The country-wise market volume is then multiplied with the country-wise average OE price of torque vectoring system. This gives the country-wise market size for torque vectoring system, in terms of value. The summation of the country-wise and regional-level market size, in terms of value, provides the torque vectoring market for automotive.
The figure below illustrates the break-up of the profile of industry experts who participated in primary discussions.
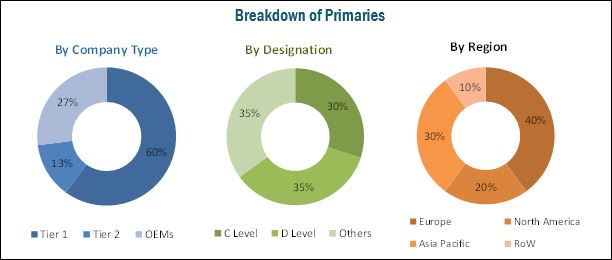
To know about the assumptions considered for the study, download the pdf brochure
The major players in the torque vectoring market for automotive are GKN (UK), American Axle (US), Dana (US), BorgWarner (US), Eaton (Ireland), ZF (Germany), JTEKT (Japan), Getrag (Canada), Bosch (Germany), Univance (Germany), Schaeffler (Germany), Timken (US), Ricardo (UK), and Oerlikon Graziano (Italy).
Target Audience
- Automotive OEMs
- Differential component raw material suppliers
- Differential component suppliers
- Distributors and suppliers of automotive components/parts
- Distributors and suppliers of automotive differential manufacturers
- Electric component manufacturers
- Electric vehicle manufacturers
- Industry associations and experts
- Original equipment manufacturers (OEMs)
- Raw material manufacturers
- Raw material suppliers
- Technology developers and suppliers
- Torque vectoring manufacturers
Scope of the Report
By Vehicle Type:
- Passenger Car
- Light Commercial Vehicle
By Propulsion:
- Front wheel drive (FWD)
- Rear wheel drive (RWD)
- All wheel drive/Four wheel drive (4WD)
By Clutch Actuation Type:
- Hydraulic
- Electronic
By EV Type:
- BEV
- HEV
By Technology:
- Active Torque Vectoring System
- Passive Torque Vectoring System
By Region:
- North America
- Asia Pacific
- Europe
- RoW
Available Customizations
With the given market data, MarketsandMarkets offers customizations in accordance with the company’s specific needs.
By EV Type, by Region
- Introduction
- BEV
- HEV
Company Information
- Profiling of additional market players (Up to 3)
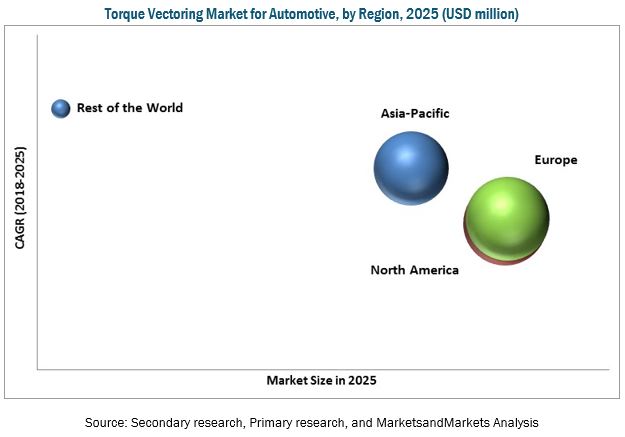
The automotive torque vectoring market is primarily driven by the increased demand for luxury and performance vehicles (including SUVs, crossovers, and off-highway vehicles). The torque vectoring market for automotive is projected to grow at a CAGR of 20.01% from 2018 to 2025. From a market size of USD 5.22 billion in 2018, it is projected to reach a market size of USD 18.70 billion by 2025. The important factors driving the growth of this market include the increase in awareness about enhanced safety and vehicle dynamics.
The global market has been segmented on the basis of vehicle type, technology, propulsion, EV type, clutch actuation type, and region. Europe region is projected to be the largest market in this market because of the presence of many developed countries such as Germany, the UK, France, and Spain, which account for a considerable share of the European automotive industry. The market is dominated by established OEMs such as BMW AG (Germany), Daimler AG (Germany), Fiat (Italy), PSA/Peugeot-Citroen (France), Jaguar Land Rover (UK) and the Volkswagen Group (Germany).
AWD/4WD is estimated to be the largest as well as the fastest growing segment of the global market during the forecast period. The AWD/4WD segment is mainly driven by growing demand for SUVs, increasing demand for improved vehicle safety, stability, and enhanced driving dynamics. The AWD/4WD systems find their application mostly in the premium car segment and SUVs. Improving economic conditions, increasing industrialization, and the improving living standards of consumers around the world have increased the demand for premium segment cars and SUVs.
The electronic clutch actuation type is enjoying greater adoption rate owing to its better efficiency, unlike the hydraulic clutch. The electronic clutch serves the requirements of the mechanical components with more efficiency and durability. Also, it helps in improving the overall fuel efficiency with high accuracy and hence, fulfills several stringent emission norms that is the major factor leading toward the adoption of such components in vehicles.
In the electric vehicle segment, HEVs have the largest market share in terms of volume. HEVs are premium vehicles in terms of their price range and the features offered, and they have higher fuel economy compared to the ICE variant of the same model. Japan is the leading country in terms of sales of hybrid vehicles owing to the presence of leading hybrid vehicle manufacturers such as Nissan and Toyota.
The growing mobility services is the major restraint for the global torque vectoring market. The development in infrastructure and IT is enabling more connectivity services, which is leading to more pooling services with the help of apps or remote services. Also, due to the emergence of such services and advancements in technology, the technologies in the vehicles are getting over the air updates which is driving the global mobility services market. This increase in shared mobility services would impact the car-ownership model because as the time passes, people would prefer more convenient and affordable transport options. Hence, we expect that as the car ownership is expected to decline with the emergence of shared services, it would hinder the growth of the global SUV market, and therefore restrain the growth of global market.
The major players in the torque vectoring market are GKN (UK), American Axle (US), Dana (US), BorgWarner (US), Eaton (Ireland), ZF (Germany), JTEKT (Japan), Magna (Canada), Bosch (Germany), Univance (Germany), Schaeffler (Germany), Timken (US), Ricardo (UK), and Oerlikon Graziano (Italy).
Currently, GKN, Dana, BorgWarner, and ZF are the dominant players in this market. The extensive competition in the automotive industry has led these companies to primarily focus on innovations. Mobility is becoming increasingly advanced and automated and requires a highly complex technology. Therefore, companies must focus on innovation.
To speak to our analyst for a discussion on the above findings, click Speak to Analyst
 Exclusive indicates content/data unique to MarketsandMarkets and not available with any competitors.
Table of Contents
1 Introduction (Page No. - 16)
1.1 Objectives Of The Study
1.2 Market Definition
1.3 Market Scope
1.3.1 Years Considered For The Study
1.4 Currency
1.5 Package Size
1.6 Limitations
1.7 Stakeholders
2 Research Methodology (Page No. - 20)
2.1 Research Data
2.1.1 Secondary Data
2.1.1.1 Key Secondary Sources
2.1.1.2 Key Data From Secondary Sources
2.1.2 Primary Data
2.1.2.1 Breakdown Of Primary Interviews
2.1.2.2 Sampling Techniques & Data Collection Methods
2.1.2.3 Primary Participants
2.2 Torque Vectoring Market Size Estimation
2.2.1 Bottom-Up Approach
2.3 Torque Vectoring Market Breakdown And Data Triangulation
2.4 Assumptions
3 Executive Summary (Page No. - 29)
4 Premium Insights (Page No. - 32)
4.1 Attractive Opportunities in the Automotive Torque Vectoring Market
4.2 Global Torque Vectoring Market, By Country
4.3 Global Torque Vectoring Market, By Technology
4.4 Global Torque Vectoring Market, By Clutch Actuation Type
4.5 Global Torque Vectoring Market, By Vehicle Type
4.6 Global Torque Vectoring Market, By Propulsion
4.7 Global Torque Vectoring Market , By Region
5 Global Torque Vectoring Market Overview (Page No. - 36)
5.1 Introduction
5.2 Market Dynamics
5.2.1 Drivers
5.2.1.1 Increased Demand For Luxury And Performance Vehicles (including SUVs, crossovers, and off-highway vehicles)
5.2.1.2 Enhanced Safety And Vehicle Dynamics
5.2.2 Restraints
5.2.2.1 Growing Mobility Services
5.2.2.2 Decline In The Enthusiast Segment—Millennial Effect
5.2.3 Opportunities
5.2.3.1 Advancements In Technology
5.2.3.2 Advent Of Concept Cars And Luxury Electric Vehicles In The Automotive Industry
5.2.4 Challenges
5.2.4.1 Developing Fail-Safe Electronic And Electrical Components
5.2.4.2 Maintaining A Balance Between Performance, Cost, And Weight
5.2.4.3 Long Production Cycle Of Automotive Vehicles
6 Technological Overview (Page No. - 44)
6.1 Introduction
6.1.1 Oversteer And Understeer
6.1.1.1 Rear-Wheel Drive (Rwd)
6.1.1.2 Front-Wheel Drive (Fwd)
6.2 Use Of Magnetorheological (Mr) Fluids By Ricardo In Their Torque Vectoring Systems
6.3 Working Of Torque Vectoring
6.3.1 Torque Vectoring Differential In Straight Line Driving
6.3.2 Torque Vectoring Differential In Cornering
7 Global Torque Vectoring Market By Electric Vehicle Type (Page No. - 48)
7.1 Introduction
7.2 BEV
7.3 HEV
8 Global Torque Vectoring Market, By Clutch Actuation Type (Page No. - 52)
8.1 Introduction
8.2 Hydraulic
8.3 Electronic
9 Global Torque Vectoring Market, By Propulsion (Page No. - 56)
9.1 Introduction
9.2 Front-Wheel Drive (FWD)
9.3 Rear-Wheel Drive (RWD)
9.4 All-Wheel Drive/Four-Wheel Drive (AWD/4WD)
10 Global Torque Vectoring Market, By Technology (Page No. - 62)
10.1 Introduction
10.2 Active Torque Vectoring System (ATVS)
10.3 Passive Torque Vectoring System (PTVS)
11 Global Torque Vectoring Market, By Vehicle Type
11.1 Introduction
11.2 Passenger Cars
11.3 Light Commercial Vehicles
12 Global Torque Vectoring Market, By Region (Page No. - 66)
12.1 Introduction
12.1.1 Passenger Car (PC)
12.1.2 Light Commercial Vehicle (LCV)
12.2 Asia Pacific
12.2.1 China
12.2.2 India
12.2.3 Japan
12.2.4 South Korea
12.2.5 Thailand
12.2.6 Rest Of Asia Pacific
12.3 Europe
12.3.1 Germany
12.3.2 France
12.3.3 Russia
12.3.4 Spain
12.3.5 Uk
12.3.6 Turkey
12.3.7 Rest Of Europe
12.4 North America
12.4.1 Canada
12.4.2 Mexico
12.4.3 Us
12.5 Rest Of The World (Row)
12.5.1 Brazil
12.5.2 Iran
12.5.3 Rest Of Row
13 Competitive Landscape (Page No. - 92)
13.1 Overview
13.2 Competitive Situations & Trends
13.2.1 New Product Developments
13.2.2 Expansions
13.2.3 Partnerships/Supply Contracts/Collaborations/Joint Ventures/Agreements/Mergers & Acquisitions
14 Company Profiles (Page No. - 98)
(Business Overview, Products Offerings, Recent Developments, SWOT Analysis, MnM View)*
14.1 GKN
14.1.1 Business Overview
14.1.2 Product Offerings
14.1.3 Recent Developments
14.1.4 SWOT Analysis
14.2 American Axle
14.2.1 Business Overview
14.2.2 Product Offerings
14.2.3 Recent Developments
14.2.4 SWOT Analysis
14.3 Dana
14.3.1 Business Overview
14.3.2 Product Offerings
14.3.3 Recent Developments
14.3.4 SWOT Analysis
14.4 Borgwarner
14.4.1 Business Overview
14.4.2 Product Offerings
14.4.3 Recent Developments
14.4.4 SWOT Analysis
14.5 Eaton
14.5.1 Business Overview
14.5.2 Product Offerings
14.5.3 Recent Developments
14.5.4 SWOT Analysis
14.6 ZF
14.6.1 Business Overview
14.6.2 Product Offerings
14.6.3 Recent Developments
14.7 JTEKT
14.7.1 Business Overview
14.7.2 Product Offerings
14.7.3 Recent Developments
14.8 Magna
14.8.1 Business Overview
14.8.2 Product Offerings
14.8.3 Recent Developments
14.9 Bosch
14.9.1 Business Overview
14.9.2 Product Offerings
14.9.3 Recent Developments
14.10 Univance
14.10.1 Business Overview
14.11 Schaeffler
14.11.1 Product Offerings
14.11.2 Recent Developments
14.12 Timken
14.12.1 Business Overview
14.13 Ricardo
14.13.1 Business Overview
14.14 Oerlikon Graziano
14.14.1 Business Overview
14.15 Mitsubishi Heavy Industries
14.15.1 Business Overview
14.16 Haldex
14.16.1 Business Overview
14.17 Continental
14.17.1 Business Overview
14.18 Drako
14.18.1 Business Overview
14.19 Prodrive
14.19.1 Business Overview
*Details On Business Overview, Products Offerings, Recent Developments, SWOT Analysis, MnM View Might Not Be Captured In Case Of Unlisted Companies.
15 Appendix (Page No. - 127)
15.1 Discussion Guide
15.2 Knowledge Store: Marketsandmarkets’ Subscription Portal
15.3 Available Customizations
15.3.1 Automotive HMI Market, By EV Type, By Region
15.3.1.1 Introduction
15.3.1.2 BEV
15.3.1.3 HEV
15.3.2 Company Information
15.3.2.1 Profiling Of Additional Market Players (Up To 3)
15.4 Related Reports
15.5 Author Details
List of Tables (83 Tables)
Table 1 Currency Exchange Rates (Per 1 Usd)
Table 2 Torque Vectoring Market For Automotive: Market Dynamics Impact
Table 3 Key Oems & Their Vehicles With Torque Vectoring System
Table 4 Torque Vectoring Market For Automotive, By Electric Vehicle Type, 2017–2025 (Thousand Units)
Table 5 BEV: Market, By Region, 2017–2025 (Thousand Units)
Table 6 HEV: Market, By Region, 2017–2025 (Thousand Units)
Table 7 Global Torque Vectoring Market For Automotive, By Clutch Actuation Type, 2017–2025 (’000 Units)
Table 8 Global Torque Vectoring Market For Automotive, By Clutch Actuation Type, 2017–2025 (Usd Million)
Table 9 Hydraulic: Torque Vectoring For Automotive, By Region, 2017–2025 (’000 Units)
Table 10 Hyraulic: Torque Vectoring For Automotive, By Region, 2017–2025 (Usd Million)
Table 11 Electronic: Torque Vectoring For Automotive, By Region, 2017–2025 (’000 Units)
Table 12 Electronic: Torque Vectoring For Automotive, By Region, 2017–2025 (Usd Million)
Table 13 Torque Vectoring Market For Automotive, By Propulsion, 2017–2025 (’000 Units)
Table 14 Torque Vectoring Market For Automotive, By Propulsion, 2017–2025 (Usd Million)
Table 15 FWD: Torque Vectoring For Automotive, By Region, 2017–2025 (’000 Units)
Table 16 FWD: Torque Vectoring For Automotive, By Region, 2017–2025 (Usd Million)
Table 17 RWD: Torque Vectoring For Automotive, By Region, 2017–2025 (’000 Units)
Table 18 RWD: Torque Vectoring For Automotive, By Region, 2017–2025 (Usd Million)
Table 19 AWD/4WD: Torque Vectoring For Automotive, By Region, 2017–2025 (’000 Units)
Table 20 AWD/4WD: Torque Vectoring For Automotive, By Region, 2017–2025 (Usd Million)
Table 21 Torque Vectoring Market For Automotive, By Technology, 2017–2025 (’000 Units)
Table 22 Torque Vectoring Market For Automotive, By Technology, 2017–2025 (Usd Million)
Table 23 Atvs: Torque Vectoring For Automotive, By Region, 2017–2025 (’000 Units)
Table 24 Atvs: Torque Vectoring For Automotive, By Region, 2017–2025 (Usd Million)
Table 25 Ptvs: Torque Vectoring For Automotive, By Region, 2017–2025 (’000 Units)
Table 26 Ptvs: Torque Vectoring For Automotive, By Region, 2017–2025 (Usd Million)
Table 27 Torque Vectoring Market For Automotive, By Region, 2017–2025 (’000 Units)
Table 28 Torque Vectoring Market For Automotive, By Region,2017–2025 (Usd Million)
Table 29 Torque Vectoring Market For Automotive, By Vehicle Type, 2017–2025 (’000 Units)
Table 30 Torque Vectoring Market For Automotive, By Vehicle Type, 2017–2025 (Usd Million)
Table 31 Pc: Torque Vectoring For Automotive, By Region, 2017–2025 (’000 Units)
Table 32 Pc: Torque Vectoring For Automotive, By Region, 2017–2025 (Usd Million)
Table 33 Lcv: Torque Vectoring For Automotive, By Region, 2017–2025 (’000 Units)
Table 34 Lcv: Torque Vectoring For Automotive, By Region, 2017–2025 (Usd Million)
Table 35 Asia Pacific: Torque Vectoring For Automotive, By Country, 2017–2025 (’000 Units)
Table 36 Asia Pacific: Torque Vectoring For Automotive, By Country, By Region, 2017–2025 (Usd Million)
Table 37 China: Torque Vectoring For Automotive, By Vehicle Type, 2017–2025 (’000 Units)
Table 38 China: Torque Vectoring For Automotive, By Vehicle Type, 2017–2025 (Usd Million)
Table 39 India: Torque Vectoring For Automotive, By Vehicle Type, 2017–2025 (’000 Units)
Table 40 India: Torque Vectoring For Automotive, By Vehicle Type, 2017–2025 (Usd Million)
Table 41 Japan: Torque Vectoring For Automotive, By Vehicle Type, 2017–2025 (’000 Units)
Table 42 Japan: Torque Vectoring For Automotive, By Vehicle Type, 2017–2025 (Usd Million)
Table 43 South Korea: Torque Vectoring For Automotive, By Vehicle Type, 2017–2025 (’000 Units)
Table 44 South Korea: Torque Vectoring For Automotive, By Vehicle Type, 2017–2025 (Usd Million)
Table 45 Thailand: Torque Vectoring For Automotive, By Vehicle Type, 2017–2025 (’000 Units)
Table 46 Thailand: Torque Vectoring For Automotive, By Vehicle Type, 2017–2025 (Usd Million)
Table 47 Rest Of Asia Pacific: Torque Vectoring Market For Automotive, By Vehicle Type, 2017–2025 (’000 Units)
Table 48 Rest Of Asia Pacific: Torque Vectoring Market For Automotive, By Vehicle Type, 2017–2025 (Usd Million)
Table 49 Europe: Torque Vectoring For Automotive, By Country, 2017–2025 (’000 Units)
Table 50 Europe: Torque Vectoring For Automotive, By Country, 2017–2025 (Usd Million)
Table 51 Germany: Torque Vectoring For Automotive, By Vehicle Type, 2017–2025 (’000 Units)
Table 52 Germany: Torque Vectoring For Automotive, By Vehicle Type, 2017–2025 (Usd Million)
Table 53 France: Torque Vectoring For Automotive, By Vehicle Type, 2017–2025 (’000 Units)
Table 54 France: Torque Vectoring For Automotive, By Vehicle Type, 2017–2025 (Usd Million)
Table 55 Russia: Torque Vectoring For Automotive, By Vehicle Type, 2017–2025 (’000 Units)
Table 56 Russia: Torque Vectoring For Automotive, By Vehicle Type, 2017–2025 (Usd Million)
Table 57 Spain: Torque Vectoring For Automotive, By Vehicle Type, 2017–2025 (‘000 Units)
Table 58 Spain: Torque Vectoring For Automotive, By Vehicle Type, 2017–2025 (Usd Million)
Table 59 UK: Torque Vectoring For Automotive, By Vehicle Type, 2017–2025 (’000 Units)
Table 60 UK: Torque Vectoring For Automotive, By Vehicle Type, 2017–2025 (Usd Million)
Table 61 Turkey: Torque Vectoring For Automotive, By Vehicle Type, 2017—2025 (’000 Units)
Table 62 Turkey: Torque Vectoring For Automotive, By Vehicle Type, 2017–2025 (Usd Million)
Table 63 Rest of Europe: Torque Vectoring Market For Automotive, By Vehicle Type, 2017–2025 (’000 Units)
Table 64 Rest of Europe: Torque Vectoring Market For Automotive, By Vehicle Type, 2017–2025 (Usd Million)
Table 65 North America: Torque Vectoring For Automotive, By Country, 2017–2025 (’000 Units)
Table 66 North America: Torque Vectoring For Automotive, By Country, By Region, 2017–2025 (Usd Million)
Table 67 Canada: Torque Vectoring For Automotive, By Vehicle Type, 2017–2025 (’000 Units)
Table 68 Canada: Torque Vectoring For Automotive, By Vehicle Type, 2017–2025 (Usd Million)
Table 69 Mexico: Torque Vectoring For Automotive, By Vehicle Type, 2017–2025 (’000 Units)
Table 70 Mexico: Torque Vectoring For Automotive, By Vehicle Type, 2017–2025 (Usd Million)
Table 71 US: Torque Vectoring For Automotive, By Vehicle Type, 2017–2025 (’000 Units)
Table 72 US: Torque Vectoring For Automotive, By Vehicle Type, 2017–2025 (Usd Million)
Table 73 Row: Torque Vectoring For Automotive, By Country, 2017–2025 (’000 Units)
Table 74 Row: Torque Vectoring For Automotive, By Country, 2017–2025 (Usd Million)
Table 75 Brazil: Torque Vectoring For Automotive, By Vehicle Type, 2017–2025 (’000 Units)
Table 76 Brazil: Torque Vectoring For Automotive, By Vehicle Type, 2017–2025 (Usd Million)
Table 77 Iran: Torque Vectoring For Automotive, By Vehicle Type, 2017–2025 (’000 Units)
Table 78 Iran: Torque Vectoring For Automotive, By Vehicle Type, 2017–2025 (Usd Million)
Table 79 Rest of Row: Torque Vectoring Market For Automotive, By Vehicle Type, 2017–2025 (‘000 Units)
Table 80 Rest of Row: Torque Vectoring Market For Automotive, By Vehicle Type, 2017–2025 (Usd Million)
Table 81 New Product Developments, 2015–2018
Table 82 Expansions, 2015–2018
Table 83 Partnerships/Supply Contracts/Collaborations/Joint Ventures/Agreements/Mergers & Acquisitions, 2015–2018
List of Figures (39 Figures)
Figure 1 Torque Vectoring Market: Segmentations Covered
Figure 2 Torque Vectoring Market: Research Design
Figure 3 Research Design Model
Figure 4 Global Market: Bottom-Up Approach
Figure 5 Data Triangulation
Figure 6 Automotive Torque Vectoring: Market Dynamics
Figure 7 Automotive Torque Vectoring Market
Figure 8 Increased Demand For Luxury and Performance Vehicles To Boost The Growth of the Automotive Torque Vectoring Market From 2018 To 2025
Figure 9 Iran To Be The Fastest Growing Market, By Value, From 2018 To 2025
Figure 10 Passive Segment To Be The Largest Market In The Forecast Period
Figure 11 Hydraulic Segment To Be The Largest Market , 2018 Vs. 2025
Figure 12 Passenger Car Segment To Be The Largest Market, 2018 Vs. 2025
Figure 13 All-Wheel Drive/Four-Wheel Drive To Be The Largest Market, 2017 Vs. 2025
Figure 14 Europe To Be The Largest Market, 2018 Vs. 2025
Figure 15 Global Market: Market Dynamics
Figure 16 Suv Sales, By Vehicle Segment, 2012–2017 (’000 Units)
Figure 17 Rwd Vehicle Cornering
Figure 18 Fwd Vehicle Cornering
Figure 19 Working Of Torque Vectoring In RWD
Figure 20 Global Market, By Electric Vehicle Type, 2018 Vs. 2025 (Usd Million)
Figure 21 Global Market, By Clutch Actuation Type, 2018 Vs. 2025 (Usd Million)
Figure 22 Global Market, By Propulsion, 2018 Vs. 2025 (Usd Million)
Figure 23 Global Market, By Technology, 2018–2025 (Usd Million)
Figure 24 Global Market, By Region, 2018 (Value)
Figure 25 Global Market, By Vehicle Type, 2017–2025 (Usd Million)
Figure 26 Asia Pacific: Global Torque Vectoring Market Snapshot
Figure 27 Europe: Torque Vectoring Market Snapshot
Figure 28 Key Developments By Leading Players In This Market During 2015–2018
Figure 29 Gkn: Company Snapshot
Figure 30 American Axle: Company Snapshot
Figure 31 Dana: Company Snapshot
Figure 32 Borgwarner: Company Snapshot
Figure 33 Eaton: Company Snapshot
Figure 34 Zf: Company Snapshot
Figure 35 Jtekt: Company Snapshot
Figure 36 Magna : Company Snapshot
Figure 37 Bosch: Company Snapshot
Figure 38 Univance : Company Snapshot
Figure 39 Schaeffler : Company Snapshot


Growth opportunities and latent adjacency in Torque Vectoring Market