The study involved four major activities in estimating the current size of the sensor fusion market for automotive. Exhaustive secondary research was done to collect information on the market, the peer market, and the child markets. The next step was to validate these findings, assumptions, and sizing with the industry experts across value chains through primary research. The top-down and bottom-up approaches were employed to estimate the complete market size. Thereafter, market breakdown and data triangulation processes were used to estimate the market size of segments and subsegments.
Secondary Research
In the secondary research process, various secondary sources were used to identify and collect information for this study on the sensor fusion market for automotive. The secondary sources included annual reports, press releases, and investor presentations of companies; whitepapers, certified publications, and articles from recognized authors, directories, and databases; and articles from recognized associations and government publishing sources.
Primary Research
Extensive primary research was conducted after acquiring an understanding of the scenario of the sensor fusion market for automotive through secondary research. Several primary interviews were conducted with market experts from both the demand (OEMs) and supply (hardware providers, SOC providers, sensor fusion providers, and other component manufacturers) sides across three major regions, namely, North America, Europe and Asia Pacific. Approximately 52% and 48% of primary interviews were conducted from the demand and supply sides, respectively. Primary data was collected through questionnaires, emails, and telephonic interviews. In the canvassing of primaries, various departments within organizations were covered, such as sales, operations, and administration, to provide a holistic viewpoint in this report.
After interacting with industry experts, brief sessions with highly experienced independent consultants were also conducted to reinforce the findings from primaries. This, along with the in-house subject-matter experts’ opinions, led to the findings described in the remainder of this report.

To know about the assumptions considered for the study, download the pdf brochure
Market Size Estimation
The bottom-up approach was used to estimate and validate the size of the sensor fusion market for automotive. This method was also used extensively to estimate the size of various subsegments in the market. The research methodology used to estimate the market size includes the following:
-
The key players in the industry and markets have been identified through extensive secondary research
-
The industry’s supply chain and market size, in terms of volume, have been determined through primary and secondary research processes
-
All percentage shares, splits, and breakdowns have been determined using secondary sources and verified through primary sources

To know about the assumptions considered for the study, Request for Free Sample Report
Market Size Validation
The top-down approach was used to determine the size of the sensor fusion market for automotive for the component, software, propulsion, vehicle type, sensor platform approach, and sensor fusion process. The total market size in value (USD million) was derived using the top-down approach.
For instance, the market for the component segment was derived using the top-down approach to estimate the hardware and software subsegments. Mapping was carried out at the regional level to understand the contribution by type of component. The market size was derived at the regional level in terms of value. The total value of the market was multiplied by the cost penetration percentage of each segment at the regional level.

Data Triangulation
After arriving at the overall market size of the global market through the above-mentioned methodology, this market was split into several segments and subsegments. The data triangulation and market breakdown procedure were employed, wherever applicable, to complete the overall market engineering process and arrive at the exact market value data for the key segments and subsegments. The extrapolated market data was triangulated by studying various macro indicators and regional trends from both the demand- and supply-side participants.
Market Definition
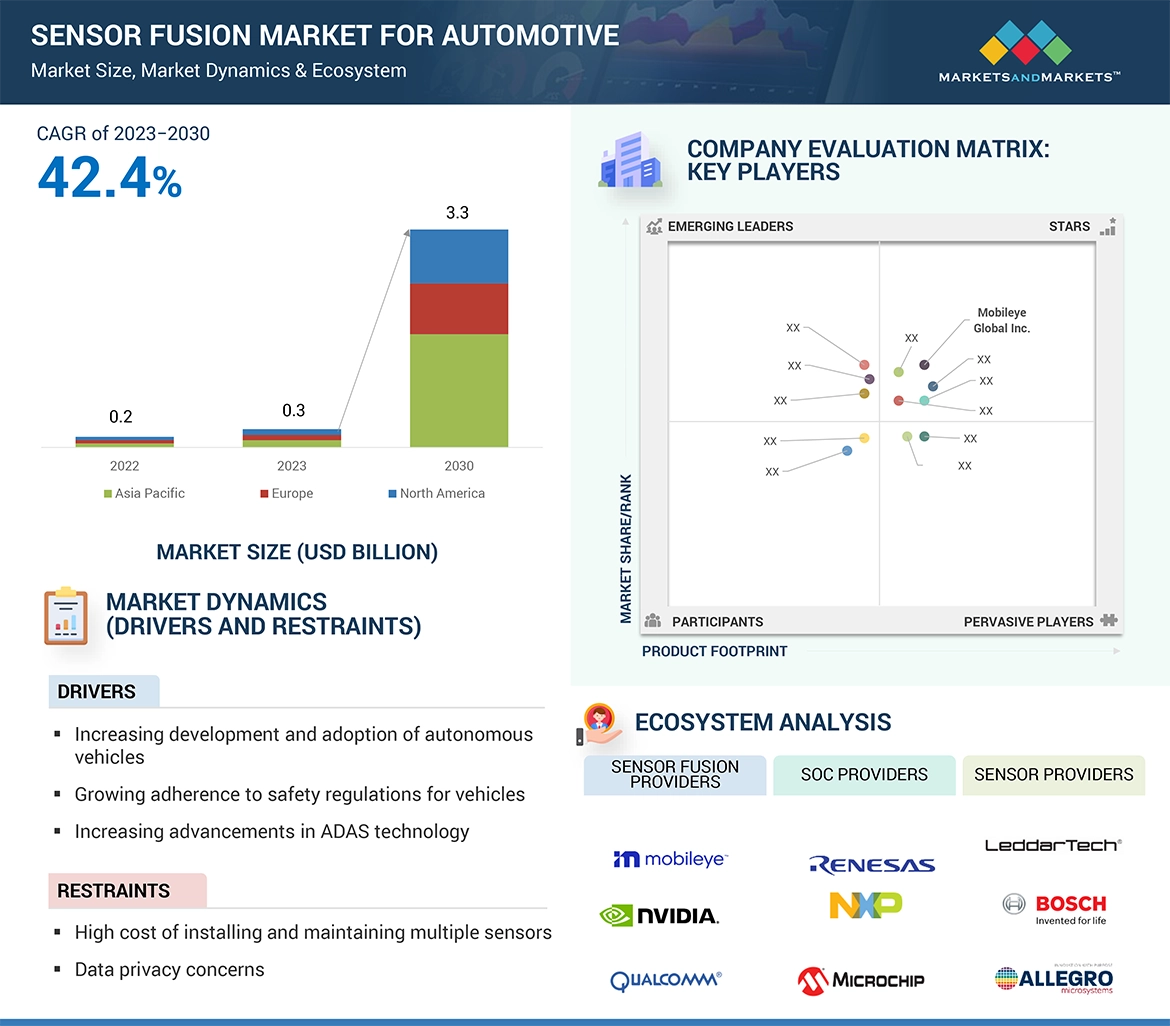
Sensor fusion is the process of combining data from multiple sensors to create a more comprehensive and accurate representation of the environment. It is used in a variety of applications, including autonomous vehicles, advanced driver assistance systems (ADAS). In vehicles, sensor fusion is used to improve the accuracy and reliability of perception systems. Perception systems are responsible for understanding the vehicle's surroundings, including the presence and location of other vehicles, pedestrians, cyclists, and objects.
List of Key Stakeholders
-
Automotive Sensor Manufacturers
-
ADAS Integrators
-
ADAS Solution Suppliers
-
Automotive Component Manufacturers
-
Automotive SoC (system on chip) and ECU (electronic control unit) Manufacturers
-
Automotive Software and Platform Providers
-
Autonomous Driving Platform Providers
-
Connectivity Service Providers
-
Country-specific Automotive Associations
-
Designing and Testing Companies
-
European Automobile Manufacturers’ Association (ACEA)
-
National Highway Traffic Safety Administration (NHTSA)
Report Objectives
-
To segment and forecast the sensors fusion market in terms of volume (thousand units) and value (USD million)
-
To define, describe, and forecast the sensor fusion market based on technology, level of autonomy, application, data fusion type, fusion level, EV type, vehicle type, sensor platform approach, algorithm and region
-
To segment the market and forecast its size, by volume and value, based on region (Asia Pacific, Europe, and North America)
-
To analyze and forecast the sensor fusion market for automotive based on fusion level (data, feature, and decision)
-
To analyze and forecast the market based on sensor platform approach (low-level fusion, mid-level fusion, high-level fusion)
-
To qualitatively analyze the market based on data fusion type (homogeneous and heterogeneous)
-
To analyze and forecast the market based on ICE vehicle type [passenger car, light commercial vehicle (LCV), and heavy commercial vehicle (HCV)]
-
To analyze and forecast the market based on electric vehicle type [battery electric vehicle (BEV), plug-in hybrid electric vehicle (PHEV) and fuel-cell electric vehicle (FCEV)]
-
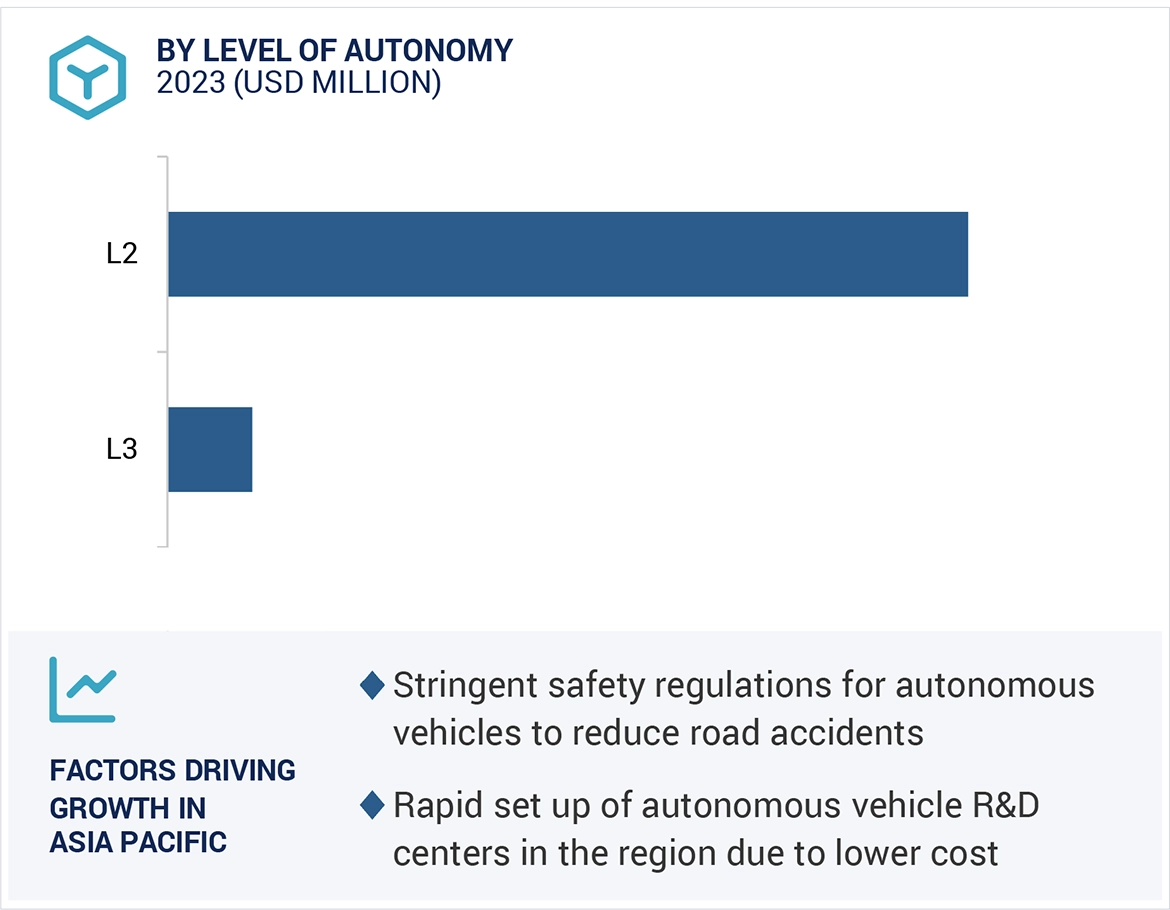
To analyze and forecast the market based on by level of autonomy (L2, L3, and L4)
-
To qualitatively analyze the market based on sensor type[Camera, Radar, Lidar, Ultrasonic Sensor, Infrared Sensor]
-
To qualitatively analyze the market based on Algorithm [Kalman filter, Bayesian filter, central limit theorem, convolutional neural network]
-
To analyze and forecast the market based on technology [ADAS, autonomous driving]
-
To analyze the technological developments impacting the sensor fusion market
-
To analyze opportunities for stakeholders and the competitive landscape for market leaders
-
To provide detailed information regarding the major factors influencing the market growth (drivers, challenges, restraints, and opportunities)
-
To strategically analyze markets with respect to individual growth trends, prospects, and contributions to the total market
-
To study the following with respect to the market
-
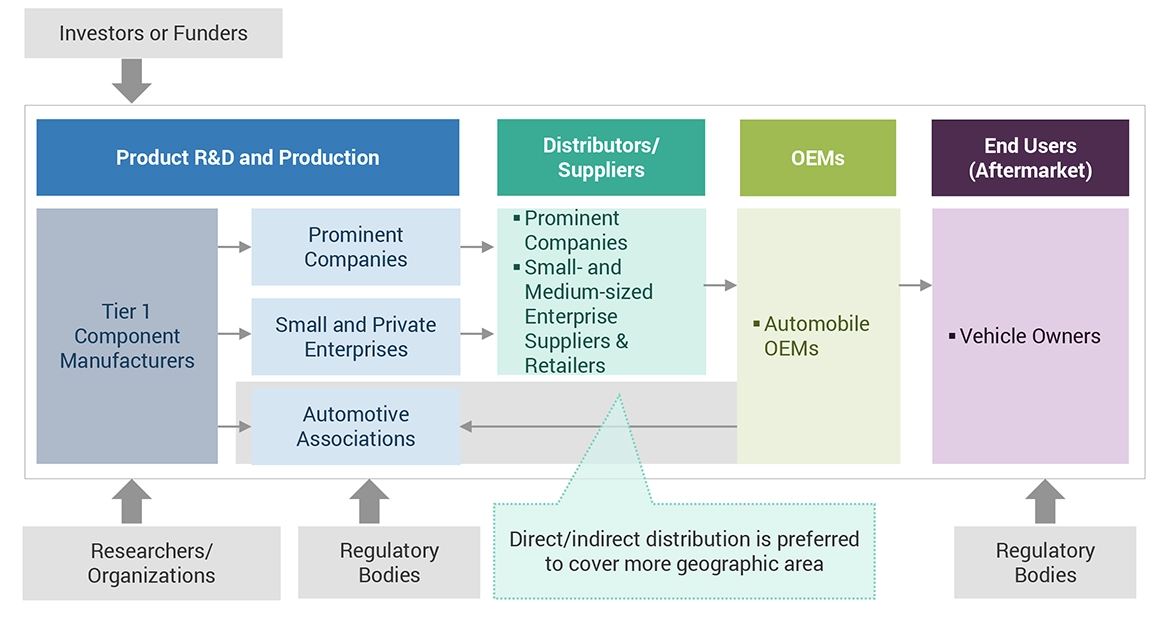
Value Chain Analysis
-
Ecosystem Analysis
-
Porter’s Five Forces Analysis
-
Technology Analysis
-
Case Study Analysis
-
Patent Analysis
-
Buying Criteria
-
To strategically profile key players and comprehensively analyze their market shares and core competencies
-
To track and analyze competitive developments such as deals (joint ventures, mergers & acquisitions, partnerships, collaborations), new product developments, and other activities carried out by key industry participants
Available Customizations
With the given market data, MarketsandMarkets offers customizations in line with company-specific needs.
-
Further breakdown of the sensor fusion market for automotive, by vehicle type
-
Additional countries (apart from those already considered in report) with significant sensor fusion market
Company Information
-
Profiles of additional market players (up to five)


Growth opportunities and latent adjacency in Sensor Fusion Market