The study involved four major activities to estimate the current size of the automotive software market. Exhaustive secondary research was done to collect information on the market, the peer market, and model mapping. The next step was to validate these findings, assumptions, and sizing with the industry experts across value chains through primary research. The bottom-up and top-down approaches were employed to estimate the total market size. After that, market breakdown and data triangulation were used for determining the market size of segments and subsegments.
Secondary Research
Secondary sources referred to for this research study included automotive industry organizations involved with automotive software; publications from government sources [such as country level automotive associations and organizations, Organisation for Economic Co-operation and Development (OECD), World Bank, CDC, and Eurostat]; corporate filings (annual reports, investor presentations, and financial statements); and trade, business, and automotive associations. Secondary data was collected and analyzed to arrive at the overall market size, which was further validated through primary research.
Primary Research
Extensive primary research was conducted after acquiring an understanding of the automotive software market scenario through secondary research. Several primary interviews were conducted with market experts from both the demand (OEMs) and supply (automotive software providers, technology providers, and component manufacturers) sides across major regions, namely North America, Europe, Asia Pacific, Latin America, and the Rest of the World. Approximately 40% and 60% of primary interviews were conducted from the demand and supply sides, respectively. Primary data was collected through questionnaires, emails, and telephonic interviews.
In the canvassing of primaries, various departments within organizations, such as sales, operations, and marketing, were covered to provide a holistic viewpoint in the report. After interacting with industry experts, brief sessions were conducted with highly experienced independent consultants to reinforce the findings from primaries. This, along with the in-house subject matter experts’ opinions, led to the findings described in the remainder of this report.

To know about the assumptions considered for the study, download the pdf brochure
Market Size Estimation
The bottom-up and top-down approaches have been used to estimate and validate the size of the automotive software market. The market, by vehicle type, in terms of value, is derived by identifying the value of software for each application for all vehicle types at the country level. The value of software is derived by multiplying the vehicle production at country level for each vehicle type with the penetration of each ICE applications. This value is further multiplied with number of ECUs per application and the software cost of ECU per application at country level. The country-level market is summed up to derive the regional market, and the regional market is summed up to derive the global market. A similar approach is applied to derive the market for EV applications.
-
The key players in the industry and markets have been identified through extensive secondary research.
-
The industry’s future supply chain and market size, in terms of value, have been determined through primary and secondary research processes.
-
All percentage shares, splits, and breakdowns have been determined using secondary sources and verified through primary sources.
Global Automotive Software Market Size: Bottom-Up Approach

To know about the assumptions considered for the study, Request for Free Sample Report
Data Triangulation
After arriving at the overall market size of the global market through the above-mentioned methodology, this market was split into several segments and subsegments. The data triangulation and market breakdown procedure were employed, wherever applicable, to complete the overall market engineering process and arrive at the exact market value data for the key segments and subsegments. The extrapolated market data was triangulated by studying various macro indicators and regional trends from both the demand- and supply-side participants.
Market Definition
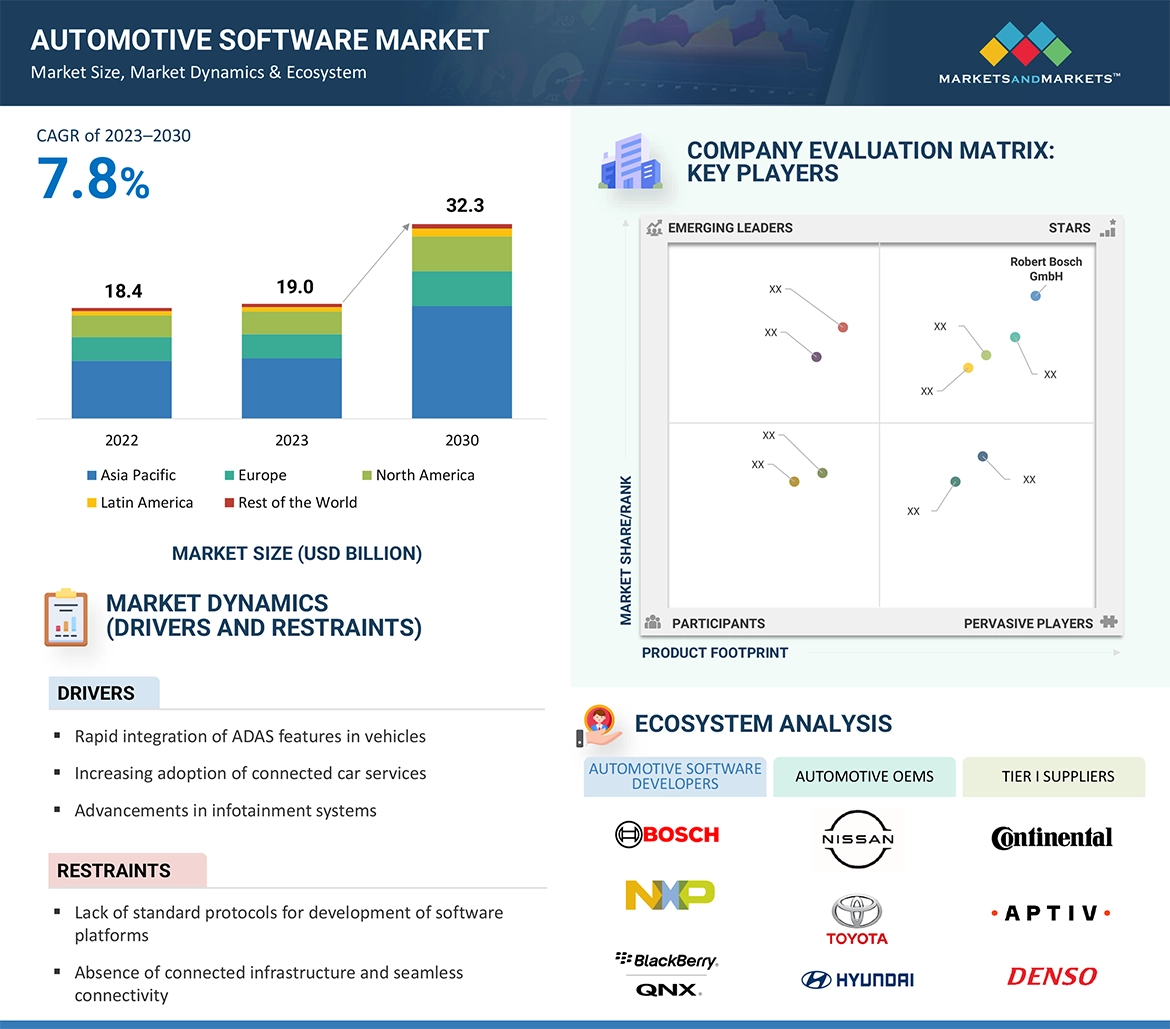
Automotive Software: Automotive software is a collected programmable data instruction used for performing operations of computer-based in-vehicle applications. It also refers to the software used for in-vehicle embedded systems. Computer-based in-vehicle applications include telematics, infotainment, powertrain, body control and comfort, communication, advanced driver assistance systems (ADAS), and safety
Key Stakeholders
-
ADAS Manufacturers
-
Associations, Forums, and Alliances Related to Automotive Software
-
Authorized and Independent Automobile Service Centers
-
Automotive Component Manufacturers
-
Automotive Cybersecurity Providers
-
Automotive Dealers and Distributors
-
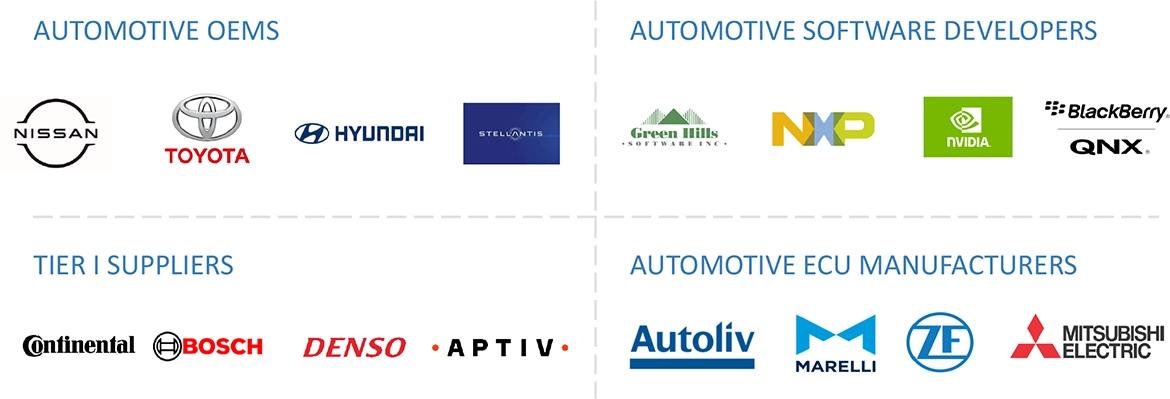
Automotive Electronic Control Unit Manufacturers
-
Automotive OEMs
-
Automotive Software Consortiums
-
Automotive Component Manufacturers
-
Automotive Software Manufacturers
-
Automotive Telematics Control Unit Manufacturers
-
Autonomous Vehicle Manufacturers
-
Autonomous Vehicle System Suppliers
-
ECU Manufacturers
-
Electrical and Electronic Component Suppliers
-
EV Charging Manufacturers and Service Providers
-
EV Component Manufacturers
-
EV Manufacturers
-
Legal and Regulatory Authorities
-
Raw Material Suppliers for Automotive OEMs
-
Raw Material Suppliers for Automotive Software or Components
-
Sensor Manufacturers
-
Vehicle Safety Regulatory Bodies
-
Network Providers
-
SOS Services Providers
Report Objectives
-
To define, describe, and forecast the global automotive software market based on software layer, ICE application, EV application, vehicle type, and region
-
To segment and forecast the market size by software layer (operating system, middleware, and application software)
-
To segment and forecast the market size by ICE application (ADAS & safety systems, autonomous driving, body & comfort systems, infotainment systems, engine management & powertrain, and vehicle telematics)
-
To segment and forecast the market size by EV application (electric drive, battery management systems, ADAS & safety systems, autonomous driving, body control & comfort systems, infotainment systems, engine management & powertrain, and vehicle telematics)
-
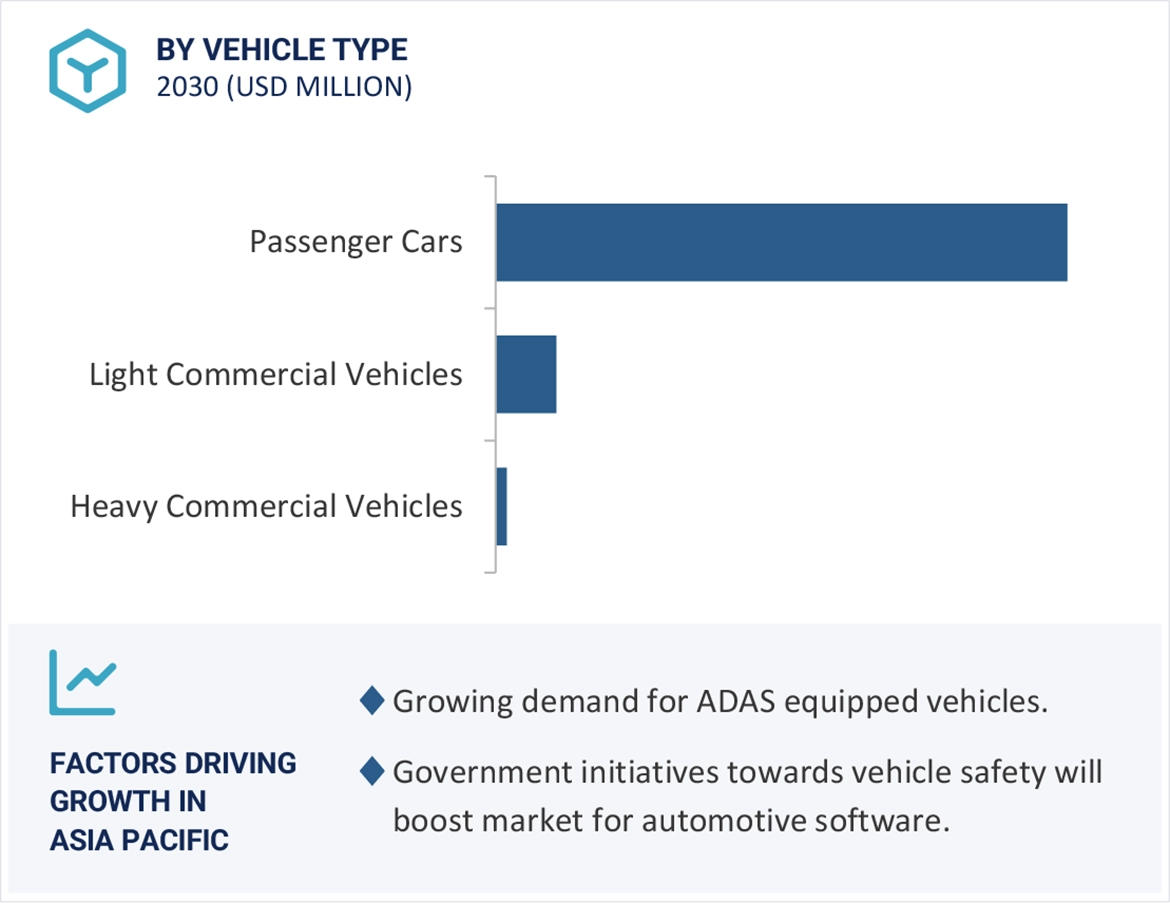
To segment and forecast the market size by vehicle type (passenger cars, light commercial vehicles, and heavy commercial vehicles)
-
To forecast the market size with respect to key regions, namely Asia Pacific, Europe, North America, Latin America, and the Rest of the World
Available Customizations
With the given market data, MarketsandMarkets offers customizations in accordance to the company’s specific needs.
-
Automotive Software Market, by EV Application, at Country Level (for countries covered in the report)
-
Automotive Software Market, by Vehicle Type, at Country Level (for countries covered in the report)
-
Profiling of Additional Market Players (Up to 5)


santhi
Nov, 2020
Great job! Hats off to your clarity, your article was very informative and it was very useful for developers. .