The research methodology used in estimating the current size of the battery coating market included four major activities. Extensive secondary research was performed to acquire detailed information about the market, peer markets, and parent markets. These findings, assumptions, and metrics were verified through primary research with experts from the demand side of the battery coating value chain. Both top-down and bottom-up approaches were used to estimate the total market size. The market sizes of various segments and subsegments were estimated finally with the help of complete market segmentation and data triangulation techniques.
Secondary Research
The research methodology for estimating and forecasting the battery coating market begins with gathering data on key vendor's revenues through secondary research. The secondary research process involves consulting various secondary sources, including Hoovers, Bloomberg BusinessWeek, Factiva, the World Bank, and industry journals. These secondary sources encompass annual reports, press releases, investor presentations, white papers, certified publications, articles from recognized authors, regulatory notifications, trade directories, and databases. Also, vendor offerings are taken into consideration to inform market segmentation.
Primary Research
The battery coating market comprises several stakeholders in the supply chain, such as raw material suppliers, battery manufacturers, distributors, contractors/sub-contractors, infrastructure OEM and system integrators, and end users. The development of EV, technology, telecommunications, finance and banking, retail and e-commerce, healthcare, government & public sector, and education defines the demand side of this market. Interviews were conducted with various primary sources on both the supply and demand sides of the market to gather qualitative and quantitative data.
Following is the breakdown of the primary respondents:
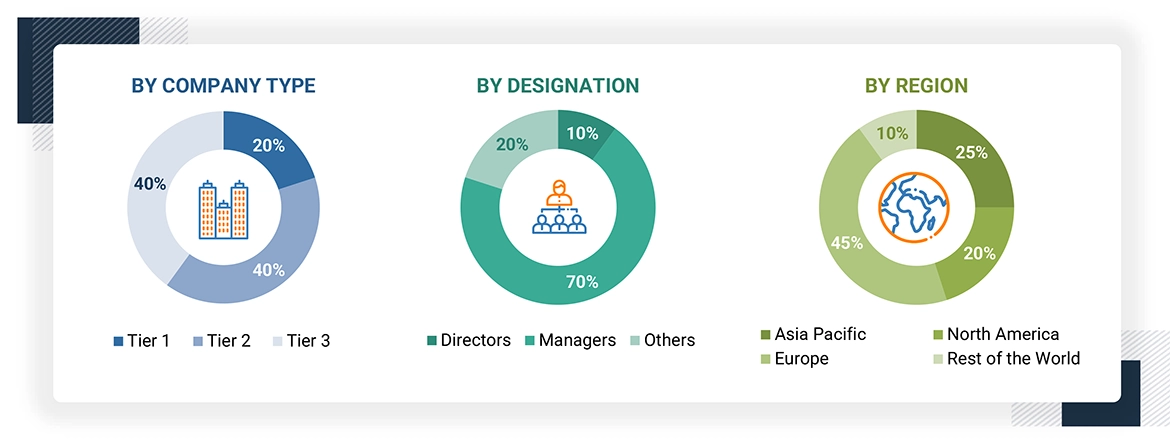
To know about the assumptions considered for the study, download the pdf brochure
Market Size Estimation
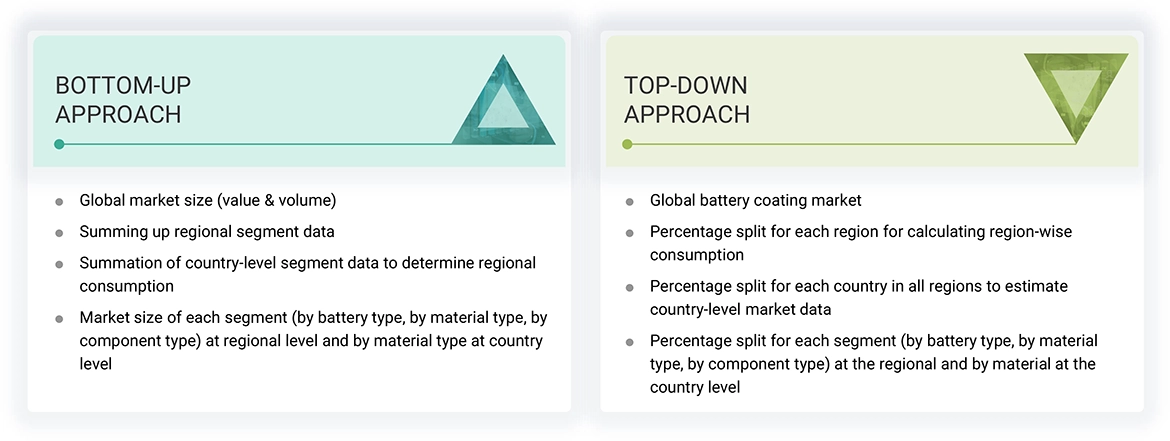
Top-down and bottom-up approaches were used to estimate and validate the size of the battery coating market. These methods were used to determine the market size of various segments. The research methodology used for the market size estimation is as follows:
-
Extensive primary and secondary research was done to identify the key players.
-
The value chain and market size of the battery coating market, in terms of value, were determined through primary and secondary research.
-
All percentage shares, splits, and breakdowns were collected through secondary sources and verified through primary sources.
-
All possible parameters that affect the market were covered in this research study and are viewed in extensive detail, verified through primary research, and analyzed to obtain the final quantitative and qualitative data.
-
This research includes the study of reports, reviews, and newsletters of top market players, along with extensive interviews for opinions from key leaders, such as CEOs, directors, and marketing executives.
Data Triangulation
After estimating the overall market size using the above estimation, the market was split into various segments and subsegments. Data triangulation, market breakup techniques, and the market engineering process were used to reach the exact market analysis data for each segment and subsegment. Research Methodology The research methodology used to estimate and forecast the global market size began by first aggregating data and information from the country and different levels.
Market Definition
Battery coating is a recently introduced concept that enhances battery life and performance. Coatings are applied to battery components such as electrodes, separators, and battery packs. The materials used for coating electrodes are primarily oxides, carbons, fluorides, and phosphates, whereas those for separators are ceramics, alumina, and PVDF. These coatings are applied using techniques such as atomic layer deposition (ALD), plasma–enhanced chemical vapor deposition (PECVD), physical vapor deposition (PVD), spray coating, and powder coating. These advanced coating techniques are mainly applied in lithium-ion batteries due to the vast utilization of the batteries in various end-use industries such as automotive, consumer electronics, and energy storage. Battery coating for lithium-ion batteries is commercialized, but its market is in the introductory stage.
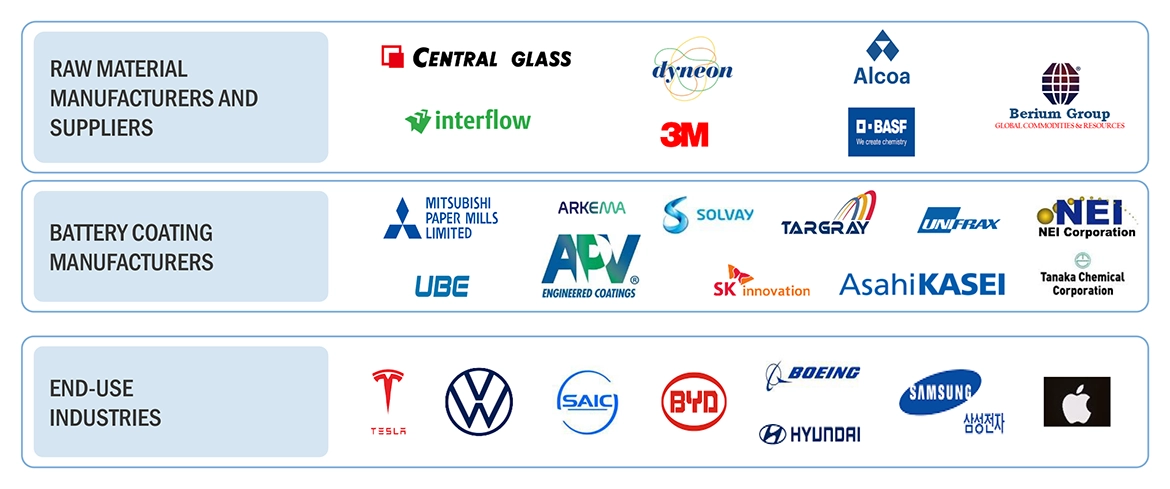
Stakeholders
-
Battery Manufacturers and Coating Material Manufacturers
-
Electric Vehicle (EV) Manufacturers
-
Material Suppliers
-
Research and Development Institutions
-
Energy Storage Providers
-
Regulatory Bodies
-
NGOs, Governments, Investment Banks, Venture Capitalists, and Private Equity Firms
Report Objectives
-
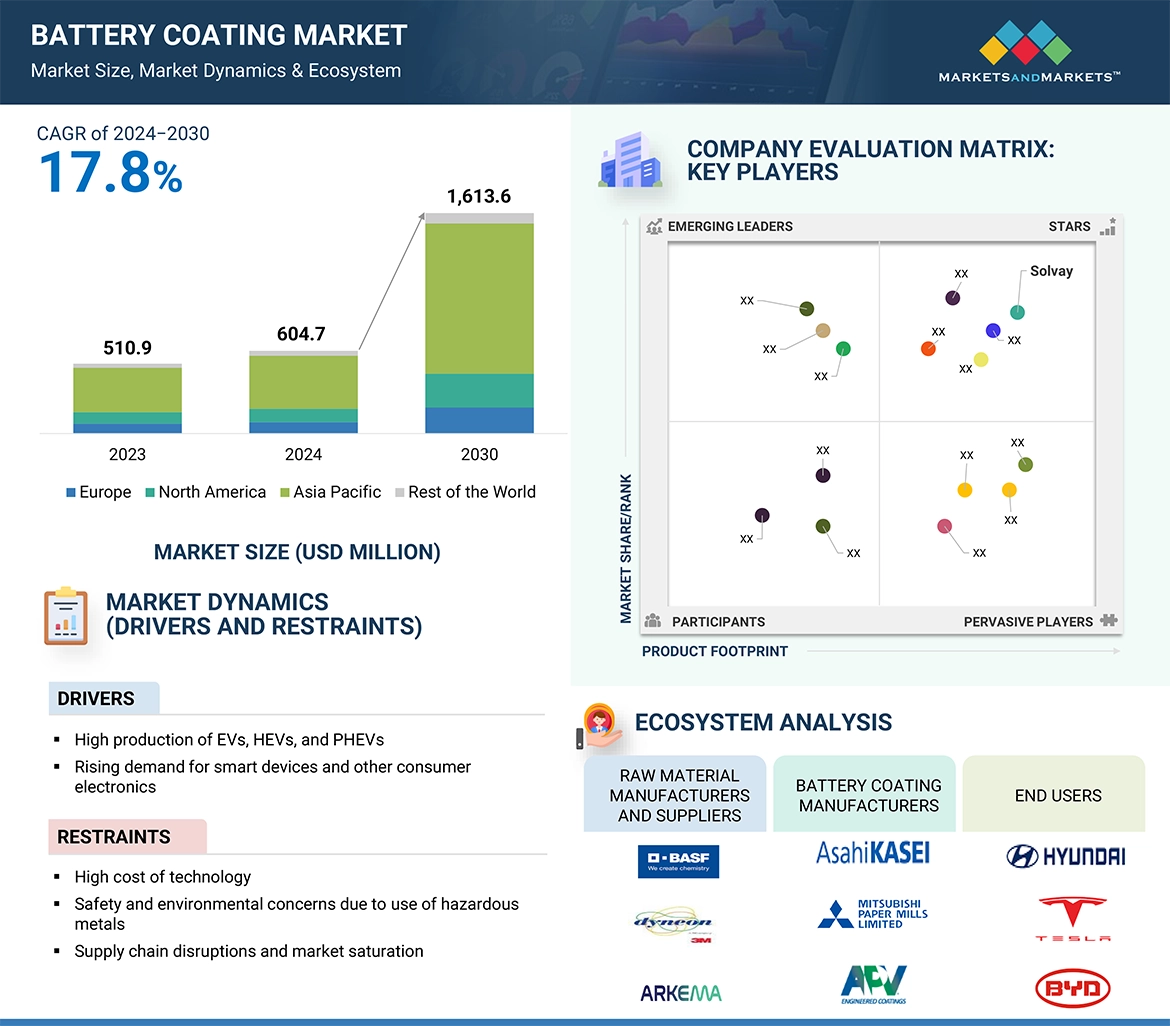
To define, describe, and forecast the size of the global battery coating market in terms of value and volume.
-
To provide detailed information regarding the key factors, such as drivers, restraints, opportunities, and industry-specific challenges, influencing the growth of the battery coating market
-
To analyze and forecast the size of various segments (insulation, material, and application) of the battery coating market based on four major regions—North America, Europe, Asia Pacific, and the Rest of the World—along with key countries in each region.
-
To analyze recent developments and competitive strategies, such as expansions, new product developments, partnerships, and acquisitions, to draw the market's competitive landscape.
-
To strategically profile the key players in the market and comprehensively analyze their core competencies.


 HIGHEST CAGR MARKET IN 2023
 CHINA FASTEST GROWING MARKET IN THE REGION
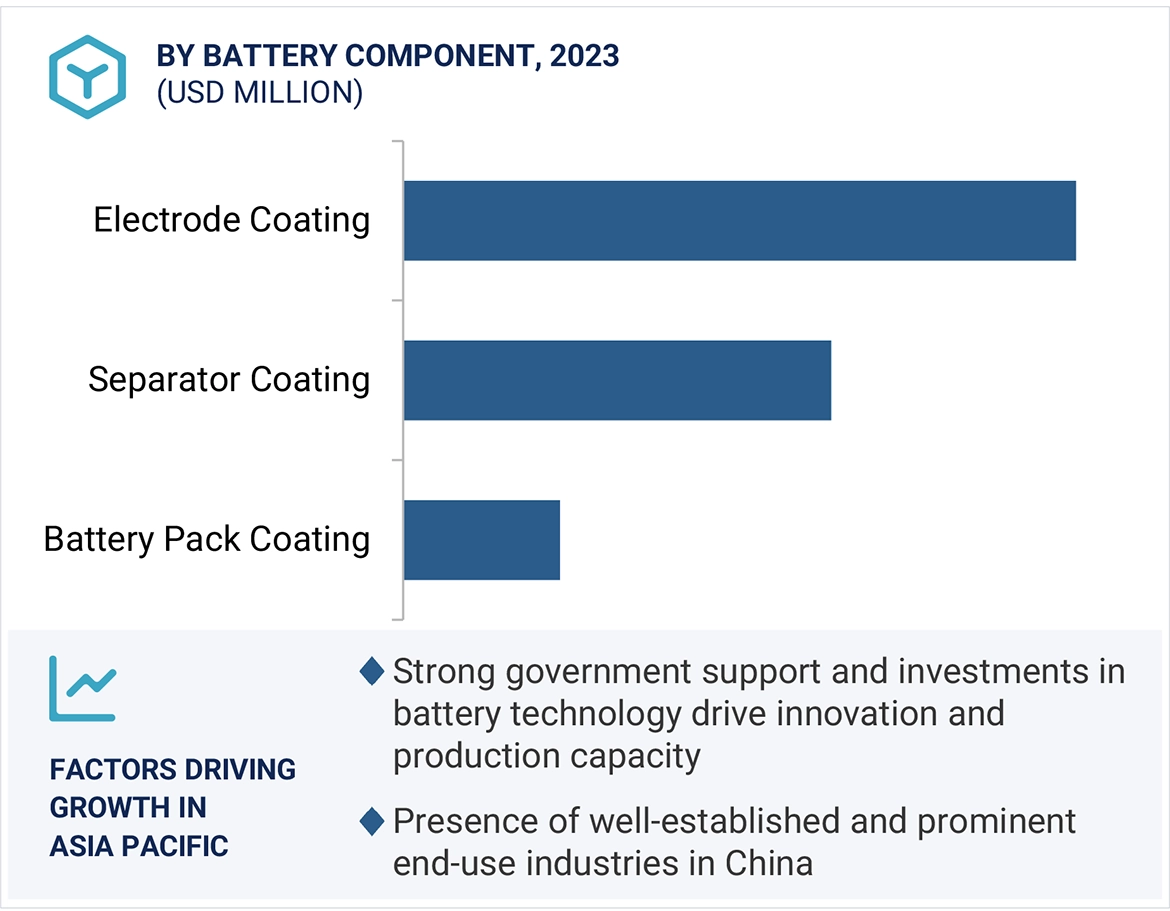


Growth opportunities and latent adjacency in Battery Coating Market