Beneficial Insects Market by Application (Crop protection, Crop production), Type (Predators, Parasitoids, Pathogens, and Pollinators), Crop Type (Fruits & Vegetables, Flowers & Ornamentals, and Grains & Pulses) and Region - Global Forecast to 2028
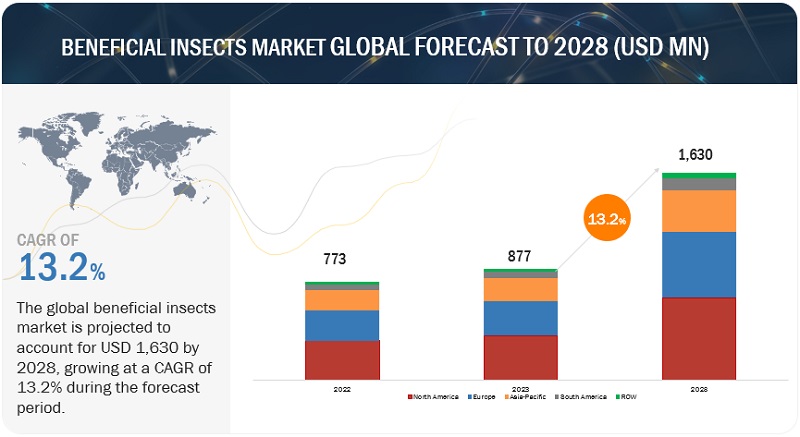
The global beneficial insects market size was valued at US$ 773 million in 2022 and is poised to grow from US$ 877 million in 2023 to US$ 1,630 million by 2028, growing at a CAGR of 13.2% in the forecast period (2023-2028). The hazardous effects on the environment as a consequence of using chemical pesticides which are known to have carcinogenic effects on plants and animals are driving the market for beneficial insects. Beneficial insects are an alternative to chemical pesticides; they are highly valuable insects and mites that eat or parasitize target pests. The rising demand for organic farming increases the rise in demand for beneficial insects driving the beneficial insects market.
To know about the assumptions considered for the study, Request for Free Sample Report
To know about the assumptions considered for the study, download the pdf brochure
Beneficial Insects Market Dynamics
Driver: The rising demand for organic farming increases the rise in demand for beneficial insects.
The rising demand for organic farming has led to an increased demand for beneficial insects. As consumers become more conscious of the health and environmental impacts of conventional farming practices, there is a growing preference for organic produce. Organic farming relies on natural and sustainable methods of pest control, which aligns perfectly with the use of beneficial insects. These insects, such as ladybugs, lacewings, and parasitic wasps, are utilized to combat pests in a natural and eco-friendly way. They help maintain a balance in the ecosystem by targeting specific pests, reducing the need for chemical pesticides. The surge in organic farming has created a strong market demand for beneficial insects, as farmers seek efficient and environmentally safe alternatives for pest management. This increased demand highlights the pivotal role that beneficial insects play in supporting the growth of organic farming and fulfilling consumer preferences for healthier and more sustainable agricultural practices.
Restraint: Knowledge Gap and Implementation Challenges.
One restraining factor of beneficial insects in agricultural land is the lack of knowledge and awareness among farmers regarding their identification, management, and integration into existing farming practices. Many farmers may not be familiar with the specific beneficial insect species that are effective in controlling pests, or they may lack the necessary understanding of their life cycles and behavior. This can result in underutilization or improper implementation of beneficial insects, limiting their impact on pest control. Additionally, farmers may have concerns about the cost and accessibility of beneficial insects, as well as uncertainties regarding their effectiveness compared to chemical pesticides. These factors can function as barriers to the widespread adoption of beneficial insects in agriculture. Addressing these knowledge gaps through education and training programs, providing easy access to beneficial insect populations, and demonstrating their efficacy through research and case studies can help overcome this restraining factor and promote the broader use of beneficial insects in agricultural land.
Opportunity: Ease of Management in Controlled Environments for Beneficial Insects
Beneficial insects offer an opportunity for easy management in controlled environments. Unlike chemical pesticides, these insects can be conveniently deployed and monitored in controlled settings such as greenhouses or indoor farms. With regulated temperature, humidity, and lighting, the controlled environment creates optimal conditions for beneficial insect populations to thrive. This enhances their reproduction, survival, and pest control capabilities. Additionally, managing beneficial insects in controlled environments allows for precision agriculture, as farmers can closely monitor their performance and target specific pests. The ease of management in controlled environments presents an opportunity to maximize the effectiveness of beneficial insects, promoting sustainable agriculture and consistent crop protection outcomes.
Challenge: Reluctance among Farmers to Adopt Beneficial Insects.
A significant challenge in the adoption of beneficial insects is the reluctance among farmers to embrace this alternative pest control method. Limited awareness and knowledge about the benefits and effectiveness of beneficial insects contribute to this hesitation. Concerns about the economic viability and initial investment, compared to chemical pesticides, may deter farmers from exploring this option. The perceived complexity of managing beneficial insects, including handling and monitoring, can also be a deterrent. Additionally, resistance to change and reliance on traditional farming practices hinder the adoption of beneficial insects. Overcoming these challenges requires targeted education, training, and knowledge-sharing initiatives to highlight the benefits, cost-effectiveness, and proper management of beneficial insects in agriculture.
Beneficial Insects Market Ecosystem
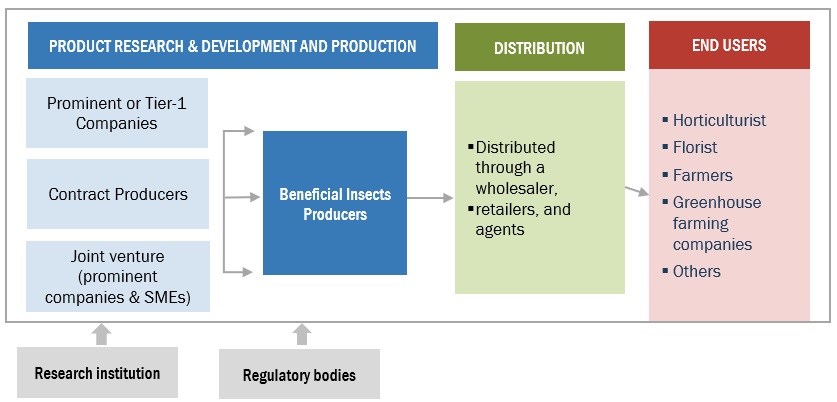
Prominent companies in this market include well-established, financially stable manufacturers of beneficial insects. These companies have been operating in the market for several years and possess state-of-the-art technologies, a diversified product portfolio, and strong global sales and marketing networks. Prominent companies in this market include Applied Bio-nomics Ltd (Canada), Biobest Group NV (Belgium), Bioline AgroSciences Ltd (UK), Fargro Limited (UK), Andermatt Group AG (Switzerland), ARBICO Organics (US), BioBee Ltd (Israel), BIONEMA (UK), Koppert (Netherlands), Tip Top Bio-Control (US).
Increasing environmental concerns drive the adoption of beneficial insects.
The growing environmental concerns surrounding the harmful impacts of pesticides serve as a strong driver for the adoption of beneficial insects in agriculture. As awareness about the negative consequences of pesticide use on water and air pollution, soil degradation, and human health continues to rise, there is a pressing need for more sustainable pest control methods. Beneficial insects, being a natural and eco-friendly alternative, align perfectly with the goal of environmental preservation. Their ability to effectively control pests without leaving hazardous residues in the environment or food chain makes them an attractive solution for farmers seeking to reduce their ecological footprint. As a result, the increasing environmental concerns serve as a powerful driver, encouraging the widespread adoption of beneficial insects as a safer and more sustainable approach to crop protection.
Growing demand for pest-specific bio-control agents drive the adoption of beneficial insects.
The increasing demand for pest-specific bio-control agents is a significant driver behind the adoption of beneficial insects in agriculture. Farmers recognize the importance of using host-specific natural enemies as a targeted approach to pest control. The ability of beneficial insects to selectively target and eradicate specific pests while sparing other beneficial insects in the field is highly valued. The concept of a host range, where beneficial insects prey on specific pest species, ensures accurate and efficient pest management. This emphasis on pest specificity aligns with the growing demand for sustainable and environmentally friendly agricultural practices. As a result, the rising demand for pest-specific bio-control agents fuel the adoption of beneficial insects as an effective solution to address specific pest challenges, promoting integrated pest management strategies and reducing reliance on chemical pesticides.
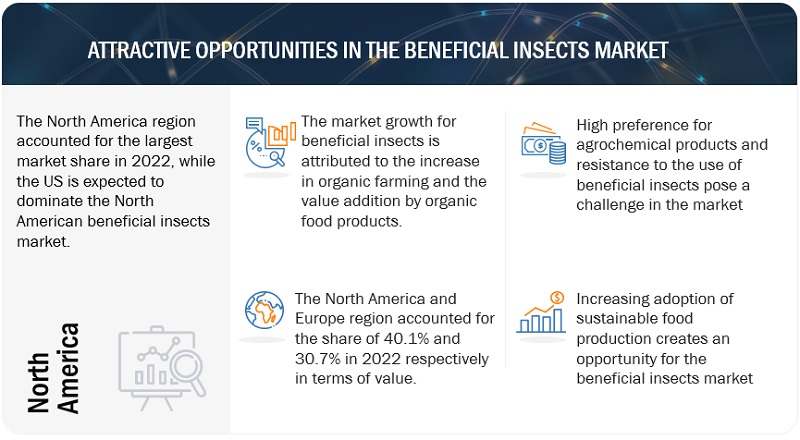
North America is expected to dominate its market share in the market during the forecast period.
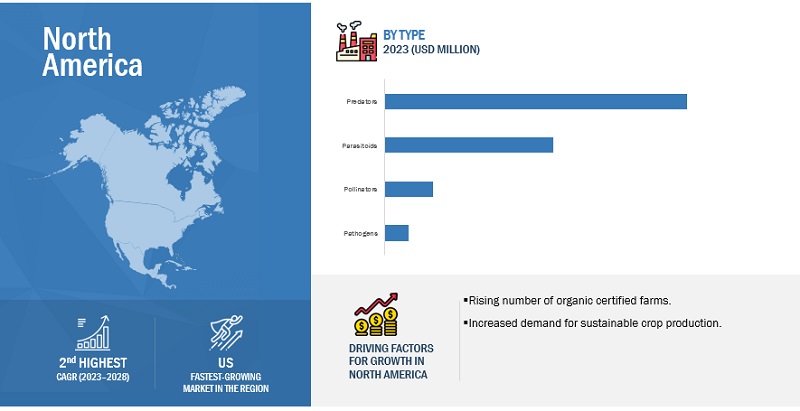
The beneficial insects market in the world is dominated by North America. Beneficial insects are one of the crop protection market's fastest-growing segments in North America. Due to growing consumer concern over their health and the environment, there is an increase in the market for organic crop protection solutions in North America. The consumption of organic products has also been heavily promoted because they don't include synthetic chemicals that leave behind residues and support the expansion of the beneficial insects market in North America.
Key Market Players
The key players in this include Applied Bio-nomics Ltd (Canada), Biobest Group NV (Belgium), Bioline AgroSciences Ltd (UK), Fargro Limited (UK), Andermatt Group AG (Switzerland), ARBICO Organics (US), BioBee Ltd (Israel), BIONEMA (UK), Koppert (Netherlands), Tip Top Bio-Control (US). These players in this market are focusing on increasing their presence by extending their product portfolio. These companies have a strong presence in North America, Asia Pacific, and Europe. They also have manufacturing facilities along with strong distribution networks across these regions.
Scope of the Report
|
Report Metric |
Details |
|
Market size estimation |
2023–2028 |
|
Base year considered |
2022 |
|
Forecast period considered |
2023–2028 |
|
Units considered |
Value (USD Million) |
|
Segments Covered |
By type, By Application, By Crop |
|
Regions covered |
North America, South America, Europe, Asia Pacific, and RoW |
|
Companies studied |
|
Report Scope
By type
- Predators
- Parasitoids
- Pathogens
- Pollinators
By application
- Crop protection
- Crop production
By crop type
- Fruits & vegetables
- Flowers & ornamentals
- Grains and pulses
By Region
- North America
- Europe
- Asia Pacific
- South America
- RoW
Recent Developments
- In August-2023, Biobest Group NV (Belgium) acquired Agronologica Unip. Lda. (Portugal), which will allow enhanced access to Biobest’s technical expertise, product portfolio, and optimized logistics, in Portugal for Agronologica.
- In May-2023, The Bionema (UK) introduced a new Digital Biocontrol Training platform to assist end-users in realizing the full potential of their highly successful biological-based crop protection and enhancement products the digital training platform opens with the application of biological insecticides.
- In MAY-2022, Bioline Agrosciences (UK) acquired Dudutech (Kenya), with this expansion in Africa to promote new environmental-friendly technologies in agriculture will help them to tap into the African market and promote new environmentally friendly technologies in agriculture.
Frequently Asked Questions (FAQ):
How big is the beneficial insects market?
The beneficial insects market is anticipated to increase from US$ 877 million in 2023 to US$ 1,630 million in 2028, at a compound annual growth rate (CAGR) of 13.2%.
Which players are involved in the manufacturing of beneficial insects market?
The key players in this market include Applied Bio-nomics Ltd (Canada), Biobest Group NV (Belgium), Bioline AgroSciences Ltd (UK), Fargro Limited (UK), Andermatt Group AG (Switzerland), ARBICO Organics (US), BioBee Ltd (Israel), BIONEMA (UK), Koppert (Netherlands), Tip Top Bio-Control (US). These players in this market are focusing on increasing their presence by extending their product portfolio.
Is there Oceania (New Zealand and Australia) specific information (market size, players, growth rate) for the beneficial insects market?
On request, We will provide details on market size, key players, growth rate of this industry in the Oceania region. Also, you can let us know if there are any other countries of your interest.
What is the future growth potential of the beneficial insects market?
The future growth potential of the beneficial insects market appears promising, driven by several key factors. Firstly, there is a growing demand for sustainable agriculture solutions amid increasing concerns about the environmental and health impacts of chemical pesticides. Beneficial insects offer an eco-friendly alternative, aligning with the preferences of consumers and regulatory trends favoring sustainable practices. Secondly, the expansion of Integrated Pest Management (IPM) practices worldwide further boosts the market, as beneficial insects play a crucial role in these approaches by serving as natural enemies of pests. Thirdly, their rising adoption across various agricultural sectors, including horticulture and greenhouse production, reflects a broader shift towards safer and more sustainable pest control methods.
What are the key challenges faced in the beneficial insects market?
Reluctance among farmers to adopt beneficial insects is the major key challenge for the beneficial insects market.
To speak to our analyst for a discussion on the above findings, click Speak to Analyst


- 5.1 INTRODUCTION
-
5.2 MACROECONOMIC INDICATORSINCREASE IN ORGANIC AGRICULTURAL PRACTICES
-
5.3 MARKET DYNAMICSDRIVERS- Harmful effects of synthetic plant protection products- Increased resistance of insects and weeds to pesticides- Rising interest in organic foodsRESTRAINTS- Knowledge gap and implementation challengesOPPORTUNITIES- Increased effectiveness of beneficial insects in controlled environment- Sustained global food productionCHALLENGES- Economic hurdles to adopting beneficial insects
- 6.1 INTRODUCTION
-
6.2 VALUE CHAIN ANALYSISRESEARCH AND PRODUCT DEVELOPMENTSOURCINGPRODUCTIONMARKETING, SALES, LOGISTICS, AND RETAIL
- 6.3 SUPPLY CHAIN ANALYSIS
-
6.4 TECHNOLOGY ANALYSISGENETIC IMPROVEMENT AND SELECTIVE BREEDING
-
6.5 PATENT ANALYSISLIST OF MAJOR PATENTS PERTAINING TO BENEFICIAL INSECTS MARKET
-
6.6 ECOSYSTEM ANALYSISDEMAND SIDESUPPLY SIDE
- 6.7 TRADE ANALYSIS
- 6.8 KEY CONFERENCES & EVENTS, 2022–2023
-
6.9 TRENDS/DISRUPTIONS IMPACTING BUYERS
- 6.10 AVERAGE PRICE ANALYSIS
-
6.11 CASE STUDIESORGANIC TOMATO GREENHOUSE FARMS UTILIZED ECOATION OKO CART TO RECORD PEST PRESSURE AND CLIMATE DATACROPLIFE INTERNATIONAL, CROPLIFE ASIA, AND CROPLIFE INDIA COLLABORATED TO PROMOTE EFFECTIVE CROP PROTECTION PRACTICES AMONG FARMERS
-
6.12 PORTER’S FIVE FORCES ANALYSISINTENSITY OF COMPETITIVE RIVALRYTHREAT OF NEW ENTRANTSTHREAT OF SUBSTITUTESBARGAINING POWER OF SUPPLIERSBARGAINING POWER OF BUYERS
-
6.13 KEY STAKEHOLDERS & BUYING CRITERIAKEY STAKEHOLDERS IN BUYING PROCESSBUYING CRITERIA
-
6.14 REGULATORY FRAMEWORKREGULATORY BODIES, GOVERNMENT AGENCIES, AND OTHER ORGANIZATIONS- US- Canada- Europe- India- Australia
- 7.1 INTRODUCTION
-
7.2 CROP PROTECTIONNEED TO PREVENT HARMFUL EFFECTS OF CHEMICAL PESTICIDES ON CROPS TO DRIVE DEMAND
-
7.3 CROP PRODUCTIONBENEFICIAL INSECTS KEY TO ARTIFICIAL POLLINATION IN CROP PRODUCTION
- 8.1 INTRODUCTION
- 8.2 FRUITS & VEGETABLES
- 8.3 FLOWERS & ORNAMENTALS
- 8.4 GRAINS & PULSES
- 9.1 INTRODUCTION
-
9.2 PREDATORSHIGH DEMAND FOR PREDATORS FOR CROP PROTECTION TO DRIVE MARKET
-
9.3 PARASITOIDSNEED FOR BIOLOGICAL CONTROL OF PESTS TO DRIVE PARASITOIDS MARKET
-
9.4 PATHOGENSPOPULARITY OF NATURAL PEST CONTROL PRACTICES TO DRIVE DEMAND FOR PATHOGENS
-
9.5 POLLINATORSGROWING USE OF POLLINATORS TO CULTIVATE CROPS AND PLANT-BASED MEDICINES TO DRIVE MARKET
- 10.1 INTRODUCTION
-
10.2 NORTH AMERICANORTH AMERICA: RECESSION IMPACT ANALYSISUS- Growing demand for environmentally friendly pest control methods to drive marketCANADA- Rising adoption of beneficial insects in stored food to drive marketMEXICO- Need to restrict use of chemicals in farms to drive market
-
10.3 EUROPEEUROPE: RECESSION IMPACT ANALYSISUK- Government support for sustainable agriculture to drive growthGERMANY- Rapid decrease in use of pesticides to drive growthFRANCE- French government to support sustainable agricultural practices to propel marketITALY- Growing demand for products with reduced chemical residues to drive marketSPAIN- Growing acceptance and adoption of IPM practices by farmers to boost market growthNETHERLANDS- Adoption of sustainable agriculture practices to contribute to increased use of beneficial insectsGREECE- Government subsidies to drive growth of beneficial insects marketRUSSIA- Implementation of regulations on pesticide use to support market growthPOLAND- Contribution of beneficial insects in restoring forests to boost their popularityREST OF EUROPE
-
10.4 ASIA PACIFICASIA PACIFIC: RECESSION IMPACT ANALYSISCHINA- Farmers’ shift toward pesticide-free farming to promote use of beneficial insectsINDIA- Need to promote, conserve, and harness economic potential of beneficial insects to drive marketJAPAN- Adoption of sustainable pest management practices to propel market growthAUSTRALIA- Synergistic approach to integrating IPM practices to drive growthNEW ZEALAND- Expansion of agricultural sector to drive beneficial insects marketREST OF ASIA PACIFIC
-
10.5 SOUTH AMERICASOUTH AMERICA: RECESSION IMPACT ANALYSISBRAZIL- Increasing adoption of biological agents by farmers to boost market growthARGENTINA- Increased focus on sustainable and beneficial biological control strategies to drive growthCOLOMBIA- Collaboration and promotion by organizations to protect pollinators to propel growthECUADOR- Decrease in use of pesticides to drive popularity of beneficial insectsCHILE- Demand to ban toxic pesticides to boost use of beneficial insectsREST OF SOUTH AMERICA
-
10.6 REST OF THE WORLDROW: RECESSION IMPACT ANALYSISMIDDLE EAST- Government initiatives to increase honeybee population to support market growthAFRICA- Growing use of biocontrol agents to support sustainable farming to boost growth

- 11.1 OVERVIEW
- 11.2 MARKET SHARE ANALYSIS, 2022
- 11.3 STRATEGIES ADOPTED BY KEY PLAYERS
-
11.4 COMPANY EVALUATION MATRIX FOR KEY PLAYERS, 2022STARSPERVASIVE PLAYERSEMERGING LEADERSPARTICIPANTSPRODUCT FOOTPRINT FOR KEY PLAYERS
-
11.5 COMPANY EVALUATION MATRIX FOR STARTUPS/SMES, 2022PROGRESSIVE COMPANIESDYNAMIC COMPANIESSTARTING BLOCKSRESPONSIVE COMPANIESCOMPETITIVE BENCHMARKING FOR STARTUPS/SMES
-
11.6 COMPETITIVE SCENARIODEALSOTHERS
-
12.1 MAJOR PLAYERSAPPLIED BIO-NOMICS LTD.- Business overview- Products/Services/Solutions offered- Recent developments- MnM viewBIOBEST GROUP NV- Business overview- Products/Services/Solutions offered- Recent developments- MnM viewBIOLINE AGROSCIENCES LTD.- Business overview- Products/Services/Solutions offered- Recent developments- MnM viewFARGRO LTD.- Business overview- Products/Services/Solutions offered- Recent developments- MnM viewKOPPERT B.V.- Business overview- Products/Services/Solutions offered- Recent developments- MnM viewANDERMATT BIOCONTROL AG- Business overview- Products/Services/Solutions offered- Recent developments- MnM viewARBICO ORGANICS- Business overview- Products/Services/Solutions offered- Recent developments- MnM viewBIOBEE BIOLOGICAL SYSTEMS LTD.- Business overview- Products/Services/Solutions offered- Recent developments- MnM viewBIONEMA LTD.- Business overview- Products/Services/Solutions offered- Recent developments- MnM viewTIP TOP BIO-CONTROL- Business overview- Products/Services/Solutions offered- Recent developments- MnM viewEVERGREEN GROWERS SUPPLY, LLC- Business overview- Products/Services/Solutions offered- Recent developments- MnM viewANATIS BIOPROTECTION- Business overview- Products/Services/Solutions offered- Recent developments- MnM viewGROWLIV BIOLOGICALS- Business overview- Products/Services/Solutions offered- Recent developments- MnM viewPLANET NATURAL- Business overview- Products/Services/Solutions offered- Recent developments- MnM viewNATURAL INSECT CONTROL- Business overview- Products/Services/Solutions offered- Recent developments- MnM view
-
12.2 STARTUPS/SMESKUNAFIN- Business overview- Products/Services/Solutions offered- Recent developments- MnM viewIPM LABORATORIES, INC.- Business overview- Products/Services/Solutions offered- Recent developments- MnM viewNATURE’S CONTROL- Business overview- Products/Services/Solutions offered- Recent developments- MnM viewASSOCIATES INSECTARY- Business overview- Products/Services/Solutions offered- Recent developments- MnM viewBUGS FOR BUGS- Business overview- Products/Services/Solutions offered- Recent developments- MnM viewRINCON-VITOVA INSECTARIESHARMONY FARM SUPPLY & NURSERYFAR INC.ORGANIC CONTROL, INC.ECO BUGS INDIA PRIVATE LIMITED
- 13.1 INTRODUCTION
-
13.2 BIOSTIMULANTS MARKETLIMITATIONSMARKET DEFINITIONMARKET OVERVIEWBIOSTIMULANTS MARKET, BY ACTIVE INGREDIENT
-
13.3 BIOFERTILIZERS MARKETMARKET DEFINITIONMARKET OVERVIEWBIOFERTILIZERS MARKET, BY TYPE
- 14.1 DISCUSSION GUIDE
- 14.2 KNOWLEDGESTORE: MARKETSANDMARKETS’ SUBSCRIPTION PORTAL
- 14.3 CUSTOMIZATION OPTIONS
- 14.4 RELATED REPORTS
- 14.5 AUTHOR DETAILS
- TABLE 1 USD EXCHANGE RATES, 2018–2022
- TABLE 2 RESEARCH ASSUMPTIONS
- TABLE 3 LIMITATIONS AND RISK ASSESSMENT
- TABLE 4 BENEFICIAL INSECTS MARKET SNAPSHOT, 2023 VS. 2028
- TABLE 5 LIST OF MAJOR PATENTS PERTAINING TO BENEFICIAL INSECTS MARKET
- TABLE 6 ROLE OF KEY PLAYERS IN MARKET ECOSYSTEM
- TABLE 7 EXPORT VALUE OF LIVE INSECTS (EXCLUDING BEES), 2022 (USD THOUSAND)
- TABLE 8 IMPORT VALUE OF LIVE INSECTS (EXCLUDING BEES), 2022 (USD THOUSAND)
- TABLE 9 IMPORT VALUE OF LIVE BEES, 2022 (USD THOUSAND)
- TABLE 10 EXPORT VALUE OF LIVE BEES, 2022 (USD THOUSAND)
- TABLE 11 LIST OF CONFERENCES & EVENTS, 2022–2023
- TABLE 12 PORTER’S FIVE FORCES ANALYSIS
- TABLE 13 INFLUENCE OF STAKEHOLDERS ON BUYING PROCESS FOR KEY APPLICATIONS
- TABLE 14 KEY BUYING CRITERIA FOR KEY APPLICATIONS
- TABLE 15 NORTH AMERICA: LIST OF REGULATORY BODIES, GOVERNMENT AGENCIES, AND OTHER ORGANIZATIONS
- TABLE 16 EUROPE: LIST OF REGULATORY BODIES, GOVERNMENT AGENCIES, AND OTHER ORGANIZATIONS
- TABLE 17 ASIA PACIFIC: LIST OF REGULATORY BODIES, GOVERNMENT AGENCIES, AND OTHER ORGANIZATIONS
- TABLE 18 BENEFICIAL INSECTS MARKET, BY APPLICATION, 2018–2022 (USD MILLION)
- TABLE 19 BENEFICIAL INSECTS MARKET, BY APPLICATION, 2023–2028 (USD MILLION)
- TABLE 20 CROP PROTECTION: BENEFICIAL INSECTS MARKET, BY REGION, 2018–2022 (USD MILLION)
- TABLE 21 CROP PROTECTION: BENEFICIAL INSECTS MARKET, BY REGION, 2023–2028 (USD MILLION)
- TABLE 22 CROP PRODUCTION: BENEFICIAL INSECTS MARKET, BY REGION, 2018–2022 (USD MILLION)
- TABLE 23 CROP PRODUCTION: BENEFICIAL INSECTS MARKET, BY REGION, 2023–2028 (USD MILLION)
- TABLE 24 PESTS AND THEIR COMMON NATURAL ENEMIES
- TABLE 25 BENEFICIAL INSECTS MARKET, BY PRODUCT TYPE, 2018–2022 (USD MILLION)
- TABLE 26 BENEFICIAL INSECTS MARKET, BY PRODUCT TYPE, 2023–2028 (USD MILLION)
- TABLE 27 COMMON PREDATORY INSECTS AND THEIR PREY
- TABLE 28 PREDATORS: BENEFICIAL INSECTS MARKET, BY REGION, 2018–2022 (USD MILLION)
- TABLE 29 PREDATORS: BENEFICIAL INSECTS MARKET, BY REGION, 2023–2028 (USD MILLION)
- TABLE 30 COMMON PARASITOIDS AND THEIR HOSTS
- TABLE 31 PARASITOIDS: BENEFICIAL INSECTS MARKET, BY REGION, 2018–2022 (USD MILLION)
- TABLE 32 PARASITOIDS: BENEFICIAL INSECTS MARKET, BY REGION, 2023–2028 (USD MILLION)
- TABLE 33 PATHOGENS: BENEFICIAL INSECTS MARKET, BY REGION, 2018–2022 (USD MILLION)
- TABLE 34 PATHOGENS: BENEFICIAL INSECTS MARKET, BY REGION, 2023–2028 (USD MILLION)
- TABLE 35 POLLINATORS: BENEFICIAL INSECTS MARKET, BY REGION, 2018–2022 (USD MILLION)
- TABLE 36 POLLINATORS: BENEFICIAL INSECTS MARKET, BY REGION, 2023–2028 (USD MILLION)
- TABLE 37 BENEFICIAL INSECTS MARKET, BY REGION, 2018–2022 (USD MILLION)
- TABLE 38 BENEFICIAL INSECTS MARKET, BY REGION, 2023–2028 (USD MILLION)
- TABLE 39 NORTH AMERICA: BENEFICIAL INSECTS MARKET, BY COUNTRY, 2018–2022 (USD MILLION)
- TABLE 40 NORTH AMERICA: BENEFICIAL INSECTS MARKET, BY COUNTRY, 2023–2028 (USD MILLION)
- TABLE 41 NORTH AMERICA: BENEFICIAL INSECTS MARKET, BY PRODUCT TYPE, 2018–2022 (USD MILLION)
- TABLE 42 NORTH AMERICA: BENEFICIAL INSECTS MARKET, BY PRODUCT TYPE, 2023–2028 (USD MILLION)
- TABLE 43 NORTH AMERICA: BENEFICIAL INSECTS MARKET, BY APPLICATION, 2018–2022 (USD MILLION)
- TABLE 44 NORTH AMERICA: BENEFICIAL INSECTS MARKET, BY APPLICATION, 2023–2028 (USD MILLION)
- TABLE 45 US: BENEFICIAL INSECTS MARKET, BY APPLICATION, 2018–2022 (USD MILLION)
- TABLE 46 US: BENEFICIAL INSECTS MARKET, BY APPLICATION, 2023–2028 (USD MILLION)
- TABLE 47 US: BENEFICIAL INSECTS MARKET, BY PRODUCT TYPE, 2018–2022 (USD MILLION)
- TABLE 48 US: BENEFICIAL INSECTS MARKET, BY PRODUCT TYPE, 2023–2028 (USD MILLION)
- TABLE 49 CANADA: BENEFICIAL INSECTS MARKET, BY APPLICATION, 2018–2022 (USD MILLION)
- TABLE 50 CANADA: BENEFICIAL INSECTS MARKET, BY APPLICATION, 2023–2028 (USD MILLION)
- TABLE 51 CANADA: BENEFICIAL INSECTS MARKET, BY PRODUCT TYPE, 2018–2022 (USD MILLION)
- TABLE 52 CANADA: BENEFICIAL INSECTS MARKET, BY PRODUCT TYPE, 2023–2028 (USD MILLION)
- TABLE 53 MEXICO: BENEFICIAL INSECTS MARKET, BY APPLICATION, 2018–2022 (USD MILLION)
- TABLE 54 MEXICO: BENEFICIAL INSECTS MARKET, BY APPLICATION, 2023–2028 (USD MILLION)
- TABLE 55 MEXICO: BENEFICIAL INSECTS MARKET, BY PRODUCT TYPE, 2018–2022 (USD MILLION)
- TABLE 56 MEXICO: BENEFICIAL INSECTS MARKET, BY PRODUCT TYPE, 2023–2028 (USD MILLION)
- TABLE 57 EUROPE: BENEFICIAL INSECTS MARKET, BY COUNTRY, 2018–2022 (USD MILLION)
- TABLE 58 EUROPE: BENEFICIAL INSECTS MARKET, BY COUNTRY, 2023–2028 (USD MILLION)
- TABLE 59 EUROPE: BENEFICIAL INSECTS MARKET, BY APPLICATION, 2018–2022 (USD MILLION)
- TABLE 60 EUROPE: BENEFICIAL INSECTS MARKET, BY APPLICATION, 2023–2028 (USD MILLION)
- TABLE 61 EUROPE: BENEFICIAL INSECTS MARKET, BY PRODUCT TYPE, 2018–2022 (USD MILLION)
- TABLE 62 EUROPE: BENEFICIAL INSECTS MARKET, BY PRODUCT TYPE, 2023–2028 (USD MILLION)
- TABLE 63 UK: BENEFICIAL INSECTS MARKET, BY APPLICATION, 2018–2022 (USD MILLION)
- TABLE 64 UK: BENEFICIAL INSECTS MARKET, BY APPLICATION, 2023–2028 (USD MILLION)
- TABLE 65 UK: BENEFICIAL INSECTS MARKET, BY PRODUCT TYPE, 2018–2022 (USD MILLION)
- TABLE 66 UK: BENEFICIAL INSECTS MARKET, BY PRODUCT TYPE, 2023–2028 (USD MILLION)
- TABLE 67 GERMANY: BENEFICIAL INSECTS MARKET, BY APPLICATION, 2018–2022 (USD MILLION)
- TABLE 68 GERMANY: BENEFICIAL INSECTS MARKET, BY APPLICATION, 2023–2028 (USD MILLION)
- TABLE 69 GERMANY: BENEFICIAL INSECTS MARKET, BY PRODUCT TYPE, 2018–2022 (USD MILLION)
- TABLE 70 GERMANY: BENEFICIAL INSECTS MARKET, BY PRODUCT TYPE, 2023–2028 (USD MILLION)
- TABLE 71 FRANCE: BENEFICIAL INSECTS MARKET, BY APPLICATION, 2018–2022 (USD MILLION)
- TABLE 72 FRANCE: BENEFICIAL INSECTS MARKET, BY APPLICATION, 2023–2028 (USD MILLION)
- TABLE 73 FRANCE: BENEFICIAL INSECTS MARKET, BY PRODUCT TYPE, 2018–2022 (USD MILLION)
- TABLE 74 FRANCE: BENEFICIAL INSECTS MARKET, BY PRODUCT TYPE, 2023–2028 (USD MILLION)
- TABLE 75 ITALY: BENEFICIAL INSECTS MARKET, BY APPLICATION, 2018–2022 (USD MILLION)
- TABLE 76 ITALY: BENEFICIAL INSECTS MARKET, BY APPLICATION, 2023–2028 (USD MILLION)
- TABLE 77 ITALY: BENEFICIAL INSECTS MARKET, BY PRODUCT TYPE, 2018–2022 (USD MILLION)
- TABLE 78 ITALY: BENEFICIAL INSECTS MARKET, BY PRODUCT TYPE, 2023–2028 (USD MILLION)
- TABLE 79 SPAIN: BENEFICIAL INSECTS MARKET, BY APPLICATION, 2018–2022 (USD MILLION)
- TABLE 80 SPAIN: BENEFICIAL INSECTS MARKET, BY APPLICATION, 2023–2028 (USD MILLION)
- TABLE 81 SPAIN: BENEFICIAL INSECTS MARKET, BY PRODUCT TYPE, 2018–2022 (USD MILLION)
- TABLE 82 SPAIN: BENEFICIAL INSECTS MARKET, BY PRODUCT TYPE, 2023–2028 (USD MILLION)
- TABLE 83 NETHERLANDS: BENEFICIAL INSECTS MARKET, BY APPLICATION, 2018–2022 (USD MILLION)
- TABLE 84 NETHERLANDS: BENEFICIAL INSECTS MARKET, BY APPLICATION, 2023–2028 (USD MILLION)
- TABLE 85 NETHERLANDS: BENEFICIAL INSECTS MARKET, BY PRODUCT TYPE, 2018–2022 (USD MILLION)
- TABLE 86 NETHERLANDS: BENEFICIAL INSECTS MARKET, BY PRODUCT TYPE, 2023–2028 (USD MILLION)
- TABLE 87 GREECE: BENEFICIAL INSECTS MARKET, BY APPLICATION, 2018–2022 (USD MILLION)
- TABLE 88 GREECE: BENEFICIAL INSECTS MARKET, BY APPLICATION, 2023–2028 (USD MILLION)
- TABLE 89 GREECE: BENEFICIAL INSECTS MARKET, BY PRODUCT TYPE, 2018–2022 (USD MILLION)
- TABLE 90 GREECE: BENEFICIAL INSECTS MARKET, BY PRODUCT TYPE, 2023–2028 (USD MILLION)
- TABLE 91 RUSSIA: BENEFICIAL INSECTS MARKET, BY APPLICATION, 2018–2022 (USD MILLION)
- TABLE 92 RUSSIA: BENEFICIAL INSECTS MARKET, BY APPLICATION, 2023–2028 (USD MILLION)
- TABLE 93 RUSSIA: BENEFICIAL INSECTS MARKET, BY TYPE, 2018–2022 (USD THOUSAND)
- TABLE 94 RUSSIA: BENEFICIAL INSECTS MARKET, BY TYPE, 2023–2028 (USD THOUSAND)
- TABLE 95 POLAND: BENEFICIAL INSECTS MARKET, BY APPLICATION, 2018–2022 (USD MILLION)
- TABLE 96 POLAND: BENEFICIAL INSECTS MARKET, BY APPLICATION, 2023–2028 (USD MILLION)
- TABLE 97 POLAND: BENEFICIAL INSECTS MARKET, BY PRODUCT TYPE, 2018–2022 (USD MILLION)
- TABLE 98 POLAND: BENEFICIAL INSECTS MARKET, BY PRODUCT TYPE, 2023–2028 (USD MILLION)
- TABLE 99 REST OF EUROPE: BENEFICIAL INSECTS MARKET, BY APPLICATION, 2018–2022 (USD MILLION)
- TABLE 100 REST OF EUROPE: BENEFICIAL INSECTS MARKET, BY APPLICATION, 2023–2028 (USD MILLION)
- TABLE 101 REST OF EUROPE: BENEFICIAL INSECTS MARKET, BY PRODUCT TYPE, 2018–2022 (USD MILLION)
- TABLE 102 REST OF EUROPE: BENEFICIAL INSECTS MARKET, BY PRODUCT TYPE, 2023–2028 (USD MILLION)
- TABLE 103 ASIA PACIFIC: BENEFICIAL INSECTS MARKET, BY COUNTRY, 2018–2022 (USD MILLION)
- TABLE 104 ASIA PACIFIC: BENEFICIAL INSECTS MARKET, BY COUNTRY, 2023–2028 (USD MILLION)
- TABLE 105 ASIA PACIFIC: BENEFICIAL INSECTS MARKET, BY APPLICATION, 2018–2022 (USD MILLION)
- TABLE 106 ASIA PACIFIC: BENEFICIAL INSECTS MARKET, BY APPLICATION, 2023–2028 (USD MILLION)
- TABLE 107 ASIA PACIFIC: BENEFICIAL INSECTS MARKET, BY PRODUCT TYPE, 2018–2022 (USD MILLION)
- TABLE 108 ASIA PACIFIC: BENEFICIAL INSECTS MARKET, BY PRODUCT TYPE, 2023–2028 (USD MILLION)
- TABLE 109 CHINA: BENEFICIAL INSECTS MARKET, BY APPLICATION, 2018–2022 (USD MILLION)
- TABLE 110 CHINA: BENEFICIAL INSECTS MARKET, BY APPLICATION, 2023–2028 (USD MILLION)
- TABLE 111 CHINA: BENEFICIAL INSECTS MARKET, BY PRODUCT TYPE, 2018–2022 (USD MILLION)
- TABLE 112 CHINA: BENEFICIAL INSECTS MARKET, BY PRODUCT TYPE, 2023–2028 (USD MILLION)
- TABLE 113 INDIA: BENEFICIAL INSECTS MARKET, BY APPLICATION, 2018–2022 (USD MILLION)
- TABLE 114 INDIA: BENEFICIAL INSECTS MARKET, BY APPLICATION, 2023–2028 (USD MILLION)
- TABLE 115 INDIA: BENEFICIAL INSECTS MARKET, BY PRODUCT TYPE, 2018–2022 (USD MILLION)
- TABLE 116 INDIA: BENEFICIAL INSECTS MARKET, BY PRODUCT TYPE, 2023–2028 (USD MILLION)
- TABLE 117 JAPAN: BENEFICIAL INSECTS MARKET, BY APPLICATION, 2018–2022 (USD MILLION)
- TABLE 118 JAPAN: BENEFICIAL INSECTS MARKET, BY APPLICATION, 2023–2028 (USD MILLION)
- TABLE 119 JAPAN: BENEFICIAL INSECTS MARKET, BY PRODUCT TYPE, 2018–2022 (USD MILLION)
- TABLE 120 JAPAN: BENEFICIAL INSECTS MARKET, BY PRODUCT TYPE, 2023–2028 (USD MILLION)
- TABLE 121 AUSTRALIA: BENEFICIAL INSECTS MARKET, BY APPLICATION, 2018–2022 (USD MILLION)
- TABLE 122 AUSTRALIA: BENEFICIAL INSECTS MARKET, BY APPLICATION, 2023–2028 (USD MILLION)
- TABLE 123 AUSTRALIA: BENEFICIAL INSECTS MARKET, BY PRODUCT TYPE, 2018–2022 (USD MILLION)
- TABLE 124 AUSTRALIA: BENEFICIAL INSECTS MARKET, BY PRODUCT TYPE, 2023–2028 (USD MILLION)
- TABLE 125 NEW ZEALAND: BENEFICIAL INSECTS MARKET, BY APPLICATION, 2018–2022 (USD MILLION)
- TABLE 126 NEW ZEALAND: BENEFICIAL INSECTS MARKET, BY APPLICATION, 2023–2028 (USD MILLION)
- TABLE 127 NEW ZEALAND: BENEFICIAL INSECTS MARKET, BY PRODUCT TYPE, 2018–2022 (USD MILLION)
- TABLE 128 NEW ZEALAND: BENEFICIAL INSECTS MARKET, BY PRODUCT TYPE, 2023–2028 (USD MILLION)
- TABLE 129 REST OF ASIA PACIFIC: BENEFICIAL INSECTS MARKET, BY APPLICATION, 2018–2022 (USD MILLION)
- TABLE 130 REST OF ASIA PACIFIC: BENEFICIAL INSECTS MARKET, BY APPLICATION, 2023–2028 (USD MILLION)
- TABLE 131 REST OF ASIA PACIFIC: BENEFICIAL INSECTS MARKET, BY PRODUCT TYPE, 2018–2022 (USD MILLION)
- TABLE 132 REST OF ASIA PACIFIC: BENEFICIAL INSECTS MARKET, BY PRODUCT TYPE, 2023–2028 (USD MILLION)
- TABLE 133 SOUTH AMERICA: BENEFICIAL INSECTS MARKET, BY COUNTRY, 2018–2022 (USD MILLION)
- TABLE 134 SOUTH AMERICA: BENEFICIAL INSECTS MARKET, BY COUNTRY, 2023–2028 (USD MILLION)
- TABLE 135 SOUTH AMERICA: BENEFICIAL INSECTS MARKET, BY APPLICATION, 2018–2022 (USD MILLION)
- TABLE 136 SOUTH AMERICA: BENEFICIAL INSECTS MARKET, BY APPLICATION, 2023–2028 (USD MILLION)
- TABLE 137 SOUTH AMERICA: BENEFICIAL INSECTS MARKET, BY PRODUCT TYPE, 2018–2022 (USD MILLION)
- TABLE 138 SOUTH AMERICA: BENEFICIAL INSECTS MARKET, BY PRODUCT TYPE, 2023–2028 (USD MILLION)
- TABLE 139 BRAZIL: BENEFICIAL INSECTS MARKET, BY APPLICATION, 2018–2022 (USD MILLION)
- TABLE 140 BRAZIL: BENEFICIAL INSECTS MARKET, BY APPLICATION, 2023–2028 (USD MILLION)
- TABLE 141 BRAZIL: BENEFICIAL INSECTS MARKET, BY PRODUCT TYPE, 2018–2022 (USD MILLION)
- TABLE 142 BRAZIL: BENEFICIAL INSECTS MARKET, BY PRODUCT TYPE, 2023–2028 (USD MILLION)
- TABLE 143 ARGENTINA: BENEFICIAL INSECTS MARKET, BY APPLICATION, 2018–2022 (USD MILLION)
- TABLE 144 ARGENTINA: BENEFICIAL INSECTS MARKET, BY APPLICATION, 2023–2028 (USD MILLION)
- TABLE 145 ARGENTINA: BENEFICIAL INSECTS MARKET, BY PRODUCT TYPE, 2018–2022 (USD MILLION)
- TABLE 146 ARGENTINA: BENEFICIAL INSECTS MARKET, BY PRODUCT TYPE, 2023–2028 (USD MILLION)
- TABLE 147 COLOMBIA: BENEFICIAL INSECTS MARKET, BY APPLICATION, 2018–2022 (USD THOUSAND)
- TABLE 148 COLOMBIA: BENEFICIAL INSECTS MARKET, BY APPLICATION, 2023–2028 (USD THOUSAND)
- TABLE 149 COLOMBIA: BENEFICIAL INSECTS MARKET, BY PRODUCT TYPE, 2018–2022 (USD THOUSAND)
- TABLE 150 COLOMBIA: BENEFICIAL INSECTS MARKET, BY PRODUCT TYPE, 2023–2028 (USD THOUSAND)
- TABLE 151 ECUADOR: BENEFICIAL INSECTS MARKET, BY APPLICATION, 2018–2022 (USD MILLION)
- TABLE 152 ECUADOR: BENEFICIAL INSECTS MARKET, BY APPLICATION, 2023–2028 (USD MILLION)
- TABLE 153 ECUADOR: BENEFICIAL INSECTS MARKET, BY PRODUCT TYPE, 2018–2022 (USD MILLION)
- TABLE 154 ECUADOR: BENEFICIAL INSECTS MARKET, BY PRODUCT TYPE, 2023–2028 (USD MILLION)
- TABLE 155 CHILE: BENEFICIAL INSECTS MARKET, BY APPLICATION, 2018–2022 (USD THOUSAND)
- TABLE 156 CHILE: BENEFICIAL INSECTS MARKET, BY APPLICATION, 2023–2028 (USD THOUSAND)
- TABLE 157 CHILE: BENEFICIAL INSECTS MARKET, BY PRODUCT TYPE, 2018–2022 (USD THOUSAND)
- TABLE 158 CHILE: BENEFICIAL INSECTS MARKET, BY PRODUCT TYPE, 2023–2028 (USD THOUSAND)
- TABLE 159 REST OF SOUTH AMERICA: BENEFICIAL INSECTS MARKET, BY APPLICATION, 2018–2022 (USD MILLION)
- TABLE 160 REST OF SOUTH AMERICA: BENEFICIAL INSECTS MARKET, BY APPLICATION, 2023–2028 (USD MILLION)
- TABLE 161 REST OF SOUTH AMERICA: BENEFICIAL INSECTS MARKET, BY PRODUCT TYPE, 2018–2022 (USD MILLION)
- TABLE 162 REST OF SOUTH AMERICA: BENEFICIAL INSECTS MARKET, BY PRODUCT TYPE, 2023–2028 (USD MILLION)
- TABLE 163 ROW: BENEFICIAL INSECTS MARKET, BY COUNTRY, 2018–2022 (USD MILLION)
- TABLE 164 ROW: BENEFICIAL INSECTS MARKET, BY COUNTRY, 2023–2028 (USD MILLION)
- TABLE 165 ROW: BENEFICIAL INSECTS MARKET, BY APPLICATION, 2018–2022 (USD MILLION)
- TABLE 166 ROW: BENEFICIAL INSECTS MARKET, BY APPLICATION, 2023–2028 (USD MILLION)
- TABLE 167 ROW: BENEFICIAL INSECTS MARKET, BY PRODUCT TYPE, 2018–2022 (USD MILLION)
- TABLE 168 ROW: BENEFICIAL INSECTS MARKET, BY PRODUCT TYPE, 2023–2028 (USD MILLION)
- TABLE 169 MIDDLE EAST: BENEFICIAL INSECTS MARKET, BY APPLICATION, 2018–2022 (USD THOUSAND)
- TABLE 170 MIDDLE EAST: BENEFICIAL INSECTS MARKET, BY APPLICATION, 2023–2028 (USD THOUSAND)
- TABLE 171 MIDDLE EAST: BENEFICIAL INSECTS MARKET, BY PRODUCT TYPE, 2018–2022 (USD THOUSAND)
- TABLE 172 MIDDLE EAST: BENEFICIAL INSECTS MARKET, BY PRODUCT TYPE, 2023–2028 (USD THOUSAND)
- TABLE 173 AFRICA: BENEFICIAL INSECTS MARKET, BY APPLICATION, 2018–2022 (USD MILLION)
- TABLE 174 AFRICA: BENEFICIAL INSECTS MARKET, BY APPLICATION, 2023–2028 (USD MILLION)
- TABLE 175 AFRICA: BENEFICIAL INSECTS MARKET, BY PRODUCT TYPE, 2018–2022 (USD MILLION)
- TABLE 176 AFRICA: BENEFICIAL INSECTS MARKET, BY PRODUCT TYPE, 2023–2028 (USD MILLION)
- TABLE 177 BENEFICIAL INSECTS MARKET: INTENSITY OF COMPETITIVE RIVALRY
- TABLE 178 STRATEGIES ADOPTED BY KEY PLAYERS
- TABLE 179 PRODUCT FOOTPRINT FOR KEY PLAYERS, BY APPLICATION
- TABLE 180 PRODUCT FOOTPRINT FOR KEY PLAYERS, BY PRODUCT TYPE
- TABLE 181 PRODUCT FOOTPRINT FOR KEY PLAYERS, BY REGION
- TABLE 182 OVERALL COMPANY FOOTPRINT
- TABLE 183 LIST OF STARTUPS/SMES
- TABLE 184 COMPETITIVE BENCHMARKING FOR STARTUPS/SMES, 2022
- TABLE 185 DEALS, 2021–2023
- TABLE 186 OTHERS, 2021–2023
- TABLE 187 APPLIED BIO-NOMICS LTD.: BUSINESS OVERVIEW
- TABLE 188 APPLIED BIO-NOMICS LTD.: PRODUCTS/SOLUTIONS/SERVICES OFFERED
- TABLE 189 BIOBEST GROUP NV: BUSINESS OVERVIEW
- TABLE 190 BIOBEST GROUP NV: PRODUCTS/SOLUTIONS/SERVICES OFFERED
- TABLE 191 BIOBEST GROUP NV: DEALS
- TABLE 192 BIOBEST GROUP NV: OTHERS
- TABLE 193 BIOLINE AGROSCIENCES LTD.: BUSINESS OVERVIEW
- TABLE 194 BIOLINE AGROSCIENCES LTD.: PRODUCTS/SOLUTIONS/SERVICES OFFERED
- TABLE 195 BIOLINE AGROSCIENCES LTD.: DEALS
- TABLE 196 FARGRO LTD.: BUSINESS OVERVIEW
- TABLE 197 FARGRO LTD.: PRODUCTS/SOLUTIONS/SERVICES OFFERED
- TABLE 198 KOPPERT B.V.: BUSINESS OVERVIEW
- TABLE 199 KOPPERT B.V.: PRODUCTS/SOLUTIONS/SERVICES OFFERED
- TABLE 200 KOPPERT B.V.: OTHERS
- TABLE 201 ANDERMATT BIOCONTROL AG: BUSINESS OVERVIEW
- TABLE 202 ANDERMATT BIOCONTROL AG: PRODUCTS/SOLUTIONS/SERVICES OFFERED
- TABLE 203 ANDERMATT BIOCONTROL AG: OTHERS
- TABLE 204 ARBICO ORGANICS: BUSINESS OVERVIEW
- TABLE 205 ARBICO ORGANICS: PRODUCTS/SOLUTIONS/SERVICES OFFERED
- TABLE 206 BIOBEE BIOLOGICALS SYSTEMS LTD.: BUSINESS OVERVIEW
- TABLE 207 BIOBEE BIOLOGICALS SYSTEMS LTD.: PRODUCTS/SOLUTIONS/SERVICES OFFERED
- TABLE 208 BIONEMA LTD.: BUSINESS OVERVIEW
- TABLE 209 BIONEMA LTD.: PRODUCTS/SOLUTIONS/SERVICES OFFERED
- TABLE 210 BIONEMA LTD.: OTHERS
- TABLE 211 TIP TOP BIO-CONTROL: BUSINESS OVERVIEW
- TABLE 212 TIP TOP BIO-CONTROL: PRODUCTS/SOLUTIONS/SERVICES OFFERED
- TABLE 213 EVERGREEN GROWERS SUPPLY, LLC: BUSINESS OVERVIEW
- TABLE 214 EVERGREEN GROWERS SUPPLY, LLC: PRODUCTS/SOLUTIONS/SERVICES OFFERED
- TABLE 215 ANATIS BIOPROTECTION: BUSINESS OVERVIEW
- TABLE 216 ANATIS BIOPROTECTION: PRODUCTS/SOLUTIONS/SERVICES OFFERED
- TABLE 217 GROWLIV BIOLOGICALS: BUSINESS OVERVIEW
- TABLE 218 GROWLIV BIOLOGICALS: PRODUCTS/SOLUTIONS/SERVICES OFFERED
- TABLE 219 PLANET NATURAL: BUSINESS OVERVIEW
- TABLE 220 PLANET NATURAL: PRODUCTS/SOLUTIONS/SERVICES OFFERED
- TABLE 221 NATURAL INSECT CONTROL: BUSINESS OVERVIEW
- TABLE 222 NATURAL INSECT CONTROL: PRODUCTS/SOLUTIONS/SERVICES OFFERED
- TABLE 223 KUNAFIN: BUSINESS OVERVIEW
- TABLE 224 KUNAFIN: PRODUCTS/SOLUTIONS/SERVICES OFFERED
- TABLE 225 IPM LABORATORIES, INC.: BUSINESS OVERVIEW
- TABLE 226 IPM LABORATORIES, INC.: PRODUCTS/SOLUTIONS/SERVICES OFFERED
- TABLE 227 NATURE’S CONTROL: BUSINESS OVERVIEW
- TABLE 228 NATURE’S CONTROL: PRODUCTS/SOLUTIONS/SERVICES OFFERED
- TABLE 229 ASSOCIATES INSECTARY: BUSINESS OVERVIEW
- TABLE 230 ASSOCIATES INSECTARY: PRODUCTS/SOLUTIONS/SERVICES OFFERED
- TABLE 231 BUGS FOR BUGS: BUSINESS OVERVIEW
- TABLE 232 BUGS FOR BUGS: PRODUCTS/SOLUTIONS/SERVICES OFFERED
- TABLE 233 BIOSTIMULANTS MARKET, BY ACTIVE INGREDIENT, 2016–2020 (USD MILLION)
- TABLE 234 BIOSTIMULANTS MARKET, BY ACTIVE INGREDIENT, 2021–2026 (USD MILLION)
- TABLE 235 BIOFERTILIZERS MARKET, BY TYPE, 2016–2020 (USD MILLION)
- TABLE 236 BIOFERTILIZERS MARKET, BY TYPE, 2021–2026 (USD MILLION)
- FIGURE 1 RESEARCH DESIGN
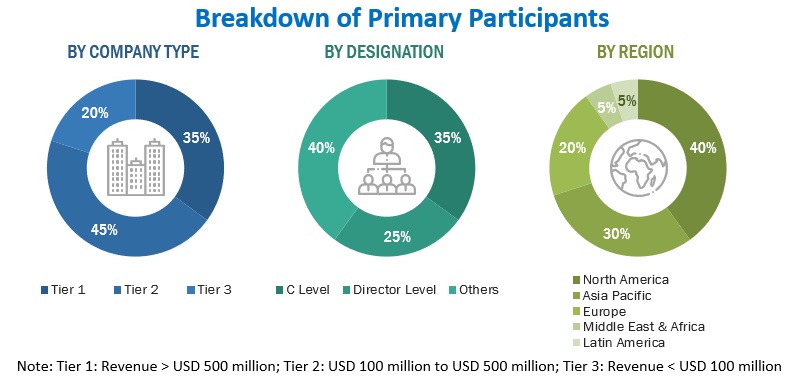
- FIGURE 2 BREAKDOWN OF PRIMARY INTERVIEWS: BY COMPANY TYPE, DESIGNATION, AND REGION
- FIGURE 3 BENEFICIAL INSECTS MARKET ESTIMATION: DEMAND SIDE (TOP-DOWN APPROACH)
- FIGURE 4 BENEFICIAL INSECTS MARKET ESTIMATION METHODOLOGY: BOTTOM-UP APPROACH
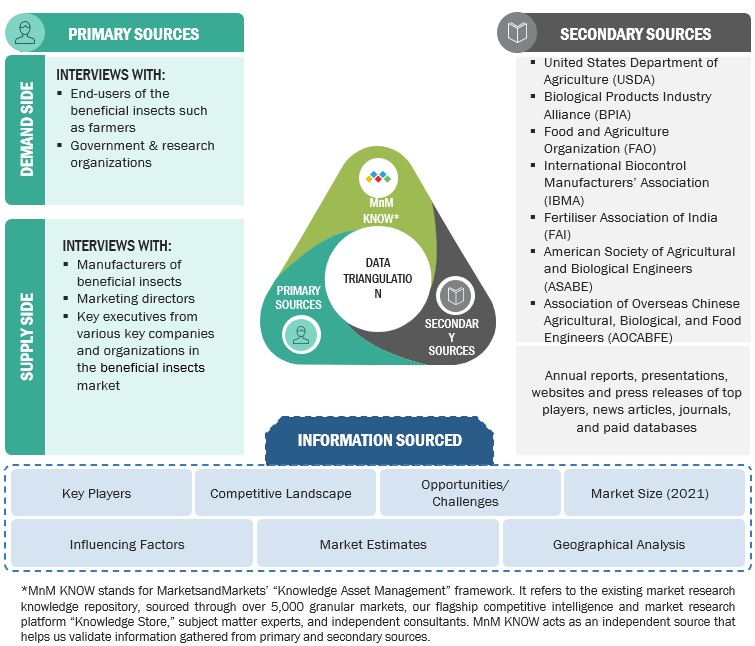
- FIGURE 5 DATA TRIANGULATION
- FIGURE 6 RECESSION MACROINDICATORS
- FIGURE 7 GLOBAL INFLATION RATE, 2011–2021
- FIGURE 8 GLOBAL GROSS DOMESTIC PRODUCT, 2011–2021 (USD TRILLION)
- FIGURE 9 RECESSION INDICATORS AND THEIR IMPACT ON BENEFICIAL INSECTS MARKET
- FIGURE 10 GLOBAL BENEFICIAL INSECTS MARKET: EARLIER FORECAST VS. RECESSION FORECAST
- FIGURE 11 BENEFICIAL INSECTS MARKET, BY PRODUCT TYPE, 2023 VS. 2028 (USD MILLION)
- FIGURE 12 BENEFICIAL INSECTS MARKET, BY APPLICATION, 2023 VS. 2028 (USD MILLION)
- FIGURE 13 BENEFICIAL INSECTS MARKET: REGIONAL SNAPSHOT
- FIGURE 14 SHIFT TOWARD SUSTAINABLE AGRICULTURE TO DRIVE MARKET GROWTH
- FIGURE 15 NORTH AMERICA TO DOMINATE BENEFICIAL INSECTS MARKET DURING FORECAST PERIOD
- FIGURE 16 CROP PROTECTION SEGMENT AND NETHERLANDS ACCOUNTED FOR SIGNIFICANT SHARE IN 2022
- FIGURE 17 BENEFICIAL INSECTS MARKET, BY REGION AND TYPE, 2023 VS. 2028 (USD MILLION)
- FIGURE 18 US, BRAZIL, AND SPAIN TO GROW AT SIGNIFICANT RATES DURING FORECAST PERIOD
- FIGURE 19 GLOBAL ORGANIC AGRICULTURAL LAND, BY REGION, 2020
- FIGURE 20 TOP TEN COUNTRIES WITH LARGEST ORGANIC AGRICULTURAL LAND, 2020 (HECTARES)
- FIGURE 21 BENEFICIAL INSECTS MARKET: DRIVERS, RESTRAINTS, OPPORTUNITIES, AND CHALLENGES
- FIGURE 22 GLOBAL PESTICIDE USAGE, 2016–2020 (TONS)
- FIGURE 23 VALUE CHAIN ANALYSIS
- FIGURE 24 SUPPLY CHAIN ANALYSIS
- FIGURE 25 NUMBER OF PATENTS APPROVED FOR BENEFICIAL INSECTS, 2011–2021
- FIGURE 26 JURISDICTIONS WITH HIGHEST PATENT APPROVALS FOR BENEFICIAL INSECTS, 2016–2022
- FIGURE 27 ECOSYSTEM MAP
- FIGURE 28 TRENDS/DISRUPTIONS IMPACTING BUYERS
- FIGURE 29 AVERAGE SELLING PRICE TREND, BY TYPE, 2022 (USD PER BOX)
- FIGURE 30 INFLUENCE OF STAKEHOLDERS ON BUYING PROCESS FOR KEY APPLICATIONS
- FIGURE 31 INFLUENCE OF STAKEHOLDERS ON BUYING PROCESS FOR BENEFICIAL INSECTS
- FIGURE 32 CROP PROTECTION SEGMENT TO ACCOUNT FOR LARGER MARKET DURING FORECAST PERIOD
- FIGURE 33 BENEFICIAL INSECTS MARKET SEGMENTATION, BY TYPE
- FIGURE 34 PREDATORS SEGMENT TO ACCOUNT FOR LARGEST MARKET DURING FORECAST PERIOD
- FIGURE 35 EUROPE AND ASIA PACIFIC TO BE EMERGING MARKETS DURING FORECAST PERIOD
- FIGURE 36 NORTH AMERICA: BENEFICIAL INSECTS MARKET SNAPSHOT
- FIGURE 37 NORTH AMERICAN BENEFICIAL INSECTS MARKET: RECESSION IMPACT ANALYSIS
- FIGURE 38 EUROPEAN BENEFICIAL INSECTS MARKET SNAPSHOT
- FIGURE 39 EUROPEAN BENEFICIAL INSECTS MARKET: RECESSION IMPACT ANALYSIS
- FIGURE 40 ASIA PACIFIC BENEFICIAL INSECTS MARKET: RECESSION IMPACT ANALYSIS
- FIGURE 41 SOUTH AMERICAN BENEFICIAL INSECTS MARKET: RECESSION IMPACT ANALYSIS
- FIGURE 42 ROW BENEFICIAL INSECTS MARKET: RECESSION IMPACT ANALYSIS
- FIGURE 43 COMPANY EVALUATION MATRIX FOR KEY PLAYERS, 2022
- FIGURE 44 COMPANY EVALUATION MATRIX FOR STARTUPS/SMES, 2022
This research study involved the extensive use of secondary sources—directories and databases, such as Bloomberg Businessweek and Factiva—to identify and collect information useful for a technical, market-oriented, and commercial study of the beneficial insects market. In-depth interviews were conducted with various primary respondents—such as key industry participants, subject matter experts (SMEs), and C-level executives of key market players and industry consultants—to obtain and verify critical qualitative and quantitative information, as well as to assess growth prospects. The following figure depicts the research design applied in drafting this report on the beneficial insects market.
Secondary Research
The secondary sources referred to for this research study include government sources [such as the Food and Agriculture Organization (FAO), European Crop Protection Association (ECPA), The Association of Natural Biocontrol Producers (ANBP), National Pesticide Information Center (NPIC), and Organization for Economic Co-operation and Development (OECD)], corporate filings (such as annual reports, press releases, investor presentations, and financial statements), and trade, business, and professional associations, among others. The secondary data was collected and analyzed to arrive at the overall market size, which was further validated by primary research.
Primary Research
Extensive primary research was conducted after acquiring information about the beneficial insects market scenario through secondary research. Several primary interviews were conducted with market experts from the demand side (beneficial insects wholesale distributors) and supply side (beneficial insects suppliers and importers & exporters) across five major regions, namely, North America, Europe, Asia-Pacific, Latin America, and the Rest of the World. Approximately 20% and 80% of the primary interviews were conducted with the demand and supply sides, respectively. This primary data was collected through questionnaires, mails, and telephonic interviews.
To know about the assumptions considered for the study, download the pdf brochure
Market Size Estimation
Both the top-down and bottom-up approaches were used to estimate and validate the total size of the beneficial insect market. These approaches were also used extensively to determine the size of various subsegments in the market. The research methodology used to estimate the market size includes the following details:
-
Top-down approach:
- The key industry and market players were identified through extensive secondary research.
- The industry's supply chain and market size were determined through primary and secondary research.
- All percentage share splits and breakdowns were determined using secondary sources and verified through primary sources.
- The adjacent market—the agricultural biologicals and biocontrol market—was considered to validate further the market details of indoor farming technology.
-
Bottom-up approach:
- The market size was analyzed based on the share of each type of beneficial insect and its penetration within the type at regional and country levels. Thus, the global market was estimated with a bottom-up approach of the type at the country level.
- Other factors include demand within the supply chain, including the beneficial insects; function trends; pricing trends; adoption rate and price factors; patents registered; and organic and inorganic growth attempts.
- All macroeconomic and microeconomic factors affecting the beneficial insects market were considered while estimating the market size.
- All possible parameters that affect the market covered in this research study were accounted for, viewed in extensive detail, verified through primary research, and analyzed to obtain final quantitative and qualitative data.
Market size estimation: Bottom-up approach
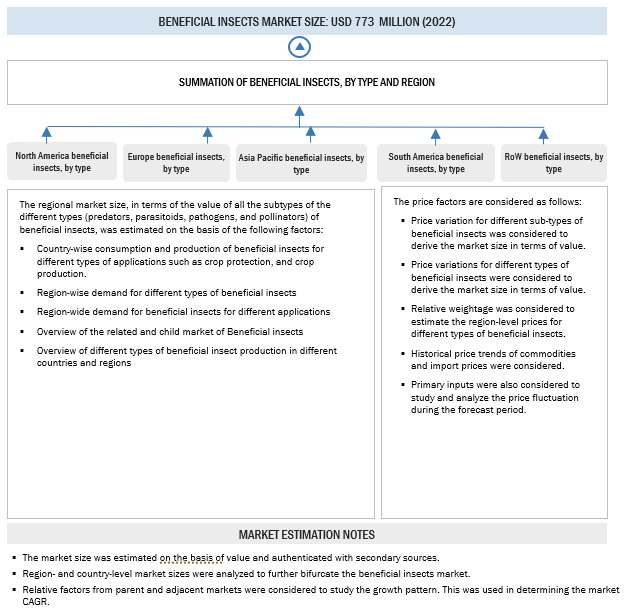
In the bottom-up approach, each country's market size for beneficial insects and the by type, including predators, parasitoids, pathogens, and pollinators, was arrived at through secondary sources, such as annual reports, investor presentations, journals, and government publications. The bottom-up procedure was also implemented on the data extracted from secondary research to validate the market segment sizes obtained.
The penetration rate of beneficial insects as a percentage of the application sector in each country was calculated from secondary sources. Country-level data for beneficial insects were estimated based on the adoption rate of beneficial insects within the type. The by type was tracked via product mapping and studied for its penetration level to estimate the market size at the regional level. Each product type was studied for its commercially available growing system and component type. The market size arrived at was further validated by primary respondents.
Beneficial Insects Market Size Estimation: Bottom-Up Approach
To know about the assumptions considered for the study, Request for Free Sample Report
Market Size Estimation Methodology: Top-down Approach
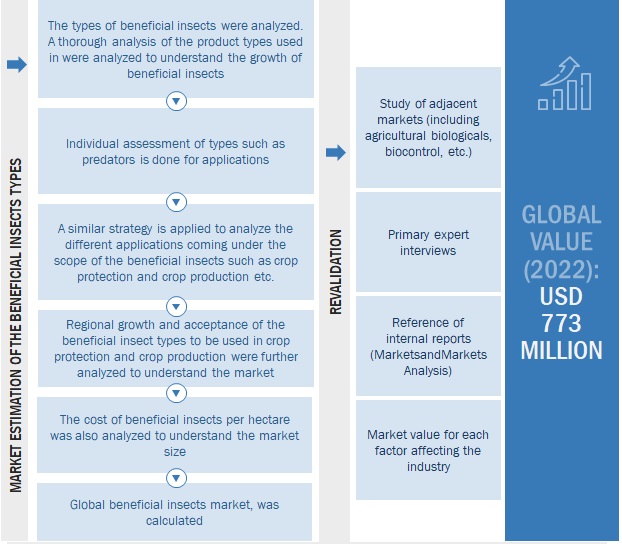
For the calculation of each type of specific market segment, the most appropriate, immediate parent and peer market sizes were used for implementing the top-down procedure.
Further, appropriate weightage was assigned to the data derived from each parameter to arrive at the final shares for each region. The regional demand-supply trends, presence of manufacturing units, and regulatory scenario were also analyzed to further validate the shares arrived at. These shares were then confirmed with primary respondents from across regions.
Data Triangulation
After arriving at the overall market size from the estimation process explained above, the total market was split into several segments and subsegments. To estimate the overall beneficial insects market and arrive at the exact statistics for all segments and subsegments, data triangulation and market breakdown procedures were employed, wherever applicable. The data was triangulated by studying various factors and trends from the demand and supply sides. Along with this, the market size was validated using both the top-down and bottom-up approaches.
Market Definition
Beneficial insects are biological and eco-friendly entities that are used to prevent damage caused by pests and to increase crop yield. They comprise living organisms that are predatory or parasitic in terms of mode of action against pests and insects. Pathogens are the microbes associated with plants that have a strong influence on plant growth, development, and yield. They help in controlling the growth of unnecessary crops and plants. They also include pollinators, which help in crop production by transferring pollen grains from the anthers to the stigma for fertilization. These beneficial insects assist in pollination and pest control.
Key Stakeholders
- Manufacturers, importers & exporters, traders, distributors, and suppliers of biologicals kits, equipment, reagents, chemicals, and other related consumables
-
Biological laboratories and associations
- Biological Products Industry Alliance (BPIA)
- The Fertilizer Institute
- Food raw material suppliers
- Food ingredient, intermediate, and end-product manufacturers, and processors
-
Government, research organizations, and institutions
- World Health Organization (WHO)
- Codex Alimentarius Commission (CAC)
-
Regulatory bodies
- Food and Agriculture Organization (FAO)
- US Department of Agriculture (USDA)
- Biopesticide Industry Alliance (BPIA)
- International Biocontrol Manufacturers Association (IBMA)
- Japan Biocontrol Association
- US Environmental Protection Agency (US EPA)
- Commercial Research & Development (R&D) institutions and financial institutions
- Regulatory bodies, including government agencies and NGOs.
Report Objectives
Market Intelligence
- Determining and projecting the size of the beneficial insect market based on type, application, crop type, and region over a five-year period ranging from 2023 to 2028.
- Identifying the attractive opportunities in the market by determining the largest and fastest-growing segments across the key regions
-
Analyzing the demand-side factors based on the following:
- Impact of macro- and microeconomic factors on the market
- Shifts in demand patterns across different subsegments and regions.
- Providing detailed information about the key factors influencing the growth of the market (drivers, restraints, opportunities, and industry-specific challenges)
- To analyze the opportunities in the market for stakeholders and provide a competitive landscape for market leaders.
- To strategically profile the key players and comprehensively analyze their core competencies.
- To analyze competitive developments such as joint ventures, mergers & acquisitions, new product developments, and research & development (R&D) in the beneficial insects market
Competitive Intelligence
- Identifying and profiling the key market players in the beneficial insects market
-
Providing a comparative analysis of the market leaders based on the following:
- Product offerings
- Business strategies
- Strengths and weaknesses
- Key financials
- Understanding the competitive landscape and identifying the major growth strategies adopted by players across the key region.
- Analyzing the value chain and regulatory frameworks across regions and their impact on prominent market players
- Providing insights into the key investments and product innovations, and technology in the beneficial insects market
Available Customizations:
With the given market data, MarketsandMarkets offers customizations according to company-specific scientific needs.
The following customization options are available for the report:
Product Analysis
- Product Matrix, which gives a detailed comparison of the product portfolio of each company.
Geographic Analysis
With the given market data, MarketsandMarkets offers customizations according to company-specific scientific needs.
- Further breakdown of the Rest of Europe's beneficial insects market by key country
- Further breakdown of the Rest of South America's beneficial insects market by key country
Company Information
- Detailed analyses and profiling of additional market players


Growth opportunities and latent adjacency in Beneficial Insects Market