Benzoic Acid Market by Application (Benzoates, Benzoate Plasticizers, Alkyd Resins, Benzoyl Chloride, Animal Feed Additive), End-Use Industry (Food & Beverages, Chemical, Pharmaceutical), and Region - Global Forecast to 2023


[137 Pages Report] The global benzoic acid market is projected to grow from an estimated USD 1009.9 million in 2018 to USD 1313.5 million by 2023, at a CAGR of 5.4% during the forecast period. Benzoic acid is a simple aromatic carboxylic acid. It is produced commercially through partial oxidation of toluene with oxygen. It is also found naturally in various plants. Benzoic acid is used as an intermediate product in the manufacturing of salts such as sodium benzoate, potassium benzoate, phenol, and alkyd resins, among others. Food & beverages, chemical, and pharmaceutical end-use industries use benzoic acid in various applications. The base year used for company profiles is 2017, and the forecast has been provided for the period between 2018 and 2023.
Market Dynamics
Drivers
- Rising demand for benzoic acid from the food & beverages industry
- Ongoing urbanization and shift in the consumer lifestyle, particularly in the Asia Pacific region
- Increasing demand for processed food items & beverages
Restraints
- Regulations to limit the use of benzoic acid in packaged food items & beverages
- Prolonged use of benzoic acid can cause harm to lungs and digestive tract
Opportunities
- Replacement of phthalate plasticizers with non-phthalate plasticizers in the European and North American regions
Challenges
- Limited use of benzoic acid as a food preservative in developed economies
- Fluctuating prices of toluene
Increasing Use of benzoic acid in food and beverage industry drives the global benzoic acid market
Benzoic acid is primarily used as a preservative in packaged food items & beverages. It is majorly used to preserve acidic food items & beverages such as pickles, jams, fruit juices, aerated drinks, and sparkling drinks, among others. The increased use of benzoic acid as a food preservative can be attributed to the fact that it does not alter or affect the odor or taste of the food items or drinks to which it is added. The growth of the food & beverages end-use industry segment of the benzoic acid market is also due to change in the consumer preferences for packaged food items & drinks, and increased per capita income of consumers. There is also a significant growth witnessed by the processed and packaged food & beverages industry due to the increased demand for frozen food items & drinks across the globe. The growing food preservative market in China and India is expected to drive the growth of the food & beverages end-use industry segment of the benzoic acid market across the globe.
The objectives of this study are:
- To analyze and forecast the size of the benzoic acid market, in terms of value and volume
- To define, segment, and estimate the size of the benzoic acid market based on application, and end-use industry
- To project the size of the benzoic acid market and its segments, in terms of volume and value, with respect to five main regions, namely, Asia Pacific, North America, Europe, Middle East & Africa, and South America
- To provide detailed information regarding the crucial factors such as drivers, restraints, opportunities, and industry-specific challenges influencing the growth of the benzoic acid market
- To strategically analyze micro markets with respect to the individual growth trends, prospects, and their contribution to the total benzoic acid market
- To analyze the opportunities in the benzoic acid market for stakeholders and provide a competitive landscape of the market
- To track and analyze competitive developments such as new product launches, acquisitions, investments, expansions, partnerships, agreements, joint ventures, collaborations, and product approvals in the benzoic acid market
- To strategically profile the profile the key players and comprehensively analyze their market shares and core competencies
The years considered for the study are:
- Base Year – 2017
- Estimated Year – 2018
- Projected Year – 2023
- Forecast Period – 2018 to 2023
For company profiles in the report, 2017 has been considered as the base year. In cases wherein information is unavailable for the base year, the years prior to it have been considered.
Research Methodology
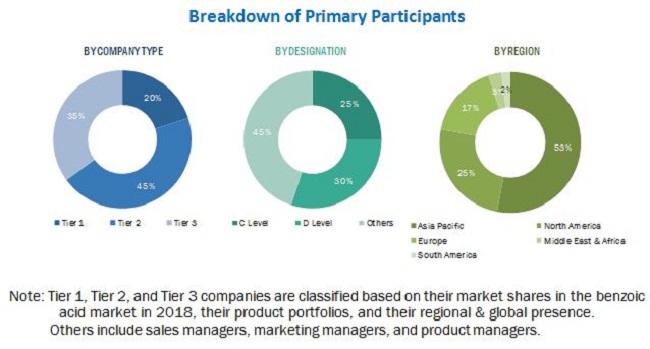
The research methodology used to estimate and forecast the global benzoic acid market began with capturing data on key vendor revenues through secondary sources, such as Hoovers, Bloomberg, Chemical Weekly, Factiva, and various other government and private websites. Vendor offerings have also been taken into consideration to determine the market segmentation. After arriving at the overall market size, the total market was split into several segments and subsegments, which were later verified through primary research by conducting extensive interviews with key personnel, such as CEOs, VPs, directors, and executives. Data triangulation and market breakdown procedures were employed to complete the overall market engineering process and arrive at the exact statistics for all segments and subsegments of the market. The breakdown of profiles of primaries is depicted in the figure below.
To know about the assumptions considered for the study, download the pdf brochure
The benzoic acid market has a diversified ecosystem of upstream players, including raw material suppliers, along with downstream stakeholders, vendors, and government organizations. Companies operating in the benzoic acid market include Emerald Performance Materials (US), Wuhan Youji Industries Co. (China), Tianjin Dongda Chemical Group (China), and Liao Ning Huayi Chemical Industry & Commerce Co. (China), among others.
Target Audience
- Manufacturers of Benzoic Acid and its Salts
- Manufacturers of Benzoic Acid, End-use Industries
- Traders, Distributors, and Suppliers of Benzoic Acid
- Regional Manufacturers' Associations and Benzoic Acid
- Government and Regional Agencies
- Consulting Companies/Consultants in Chemical and Material Sectors
“This study answers several questions for stakeholders, primarily the market segments which they need to focus upon during the next two to five years so that they may prioritize their efforts and investments accordingly.”
Scope of the Report:
This research report categorizes the benzoic acid market based on end-use industry, application, and region, and forecasts revenues as well as analyzes trends in each of the submarkets.
On the Basis of End-Use Industry:
- Food & Beverages
- Chemical
- Pharmaceutical
On the Basis of Application:
- Benzoates
- Benzoate plasticizers
- Benzoyl Chloride
- Alkyd Resins
- Animal Feed Additive
On the Basis of Region:
- Asia Pacific
- North America
- Europe
- Middle East & Africa
- South America
The following customization options are available for the report:
Along with the given market data, MarketsandMarkets offers customizations as per the company’s specific needs. The following customization options are available for the report:
Product Analysis
- Product matrix, which provides a detailed comparison of the product portfolio of each company.
Geographic Analysis
- Further breakdown of the Rest of Asia Pacific, Rest of the Middle East & Africa, Rest of Europe, and Rest of South America benzoic acid markets.
Company Information
- Detailed analysis and profiles of additional market players (up to five companies).
The benzoic acid market is projected to grow from an estimated USD 1009.9 million in 2018 to USD 1313.5 million by 2023, at a CAGR of 5.4% from 2018 to 2023. Benzoic acid is extensively used to manufacture sodium benzoate and potassium benzoate which are also known as its derivatives.
The benzoic acid unit market, by application is segmented into benzoates, benzoate plasticizers, benzoyl chloride, alkyd resins, animal feed additive, among others. The benzoate plasticizers segment is expected to grow at the highest CAGR during the forecast period due to the growing demand for non-phthalate plasticizers, which include benzoate plasticizers in various applications such as flooring & wall coverings, wires & cables, and consumers goods, among others is driving the growth of the benzoic acid market globally.
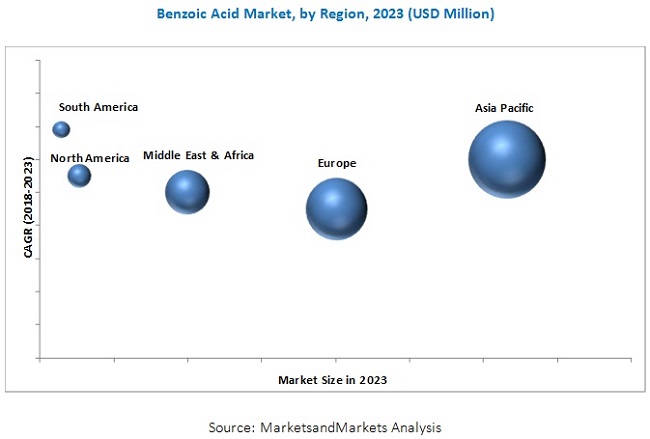
By end-use industry, the benzoic acid market is segmented into chemical, food & beverages and pharmaceutical. The food & beverages segment accounted for the major share of the overall market in 2018 during the forecast period. The ongoing urbanization and changing lifestyle of masses are the factors leading to the increased demand for packaged food items. Benzoic acid, which is majorly consumed as sodium benzoate and potassium benzoate, is directly used as a food preservative in the food & beverages end-use industry. Thus, increase in demand of food packaged sales leads to the growth of the benzoic acid market across the globe.
South America is expected to be the fastest-growing market for benzoic acid during the forecast period. The South American countries have huge growth prospects for the benzoic acid market because of the growing applications of refrigeration in various end-use industries such as chemical and pharmaceutical. The growth of the pharmaceutical end-use industry segment of the South America benzoic acid market can be attributed to the flourishing pharmaceutical industry in the region, which is growing at a rate of 12%, annually.
Benzoic Acid applications in the benzoate plasticizers drive the growth of benzoic acid market
Benzoates
The benzoates application segment of the benzoic acid market includes sodium benzoate and potassium benzoate. The growth of the benzoates application segment of the benzoic acid market can be attributed to change in consumer preferences for packaged food items & drinks and increased per capita income of consumers. Benzoates are used as food preservatives in pickles, jams, fruit juices, soft drinks, etc. There is also a significant growth witnessed by the processed and packaged food & beverages industry due to the increased demand for frozen food items & drinks across the globe.
Benzoate Plasticizers
Benzoate plasticizers are used in the building & construction industry in the form of wires & cables and flooring & wall coverings, among others. In the past few years, researchers have found that phthalate plasticizers cause severe harm to human health, thereby resulting in breast cancer, neurodevelopmental issues, etc. Thus, there is a growing demand for phthalate-free plasticizers, and benzoate plasticizers fall under this category.
Alkyd Resins
Alkyd resins are used in furniture & architectural coatings, product finishes, and automotive refinishing primers. Benzoic acid is used across a range of applications in various end-use industries due to easy availability of pure quality alkyd resins and their low development costs.
Benzoyl Chloride
Benzoyl chloride is used in several industrial applications to manufacture perfumes and resins, among others. The growth of various end-use industries such as pharmaceutical and cosmetics in emerging economies such as China and India is driving the demand for benzoic acid in the Asia Pacific region.
Critical questions the report answers:
- Where will all these developments take the industry in the mid to long term?
- What are the upcoming industry applications for benzoic acid?
To speak to our analyst for a discussion on the above findings, click Speak to Analyst
The growing concerns regarding harmful effects caused by excess consumption of benzoic acid on human health may adversely impact the growth of the benzoic acid market across the globe. Various regulations that mandate the manufacture and use benzoic acid have created complexities and uncertainties for manufacturers regarding the usage of benzoic acid in any food & beverages. This may also affect the benzoic acid market.
Key players operating in the benzoic acid market include Emerald Performance Materials (US), Wuhan Youji Industries Co. (China), Tianjin Dongda Chemical Group (China), and Liao Ning Huayi Chemical Industry & Commerce Co. (China), among others. These companies focus on investing in capacity expansions of plants to achieve growth in the benzoic acid market.
 Exclusive indicates content/data unique to MarketsandMarkets and not available with any competitors.
Table of Contents
1 Introduction (Page No. - 15)
1.1 Objectives of the Study
1.2 Market Definition
1.3 Scope of the Study
1.3.1 Regional Scope
1.3.2 Years Considered for the Study
1.4 Currency
1.5 Limitation
1.6 Stakeholders
2 Research Methodology (Page No. - 18)
2.1 Research Data
2.1.1 Secondary Data
2.1.1.1 Key Data From Secondary Sources
2.1.2 Primary Data
2.1.2.1 Key Data From Primary Sources
2.1.2.2 Key Industry Insights
2.1.2.3 Breakdown of Primary Interviews
2.2 Market Size Estimation
2.2.1 Bottom-Up Approach
2.2.2 Top-Down Approach
2.3 Data Triangulation
2.4 Assumptions
3 Executive Summary (Page No. - 26)
3.1 Benzoic Acid Market, By End-Use Industry
3.2 Benzoic Acid Market, By Application
3.3 Benzoic Acid Market, By Region
4 Premium Insights (Page No. - 30)
4.1 Significant Growth Opportunities In the Benzoic Acid Market
4.2 Benzoic Acid Market, By Region
4.3 Asia Pacific Benzoic Acid Market, By Country and Application
4.4 Benzoic Acid Market, By Application and Region
4.5 Benzoic Acid Market, By Country
5 Market Overview (Page No. - 33)
5.1 Introduction
5.2 Market Dynamics
5.2.1 Drivers
5.2.1.1 Rising Demand for Benzoic Acid From the Food & Beverages Industry
5.2.1.2 Ongoing Urbanization and Shift In the Consumer Lifestyle,Particularly In the Asia Pacific Region
5.2.1.3 Increasing Demand for Processed Food Items & Beverages
5.2.2 Restraints
5.2.2.1 Regulations to Limit the Use of Benzoic Acid In Packaged Food Items & Beverages
5.2.2.2 Prolonged Use of Benzoic Acid Can Cause Harm to Lungs and Digestive Tract
5.2.3 Opportunities
5.2.3.1 Replacement of Phthalate Plasticizers With Non-Phthalate Plasticizers In the European and North American Regions
5.2.4 Challenges
5.2.4.1 Limited Use of Benzoic Acid as A Food Preservative In Developed Economies
5.2.4.2 Fluctuating Prices of Toluene
5.3 Porter’s Five Forces Analysis
5.3.1 Threat of New Entrants
5.3.2 Bargaining Power of Suppliers
5.3.3 Threat of Substitutes
5.3.4 Bargaining Power of Buyers
5.3.5 Intensity of Competitive Rivalry
5.4 Macroeconomic Indicators
5.4.1 Food Preservatives Market
5.4.2 Non-Phthalate Plasticizers Market
5.5 Derivatives
5.5.1 Sodium Benzoate
5.5.2 Potassium Benzoate
5.5.3 Benzyl Chloride
5.5.4 Benzyl Benzoate
6 Benzoic Acid Market, By Application (Page No. - 42)
6.1 Introduction
6.2 Benzoates
6.3 Benzoate Plasticizers
6.4 Alkyd Resins
6.5 Benzoyl Chloride
6.6 Animal Feed Additive
6.7 Others
7 Benzoic Acid Market, By End-Use Industry (Page No. - 50)
7.1 Introduction
7.2 Food & Beverages
7.3 Chemical
7.4 Pharmaceutical
7.5 Others
8 Benzoic Acid Market, By Region (Page No. - 57)
8.1 Introduction
8.2 Asia Pacific
8.2.1 China
8.2.2 Japan
8.2.3 India
8.2.4 South Korea
8.2.5 Singapore
8.2.6 Malaysia
8.2.7 Australia
8.2.8 Rest of Asia Pacific
8.3 Europe
8.3.1 Germany
8.3.2 The Netherlands
8.3.3 France
8.3.4 UK
8.3.5 Italy
8.3.6 Russia
8.3.7 Spain
8.3.8 Rest of Europe
8.4 North America
8.4.1 US
8.4.2 Canada
8.4.3 Mexico
8.5 Middle East & Africa
8.5.1 Saudi Arabia
8.5.2 Iran
8.5.3 Rest of the Middle East & Africa
8.6 South America
8.6.1 Brazil
8.6.2 Argentina
8.6.3 Rest of South America
9 Competitive Landscape (Page No. - 106)
9.1 Overview
9.2 Market Share Analysis
9.3 Competitive Situations & Trends
9.3.1 Expansions
9.3.2 Agreements
10 Company Profiles (Page No. - 111)
10.1 Ariha Chemicals
10.2 Emerald Performance Materials
10.3 Ganesh Benzoplast
10.4 Hemadri Chemicals
10.5 IG Petrochemicals
10.6 Krishna Chemicals
10.7 Navyug Pharmachem
10.8 Nimbasia
10.9 Premier Group of Industries
10.10 Reliance Industries
10.11 Tianjin Dongda Chemical Group
10.12 Wuhan Youji Industries Co.
10.13 Other Leading Players
10.13.1 Avantor Performance Materials
10.13.2 Choice Organochem
10.13.3 Eastman Chemical Company
10.13.4 Fushimi Pharmaceutical Co.
10.13.5 Indian Oil Corporation
10.13.6 Liao Ning Huayi Chemical Industry & Commerce Co.
10.13.7 PAT Impex
10.13.8 Primechem Enterprises
10.13.9 SAN FU Chemical Group Co.
10.13.10 Sinteza
10.13.11 Smart Chemicals Group Co.
10.13.12 Swastik Industries
10.13.13 Triveni Interchem
10.13.14 the Chemical Company
10.13.15 Velsicol Chemical
10.13.16 JQC (Huayin) Pharmaceutical Co.
11 Appendix (Page No. - 129)
11.1 Discussion Guide
11.2 Knowledge Store: Marketsandmarkets’ Subscription Portal
11.3 Introducing Rt: Real-Time Market Intelligence
11.4 Available Customizations
11.5 Related Reports
11.6 Author Details
List of Tables (113 Tables)
Table 1 Food Preservatives Market, By Region, 2014–2021 (USD Million)
Table 2 Benzoic Acid Market, By Application, 2016–2023 (USD Million)
Table 3 By Market, By Application, 2016–2023 (Kilo Tons)
Table 4 By Market In Benzoates, By Region, 2016–2023 (USD Million)
Table 5 By Market In Benzoates, By Region, 2016–2023 (Kilo Tons)
Table 6 By Market In Benzoate Plasticizers, By Region, 2016–2023 (USD Million)
Table 7 By Market In Benzoate Plasticizers, By Region, 2016–2023 (Kilo Tons)
Table 8 By Market In Alkyd Resins, By Region, 2016–2023 (USD Million)
Table 9 By Market In Alkyd Resins, By Region, 2016–2023 (Kilo Tons)
Table 10 By Market In Benzoyl Chloride, By Region, 2016–2023 (USD Million)
Table 11 By Market In Benzoyl Chloride, By Region, 2016–2023 (Kilo Tons)
Table 12 By Market In Animal Feed Additive, By Region, 2016–2023 (USD Million)
Table 13 By Market In Animal Feed Additive, By Region, 2016–2023 (Kilo Tons)
Table 14 By Market In Other Applications, By Region, 2016–2023 (USD Million)
Table 15 By Market In Other Applications, By Region, 2016–2023 (Kilo Tons)
Table 16 By Market, By End-Use Industry, 2016–2023 (USD Million)
Table 17 By Market, By End-Use Industry, 2016–2023 (Kilo Tons)
Table 18 By Market for Food & Beverages, By Region, 2016–2023 (USD Million)
Table 19 By Market for Food & Beverages, By Region, 2016–2023 (Kilo Tons)
Table 20 By Market for Chemical, By Region, 2016–2023 (USD Million)
Table 21 By Market for Chemical, By Region, 2016–2023 (Kilo Tons)
Table 22 By Market for Pharmaceutical, By Region, 2016–2023 (USD Million)
Table 23 By Market for Pharmaceutical, By Region, 2016–2023 (Kilo Tons)
Table 24 By Market for Other End-Use Industries, By Region, 2016–2023 (USD Million)
Table 25 By Market for Other End-Use Industries, By Region, 2016–2023 (Kilo Tons)
Table 26 By Market, By Region, 2016–2023 (USD Million)
Table 27 By Market, By Region, 2016-2023 (Kilo Tons)
Table 28 By Market, By End-Use Industry, 2016-2023 (USD Million)
Table 29 By Market, By End-Use Industry, 2016-2023 (Kilo Tons)
Table 30 By Market, By Application, 2016-2023 (USD Million)
Table 31 By Market, By Application, 2016-2023 (Kilo Tons)
Table 32 Asia Pacific Benzoic Acid Market, By Country, 2016-2023 (USD Million)
Table 33 Asia Pacific Market, By Country, 2016-2023 (Kilo Tons)
Table 34 Asia Pacific Market, By End-Use Industry, 2016-2023 (USD Million)
Table 35 Asia Pacific Market, By End-Use Industry, 2016-2023 (Kilo Tons)
Table 36 Asia Pacific Market, By Application, 2016-2023 (USD Million)
Table 37 Asia Pacific Market, By Application, 2016-2023 (Kilo Tons)
Table 38 China By Market, By Application, 2016-2023 (USD Million)
Table 39 China By Market, By Application, 2016-2023 (Kilo Tons)
Table 40 Japan By Market, By Application, 2016-2023 (USD Million)
Table 41 Japan By Market, By Application, 2016-2023 (Kilo Tons)
Table 42 India By Market, By Application, 2016-2023 (USD Million)
Table 43 India By Market, By Application, 2016-2023 (Kilo Tons)
Table 44 South Korea By Market, By Application, 2016-2023 (USD Million)
Table 45 South Korea By Market, By Application, 2016-2023 (Kilo Tons)
Table 46 Singapore Benzoic Acid Market, By Application, 2016-2023 (USD Million)
Table 47 Singapore Market, By Application, 2016-2023 (Kilo Tons)
Table 48 Malaysia Benzoic Acid Market, By Application, 2016-2023 (USD Million)
Table 49 Malaysia Market, By Application, 2016-2023 (Kilo Tons)
Table 50 Australia Benzoic Acid Market, By Application, 2016-2023 (USD Million)
Table 51 Australia Market, By Application, 2016-2023 (Kilo Tons)
Table 52 Rest of Asia Pacific By Market, By Application, 2016-2023 (USD Million)
Table 53 Rest of Asia Pacific By Market, By Application, 2016-2023 (Kilo Tons)
Table 54 Europe By Market, By Country, 2016-2023 (USD Million)
Table 55 Europe Benzoic Acid Market, By Country, 2016-2023 (Kilo Tons)
Table 56 Europe Market, By Application, 2016-2023 (USD Million)
Table 57 Europe Market, By Application, 2016-2023 (Kilo Tons)
Table 58 Europe Market, By End-Use Industry, 2016-2023 (USD Million)
Table 59 Europe Market, By End-Use Industry, 2016-2023 (Kilo Tons)
Table 60 Germany By Market, By Application, 2016-2023 (USD Million)
Table 61 Germany By Market, By Application, 2016-2023 (Kilo Tons)
Table 62 Netherlands By Market, By Application, 2016-2023 (USD Million)
Table 63 Netherlands By Market, By Application, 2016-2023 (Kilo Tons)
Table 64 France By Market, By Application, 2016-2023 (USD Million)
Table 65 France By Market, By Application, 2016-2023 (Kilo Tons)
Table 66 UK By Market, By Application, 2016-2023 (USD Million)
Table 67 UK By Market, By Application, 2016-2023 (Kilo Tons)
Table 68 Italy By Market, By Application, 2016-2023 (USD Million)
Table 69 Italy By Market, By Application, 2016-2023 (Kilo Tons)
Table 70 Russia By Market, By Application, 2016-2023 (USD Million)
Table 71 Russia By Market, By Application, 2016-2023 (Kilo Tons)
Table 72 Spain By Market, By Application, 2016-2023 (USD Million)
Table 73 Spain By Market, By Application, 2016-2023 (Kilo Tons)
Table 74 Rest of Europe Benzoic Acid Market, By Application, 2016-2023 (USD Million)
Table 75 Rest of Europe By Market, By Application, 2016-2023 (Kilo Tons)
Table 76 North America Benzoic Acid Market, By Country, 2016-2023 (USD Million)
Table 77 North America Market, By Country, 2016-2023 (Kilo Tons)
Table 78 North America Market, By End-Use Industry, 2016-2023 (USD Million)
Table 79 North America Market, By End-Use Industry, 2016-2023 (Kilo Tons)
Table 80 North America Market, By Application, 2016-2023 (USD Million)
Table 81 North America Market, By Application, 2016-2023 (Kilo Tons)
Table 82 US By Market, By Application, 2016-2023 (USD Million)
Table 83 US By Market, By Application, 2016-2023 (Kilo Tons)
Table 84 Canada By Market, By Application, 2016-2023 (USD Million)
Table 85 Canada By Market, By Application, 2016-2023 (Kilo Tons)
Table 86 Mexico By Market, By Application, 2016-2023 (USD Million)
Table 87 Mexico By Market, By Application, 2016-2023 (Kilo Tons)
Table 88 Middle East & Africa By Market, By Country, 2016-2023 (USD Million)
Table 89 Middle East & Africa By Market, By Country, 2016-2023 (Kilo Tons)
Table 90 Middle East & Africa By Market, By End-Use Industry, 2016-2023 (USD Million)
Table 91 Middle East & Africa By Market, By End-Use Industry, 2016-2023 (Kilo Tons)
Table 92 Middle East & Africa By Market, By Application, 2016-2023 (USD Million)
Table 93 Middle East & Africa By Market, By Application, 2016-2023 (Kilo Tons)
Table 94 Saudi Arabia By Market, By Application, 2016-2023 (USD Million)
Table 95 Saudi Arabia By Market, By Application, 2016-2023 (Kilo Tons)
Table 96 Iran By Market, By Application, 2016-2023 (USD Million)
Table 97 Iran By Market, By Application, 2016-2023 (Kilo Tons)
Table 98 Rest of the Middle East & Africa By Market, By Application, 2016-2023 (USD Million)
Table 99 Rest of the Middle East & Africa By Market, By Application, 2016-2023 (Kilo Tons)
Table 100 South America Benzoic Acid Market, By Country, 2016-2023 (USD Million)
Table 101 South America Market, By Country, 2016-2023 (Kilo Tons)
Table 102 South America Market, By End-Use Industry, 2016-2023 (USD Million)
Table 103 South America Market, By End-Use Industry, 2016-2023 (Kilo Tons)
Table 104 South America Market, By Application, 2016-2023 (USD Million)
Table 105 South America Market, By Application, 2016-2023 (Kilo Tons)
Table 106 Brazil By Market, By Application, 2016-2023 (USD Million)
Table 107 Brazil By Market, By Application, 2016-2023 (Kilo Tons)
Table 108 Argentina By Market, By Application, 2016-2023 (USD Million)
Table 109 Argentina By Market, By Application, 2016-2023 (Kilo Tons)
Table 110 Rest of South America By Market, By Application, 2016-2023 (USD Million)
Table 111 Rest of South America By Market, By Application, 2016-2023 (Kilo Tons)
Table 112 Expansions, January 2013 to January 2018
Table 113 Agreements, January 2013 to January 2018
List of Figures (25 Figures)
Figure 1 Benzoic Acid Market Segmentation
Figure 2 Benzoic Acid Market: Research Design
Figure 3 Benzoic Acid Market: Data Triangulation
Figure 4 The Food & Beverages End-Use Industry Segment Is Projected to Lead the Benzoic Acid Market Between 2018 and 2023
Figure 5 The Benzoate Plasticizers Application Segment of the Benzoic Acid Market Is Projected to Grow at The Highest Cagr Between 2018 and 2023
Figure 6 The Asia Pacific Region Is Projected to Be the Largest Market for Benzoic Acid Between 2018 and 2023
Figure 7 Benzoic Acid Market Is Projected to Witness Moderate Growth Between 2018 and 2023
Figure 8 The South America Benzoic Acid Market Is Projected to Grow at the Highest Rate From 2018 to 2023
Figure 9 The Food & Beverages End-Use Industry Segment Is Expected to Lead the Asia Pacific Benzoic Acid Market In 2018
Figure 10 the Benzoates Application Segment Is Projected to Lead the Asia Pacific Benzoic Acid Market In 2018
Figure 11 China Is Projected to Lead the Benzoic Acid Market Between 2018 and 2023
Figure 12 Dynamics of the Benzoic Acid Market
Figure 13 Global Sales of Packaged Food Items From 2014 to 2019 (USD Trillion)
Figure 14 The Benzoate Plasticizers Application Segment of the Benzoic Acid Market Is Projected to Grow at the Highest Cagr From 2018 to 2023
Figure 15 The Food & Beverages End-Use Industry Segment Is Projected to Lead the Benzoic Acid Market From 2018 to 2023
Figure 16 Regional Snapshot
Figure 17 Asia Pacific Benzoic Acid Market Snapshot
Figure 18 Europe Benzoic Acid Market Snapshot
Figure 19 North America Benzoic Acid Market Snapshot
Figure 20 Middle East & Africa Benzoic Acid Market Snapshot
Figure 21 South America Benzoic Acid Market Snapshot
Figure 22 Companies Adopted Organic Growth Strategies Between January 2013 and January 2018
Figure 23 Market Share Analysis of the Top Players of the Benzoic Acid Market In 2017
Figure 24 IG Petrochemicals: Company Snapshot
Figure 25 Reliance Industries: Company Snapshot


Growth opportunities and latent adjacency in Benzoic Acid Market