Bioadhesives Market

Bioadhesives Market by Type (Plant based and Animal based), by Application (Paper& Packaging, Construction, Woodworking, Personal Care, Medical), Region (APAC, North America, Europe, Middle East & Africa, South America) - Global Forecast to 2025

Report Code: CH 3015 Mar, 2021, by marketsandmarkets.com

The bioadhesives market size was valued at USD 6.0 billion in 2020 and is projected to reach USD 9.7 billion by 2025, growing at a cagr 10.0% from 2020 to 2025.

The global market for bioadhesives is witnessing high growth due to governmental regulations and policies to control environmental pollution and consumer awareness for biodegradable products. The growing use of bio-based products in end-use industries is also driven by the demand for high-quality biodegradable products, investment in the market, and government policies and subsidies. The major applications of bioadhesives are packaging & paper, construction, wood, personal care, and medical.

Bioadhesive Market

To know about the assumptions considered for the study, download the pdf brochure

Impact of COVID-19 on Bioadhesives Market

The outbreak of the novel coronavirus or COVID-19 wreaked havoc on the global economy. The global economy experienced a recession due to the pandemic,y with the lockdown of international borders and the shutdown of economic activities across countries to prevent the spread of COVID-19.

According to the IMF, a recession as bad as the global economic crisis of 2008 or worse hit the global economy in 2020. The IMF warned of a total output loss of USD 9 trillion in the world economy between 2020 and 2021. The extent of the economic damage still depends on how the virus spreads throughout Europe, the US, and other major economies.

  • According to economists, the Chinese economy is likely to be hit further by reduced global demand for its products due to the effect of the pandemic. As the coronavirus pandemic escalates, the growth rate falls sharply against the backdrop of volatile markets and growing credit stress.
  • The economy of China has been hit far harder than projected, although a tentative stabilization has begun. In European countries and the US, increasing restrictions on travel & transportation and prolonged lockdown have reduced the demand during the first quarter of 2020. However, the market is expected to recover by the end of the year.
  • Central banks have swung into action and are undertaking some combination of sharply reduced policy rates, resumed assets purchase, and liquidity injections. Fiscal authorities have generally lagged but have begun to loosen the purse strings. As per MarketsandMarkets analysis, larger and more targeted spending to the most affected groups is expected.
  • Restrictions on movement in Europe and the US are putting a severe dent in economic activities. India and Southeast Asian countries are also facing major disruption in their economies.

Market Dynamics

Driver: Increasing regulations & policies against use of petrochemical-based adhesives

Currently, synthetic adhesives are used most commercially for varied industrial applications. Over the years, with an increase in environmental concerns and regulatory policies, various countries have been adopting bio-based products in various applications. Furthermore, global manufacturers of adhesives are focusing on bio-products to ensure safety and avoid health issues and hazards caused by VOC emissions from synthetic or petro-based adhesives.

European and North American regions are highly regulated by environmental laws. Some agencies, such as the US Environmental Protection Agency (EPA) and the Food and Drug Administration (FDA), give preference to the use of bio-based contents in adhesives. Thus, promoting R&D activities and investments to encourage the production of bio-based renewable products.

Restraint: Competition from substitutes

Bioadhesives are derived from renewable resources and have the potential to replace adhesives based on petroleum feedstock. Bioadhesives face major competition from synthetically-derived adhesives that are cheaper and easier to manufacture. To enter large markets and overcome the barriers to change, bioadhesives manufacturers have to focus on providing bio-based products at a competitive price. The key market sectors are taking this challenge as an opportunity and are developing technology for the production of bioadhesives with superior performance at a reasonable cost.

The limited capabilities of bioadhesives have been restricting the use of bio and green adhesives in various applications. The performance capabilities of bioadhesives are still under scrutiny, which has restricted the expansion of the bioadhesives market.

Opportunity: Increasing demand for environmentally-friendly products

The growth of the global bioadhesives market is driven by many factors, such as increasing awareness about sustainability and greener products and shift in consumer preferences toward environmentally-friendly products. The global chemical market is investing in the production of innovative bio-based chemicals and pushing manufacturers to create VOC-free products. Thus, the current market need provides ample scope for the growth of environmentally-friendly products in the global chemicals and materials market.

There is also growing demand for environmentally-friendly or green buildings, which provides an opportunity for the development of green and sustainable adhesive solutions. Green adhesive solutions are made from bio-based, renewable, recycled, remanufactured, or biodegradable materials; they are environmentally friendly and provide health benefits to the occupants.

Challenge: Advanced technological know-how

The production of bioadhesives requires advanced formulation and innovative technology. The R&D expenditures involved in developing bio-based products are high compared to other adhesive formulations. Thus, only the leading global manufacturers can make large investments in such product innovation. The major players investing in R&D activities include Henkel AG, EcoSynthetix Inc., 3M Company, Arkema SA, and Cryolife Inc. The smaller players can strategize and come up with innovative products, though it is a huge challenge for them to market the products in the competitive global market. The leading companies are already providing high-quality adhesives products and specialized technical services to their customers. The innovative technology involved in the production of bioadhesives provides sustainable value to adhesive manufacturers and consumers.

The plant-based segment is estimated to account for the larger bioadhesives market share during the forecast period.

Biodegradable and biological plant-based renewable resources are being used as replacement for petro-based raw materials for the manufacturing of adhesives. The companies using bio-based ingredients are expected to introduce technological advancement in the future, to cater to the increasing demand for adhesives in various vertical industries.

The increased demand from the end consumers and the environmental regulations for environmentally-friendly products is on rise, which is pushing the manufacturers to produce bio-based products. Paper & packaging, woodworking, personal care, and medical are the major applications of plant-based adhesives.

Plant-based adhesives are derived from various sources including soybean, lignin, and starch. Furthermore, scarcity of natural resources has led to the discovery of alternative raw material sources. Starch as a raw material is comparatively inexpensive as compared to petroleum and natural gas for the development of adhesives.

Over the past few years, extensive research has been carried out to improve the bonding capacity of starch-based adhesives. Starch-based adhesives are derived from roots, seed, and stalks of staple crops, such as corn, rice, tapioca, wheat, and potato. Starch-based adhesives majorly find use in wood and furniture applications.

Medical is projected to be the fastest-growing application segment of the bioadhesives market during the forecast period.

The use of bioadhesives against the conventional competitive products is driven by high demand from end users, environmental regulations to focus on the renewable or bio-based products, rising fluctuation in the petro-chemical feedstock pricing, among various other factors. Bioadhesives are gaining global attention, owing to the production and use of bio-based ingredients in adhesive manufacturing. This is an effective replacement for synthetic adhesives in applications, such as paper & packaging, construction, woodworking, personal care, and medical.

Developing countries in APAC region, such as China and India are expected to boost the demand for healthcare products due to growing awareness regarding health-related issues. R&D in the medical industry has increased significantly in the recent years; the awareness toward the use of such adhesives in the medical application is expected to boost the demand for bioadhesives in these markets.

APAC to the fastest growing bioadhesives market during the forecast period.

APAC is one of the most promising markets for bioadhesives since there are fewer rules and guidelines laid down by environmental regulators and governments regarding the use of petrochemical-based adhesives. If stringent policies are implemented by regulatory bodies, the region is expected to witness a boom in the production and demand for bioadhesives. Stringent impositions of government regulations to control VOC emissions are yet to be witnessed in most APAC countries.

As compared to North America and Europe, there are very few adhesive companies producing bioadhesives in APAC. The availability of cheap raw materials and labor, along with significant domestic demand, makes this market the most attractive for industry participants. Henkel Corporation (Germany) imports bio-based products to improve biotechnology and cater to the demand for bio-products in APAC. As global companies are demanding bio-based products, global suppliers are offering bioadhesives to these end users to meet the demand in this region.

 Bioadhesives are increasingly demanded in applications, such as paper & packaging, construction, and wood, in APAC. In this region, bioadhesives are mainly imported from European and North American countries. Bioadhesives are fulfilling the demand for biocompatibility, biodegradability, and adhesion in various end-use applications. Also, they are gaining government support because of increasing environmental concerns regarding the use of synthetic adhesives and VOC emissions.

Bioadhesives Market  by Region

APAC has recently witnessed an increase in the demand for chemicals due to large-scale investment in the manufacturing sectors. It is witnessing an increased demand for luxury and better-quality products due to an increase in the purchasing power of consumers. This leads to an increase in the demand for bioadhesives in this market.

Europe to account for the first largest share of the global bioadhesives market during the forecast period.

The European market is led by the demand from countries such as Germany, France, and the UK. The other sizeable consumers include Italy, Spain, Russia, Sweden, Switzerland, Finland, and Turkey. Major manufacturers, such as Henkel Corporation (Germany), Paramelt B.V. (Netherlands), and Yparex B.V. (Netherlands), are producing different grades of adhesives with bio-contents.

The major advantage of bioadhesives is that the vast majority of them do not emit hazardous VOCs and are not harmful to human health. However, bioadhesives production is not currently cost-effective enough to compete with the synthetic adhesives manufacturing process. The production of common organic adhesives from biological feedstocks is also being investigated, which allows bioadhesive production at a lower cost and higher quality.

Paper & packaging application includes labels, bags, cartons, disposables, envelopes, foil laminates, and remoisten-able products. Bioadhesives based on starch, dextrin, protein, and other green adhesives are used for bonding various types of consumer products, which include certain packaging materials for food cartons or packets, envelopes & paper-bags, and others.

Bioadhesives Market  by Region

Sluggish economic growth, mature markets, and stringent environmental policies in the European region are the major factors influencing the growth of the bioadhesives market in the region. The European adhesive market in construction application is growing at a high rate. According to EUROCONSTRUCT, the growth of the construction industry was 2.7% in 2018.

The region witnessed de-industrialization and offshoring in labor-intensive manufacturing sectors, which is impacting the demand for bioadhesives. The market in the Rest of Europe is growing due to the expansion of end-use industries. There is increased demand for packaging and construction products in the Rest of Europe, which is boosting the bioadhesives market.

Bioadhesives Market Key Players

The key players in the bioadhesives market are Henkel AG & Company, KGaA (Germany), DuPont de Nemours, Inc., (US), Arkema (Bostik SA) (France), Ashland Global Holdings Inc. (US), Beardow Adams Group (England), Paramelt BV (Netherlands), Jowat SE (Germany), Ingredion Incorporated (US), EcoSynthetix Inc. (Canada),  and Tate & Lyle PLC (UK).

Bioadhesives Market Report Scope

Report Metric

Details

Market Size Value in 2020

USD 6.0 billion

Revenue Forecast in 2025

USD 9.7 billion

CAGR

10.0%

Years considered for the study

2018–2025

Base year

2019

Forecast Period

2020–2025

Units considered

Value (USD Million) and Volume (Kiloton)

Segments

Type and Application

Geographies Covered

APAC, North America, Europe, the Middle East & Africa, and South America

Companies profiled

Henkel AG & Company, KGaA (Germany), DuPont de Nemours, Inc., (US), Arkema (Bostik SA) (France), Ashland Global Holdings Inc. (US), Beardow Adams Group (England), Paramelt BV (Netherlands), Jowat SE (Germany), Ingredion Incorporated (US), EcoSynthetix Inc. (Canada),  and Tate & Lyle PLC (UK).
A total of 21 players are covered.


This research report categorizes the bioadhesives market based on type, application, and region.

Based on Type:

  • Plant based
  • Animal based

Based on Application:

  • Paper & Packaging
  • Construction
  • Woodworking
  • Personal Care
  • Medical
  • Others

Based on Region:

  • APAC
  • North America
  • Europe
  • Middle East & Africa
  • South America

Recent Developments

  • In February 2020, Henkel AG has officially inaugurated its new production facility in Kurkumbh, India, near Pune. With a total investment of about USD 57 million, the business unit aims to serve the growing demand of Indian industries for high-performance solutions in adhesives, sealants and surface treatment products. Designed as a smart factory, the new plant enables a wide range of Industry 4.0 operations and meets the highest standards for sustainability.
  • In December 2019, Henkel opened its new ‘Henkel Adhesives Technical Center’ in the east of Hanoi, Vietnam. Located close to leading consumer electronics and semiconductor companies, the high-tech facility will enable close and inspiring collaborations with leading customers and accelerate the development of high-impact solutions for a broad range of applications for local markets.
  • In May 2019, Arkema announced its plans to acquire the industrial adhesives business of Nitta-Gelatin Inc. The acquisition will be done by Bostik-Nitta JV, of which the majority stake is owned by Bostik. The acquisition helped Bostik increase its share in the adhesives business in Japan. The acquisition was completed on 1st August 2018.
  • In April 2019, Henkel AG opened a new OEM application center in Connecticut to deliver innovative solutions and design customized applications, technologies, and production processes to better serve its customers.
  • In September 2018, Henkel laid the foundation of its new Global Innovation Center for its Adhesive Technologies business. The investment was valued at approximately USD 140 million and was expected to open by the end of 2020. The facility will be the company’s largest production, research, and development site worldwide. The initiative was taken with the intention to support the company’s strategy to offer innovative solutions and comprehensive service for adhesives, sealants, and functional coatings to its customers.
  • In May 2018, Jowat announced the inauguration of its new subsidiary in Thailand. The initiative was taken to cater to the high-growth countries of Asia Pacific. The location will also help to cater to regional customer demands directly and effectively.
  • In November 2017, DuPont announced its acquisition of FMC Corporation’s Health & Nutrition business (FMC H&N). The acquisition includes all segments, except the Omega-3 business. This initiative was taken with the aim to strengthen DuPont’s Nutrition and Health segment by adding new products and help the company gain maximum market share in the pharma excipients industry space.
  • In November 2017, Arkema announced its acquisition of XL Brands, a leader in adhesives for resilient and soft flooring in the US. XL Brands offers various innovative and environmentally-friendly solutions that complement Arkema’s adhesives product range in the US.
  • In October 2017,  Arkema (Bostik), the Specialty Adhesives business line of Arkema, announced its plans to expand its manufacturing capacities with the opening of a new facility in Gujarat, India. Together with its existing plant in Bangalore (India), the new plant will serve the fast-growing demand for adhesives used in industrial markets in India.
  • In May 2017, Arkema announced its acquisition of CMP Specialty Products, the flooring and floor preparation business of US-based company CGM. The acquisition was done with the intention to help strengthen Bostik’s position in the US adhesives market and enter the fast-growing floor preparation market.

Frequently Asked Questions (FAQ):

To speak to our analyst for a discussion on the above findings, click Speak to Analyst

Updated on : December 24, 2022


TABLE OF CONTENTS

1 INTRODUCTION (Page No. - 33)
    1.1 OBJECTIVES OF THE STUDY
    1.2 MARKET DEFINITION
    1.3 MARKET INCLUSIONS AND EXCLUSIONS
           1.3.1 MARKET INCLUSIONS
           1.3.2 MARKET EXCLUSIONS
    1.4 MARKET SCOPE
           FIGURE 1 BIOADHESIVES MARKET SEGMENTATION
    1.5 YEAR CONSIDERED FOR THE STUDY
    1.6 CURRENCY
    1.7 UNIT CONSIDERED
    1.8 STAKEHOLDERS
    1.9 SUMMARY OF CHANGES

2 RESEARCH METHODOLOGY (Page No. - 37)
    2.1 RESEARCH DATA
           FIGURE 2 BIOADHESIVES MARKET: RESEARCH DESIGN
           2.1.1 SECONDARY DATA
                    2.1.1.1 Key data from secondary sources
           2.1.2 PRIMARY DATA
                    2.1.2.1 Key primary data sources
                    2.1.2.2 Key data from primary sources
                    2.1.2.3 Key industry insights
                    2.1.2.4 Breakdown of primary interviews
    2.2 MARKET SIZE ESTIMATION
           2.2.1 TOP-DOWN APPROACH
           FIGURE 3 MARKET SIZE ESTIMATION: TOP-DOWN APPROACH
           FIGURE 4 MARKET SIZE ESTIMATION: BIOADHESIVES MARKET
           FIGURE 5 BIOADHESIVES MARKET, BY REGION
           FIGURE 6 BIOADHESIVES MARKET, BY APPLICATION
           2.2.2 BOTTOM-UP APPROACH
           FIGURE 7 MARKET SIZE ESTIMATION: BOTTOM-UP APPROACH
           FIGURE 8 MARKET SIZE ESTIMATION: BOTTOM-UP APPROACH, BY APPLICATION
           FIGURE 9 MARKET SIZE ESTIMATION: TOP-DOWN APPROACH, BY REGION
    2.3 MARKET FORECAST APPROACH
           2.3.1 DEMAND-SIDE FORECAST PROJECTION
    2.4 MARKET BREAKDOWN AND DATA TRIANGULATION
           FIGURE 10 BIOADHESIVES MARKET: DATA TRIANGULATION
    2.5 FACTOR ANALYSIS
    2.6 ASSUMPTIONS
    2.7 LIMITATIONS

3 EXECUTIVE SUMMARY (Page No. - 47)
           TABLE 1 BIOADHESIVES MARKET SNAPSHOT, 2020 VS. 2025
           FIGURE 11 PLANT-BASED ADHESIVES ACCOUNTED FOR LARGER SHARE IN THE OVERALL BIOADHESIVES MARKET
           FIGURE 12 BIOADHESIVES MARKET TO WITNESS HIGHEST GROWTH IN MEDICAL APPLICATION
           FIGURE 13 APAC TO BE FASTEST-GROWING BIOADHESIVES MARKET

4 PREMIUM INSIGHTS (Page No. - 50)
    4.1 ATTRACTIVE OPPORTUNITIES IN THE BIOADHESIVES MARKET
           FIGURE 14 BIOADHESIVES MARKET TO REGISTER HIGH GROWTH
    4.2 BIOADHESIVES MARKET, BY TYPE
           FIGURE 15 ANIMAL-BASED SEGMENT TO REGISTER HIGHER GROWTH DURING FORECAST PERIOD
    4.3 BIOADHESIVES MARKET, BY APPLICATION
           FIGURE 16 PAPER & PACKAGING TO BE LARGEST APPLICATION OF BIOADHESIVES
    4.4 BIOADHESIVES MARKET, DEVELOPED VS. DEVELOPING COUNTRIES
           FIGURE 17 DEVELOPING COUNTRIES TO GROW FASTER THAN DEVELOPED COUNTRIES
    4.5 APAC BIOADHESIVES MARKET, BY COUNTRY AND APPLICATION
           FIGURE 18 CHINA DOMINATES BIOADHESIVES MARKET IN APAC
    4.6 BIOADHESIVES MARKET: MAJOR COUNTRIES
           FIGURE 19 INDIA TO REGISTER HIGHEST CAGR IN THE BIOADHESIVES MARKET

5 MARKET OVERVIEW (Page No. - 53)
    5.1 INTRODUCTION
    5.2 VALUE CHAIN OVERVIEW
           5.2.1 VALUE CHAIN ANALYSIS
           FIGURE 20 BIOADHESIVES: VALUE CHAIN ANALYSIS
           TABLE 2 BIOADHESIVES MARKET: SUPPLY CHAIN
           5.2.2 COVID-19 IMPACT ON VALUE CHAIN
                    5.2.2.1 Action plan against current vulnerability
    5.3 MARKET DYNAMICS
           FIGURE 21 DRIVERS, RESTRAINTS, OPPORTUNITIES, AND CHALLENGES IN BIOADHESIVES MARKET
           5.3.1 DRIVERS
                    5.3.1.1 Increasing regulations & policies against use of petrochemical-based adhesives
                    5.3.1.2 Growth of biotechnology and innovations by industry players
                    5.3.1.3 Continuous fluctuation in prices of crude oil
           FIGURE 22 WEST TEXAS INTERMEDIATE (WTI) CRUDE OIL PRICES, 2010–2021 (USD/BARREL)
                    5.3.1.4 Increased demand for adhesives in medical industry
                    5.3.1.5 Switch from single-use to recyclable packaging
           5.3.2 RESTRAINTS
                    5.3.2.1 Competition from substitutes
           5.3.3 OPPORTUNITIES
                    5.3.3.1 Increasing demand for environmentally-friendly products
                    5.3.3.2 Stringent regulations to reduce VOC emissions
           5.3.4 CHALLENGES
                    5.3.4.1 Advanced technological know-how
    5.4 PORTER’S FIVE FORCES ANALYSIS
           FIGURE 23 BIOADHESIVES MARKET: PORTER’S FIVE FORCES ANALYSIS
           TABLE 3 BIOADHESIVES MARKET: PORTER’S FIVE FORCES ANALYSIS
           5.4.1 THREAT OF NEW ENTRANTS
           5.4.2 THREAT OF SUBSTITUTES
           5.4.3 BARGAINING POWER OF BUYERS
           5.4.4 BARGAINING POWER OF SUPPLIERS
           5.4.5 INTENSITY OF COMPETITIVE RIVALRY
    5.5 AVERAGE PRICE ANALYSIS
           FIGURE 24 AVERAGE PRICE COMPETITIVENESS IN BIOADHESIVES MARKET
    5.6 ADHESIVES ECOSYSTEM
           FIGURE 25 ADHESIVES ECOSYSTEM
           5.6.1 YC AND YCC SHIFT
           FIGURE 26 ADHESIVES INDUSTRY: YC AND YCC SHIFT
    5.7 REGULATORY & SAFETY REQUIREMENTS
           5.7.1 LEED STANDARDS
           TABLE 4 VOC LIMITS FOR ADHESIVES IN ARCHITECTURAL (CONSTRUCTION) APPLICATIONS
    5.8 MACROECONOMIC INDICATORS AND KEY INDUSTRY TRENDS
           5.8.1 INTRODUCTION
           5.8.2 TRENDS AND FORECAST OF GDP
           TABLE 5 TRENDS AND FORECAST OF GDP, PERCENTAGE CHANGE
           5.8.3 TRENDS AND FORECAST IN CONSTRUCTION SECTOR
           FIGURE 27 GLOBAL SPENDING IN BUILDING & CONSTRUCTION SECTOR, 2017–2025
           5.8.4 TRENDS IN HEALTHCARE SECTOR
           TABLE 6 EXPENDITURE ON HEALTH, IN USD (2015–2019)
    5.9 TECHNOLOGY ANALYSIS AND ADVANCEMENT PROMOTING MARKET MEGATRENDS
           5.9.1 EFFECTS OF FUTURE TRENDS AND TECHNOLOGY DISRUPTIONS IN ADHESIVES MARKET
                    5.9.1.1 Healthcare industry
                               5.9.1.1.1 Rising prominence of adhesive dentistry
                               5.9.1.1.2 Growing preference for gelatin-based adhesives and hydrogels in surgical procedures
                               5.9.1.1.3 Natural/biological adhesives & sealants
    5.10 BIOADHESIVES PATENT ANALYSIS
           5.10.1 METHODOLOGY
           5.10.2 PUBLICATION TRENDS
           FIGURE 28 PUBLICATION TRENDS, 2016–2020
           5.10.3 INSIGHT
           5.10.4 JURISDICTION ANALYSIS
           FIGURE 29 JURISDICTION ANALYSIS OF REGISTERED PATENTS, 2016–2020
           5.10.5 TOP APPLICANTS
           FIGURE 30 NUMBER OF PATENTS, BY COMPANY, 2016–2020
    5.11 TRADE DATA STATISTICS
           5.11.1 EXPORT-IMPORT: TRADE SCENARIO 2017-2019
           TABLE 7 COUNTRY-WISE EXPORT DATA, IN USD, 2017–2019
           TABLE 8 COUNTRY-WISE IMPORT DATA, IN USD, 2017–2019
    5.12 CASE STUDY
    5.13 COVID-19 IMPACT ANALYSIS
           5.13.1 COVID-19 ECONOMIC ASSESSMENT
           5.13.2 MAJOR ECONOMIC EFFECTS OF COVID-19
           5.13.3 EFFECTS ON GDP OF COUNTRIES
           FIGURE 31 GDP FORECASTS OF G20 COUNTRIES IN 2020
           5.13.4 SCENARIO ASSESSMENT
           FIGURE 32 FACTORS IMPACTING ECONOMY OF SELECT G20 COUNTRIES IN 2020

6 BIOADHESIVES MARKET, BY TYPE (Page No. - 83)
    6.1 INTRODUCTION
           FIGURE 33 PLANT-BASED BIOADHESIVES TO DOMINATE THE MARKET, 2020 VS 2025 (USD MILLION)
           TABLE 9 BIOADHESIVES MARKET SIZE, BY TYPE, 2016–2018 (KILOTON)
           TABLE 10 BIOADHESIVES MARKET SIZE, BY TYPE, 2019–2025 (KILOTON)
           TABLE 11 BIOADHESIVES MARKET SIZE, BY TYPE, 2016–2018 (USD MILLION)
           TABLE 12 BIOADHESIVES MARKET SIZE, BY TYPE, 2019–2025 (USD MILLION)
    6.2 PLANT-BASED
           6.2.1 SOYBEAN
                    6.2.1.1 Soy-based adhesives are low cost, readily available, and environmentally safe
           6.2.2 LIGNIN
                    6.2.2.1 Lignin mostly used as replacement for phenol in phenol-formaldehyde resins
           6.2.3 OTHERS
           TABLE 13 PLANT-BASED BIOADHESIVES MARKET SIZE, BY REGION, 2016–2018 (KILOTON)
           TABLE 14 PLANT-BASED BIOADHESIVES MARKET SIZE, BY REGION, 2019–2025 (KILOTON)
           TABLE 15 PLANT-BASED BIOADHESIVES MARKET SIZE, BY REGION, 2016–2018 (USD MILLION)
           TABLE 16 PLANT-BASED BIOADHESIVES MARKET SIZE, BY REGION, 2019–2025 (USD MILLION)
    6.3 ANIMAL-BASED
           6.3.1 COLLAGEN
                    6.3.1.1 Stringent government regulations to boost the demand for collagen-based adhesive
           6.3.2 FISH
                    6.3.2.1 Major applications of bioadhesives derived from fish include wood, furniture, paper, and packaging
           6.3.3 FIBRIN
                    6.3.3.1 Fibrin adhesives primarily used as a sealant and hemostatic agent
           6.3.4 BLOOD
                    6.3.4.1 Blood adhesive has good adhesion to leather, paper, cork, metals, and textiles
           6.3.5 CASEIN
                    6.3.5.1 Major application of casein adhesive is in beverage industry for labeling bottles
           6.3.6 OTHERS
           TABLE 17 ANIMAL-BASED BIOADHESIVES MARKET SIZE, BY REGION, 2016–2018 (KILOTON)
           TABLE 18 ANIMAL-BASED BIOADHESIVES MARKET SIZE, BY REGION, 2019–2025 (KILOTON)
           TABLE 19 ANIMAL-BASED BIOADHESIVES MARKET SIZE, BY REGION, 2016–2018 (USD MILLION)
           TABLE 20 ANIMAL-BASED BIOADHESIVES MARKET SIZE, BY REGION, 2019–2025 (USD MILLION)

7 BIOADHESIVES MARKET, BY APPLICATION (Page No. - 91)
    7.1 INTRODUCTION
           FIGURE 34 MEDICAL APPLICATION TO DOMINATE BIOADHESIVES MARKET, 2020 VS 2025 (USD MILLION)
           TABLE 21 BIOADHESIVES MARKET SIZE, BY APPLICATION, 2016–2018 (KILOTON)
           TABLE 22 BIOADHESIVES MARKET SIZE, BY APPLICATION, 2019–2025 (KILOTON)
           TABLE 23 BIOADHESIVES MARKET SIZE, BY APPLICATION, 2016–2018 (USD MILLION)
           TABLE 24 BIOADHESIVES MARKET SIZE, BY APPLICATION, 2019–2025 (USD MILLION)
           7.1.1 DISRUPTION DUE TO COVID-19
    7.2 PAPER & PACKAGING
           7.2.1 FOOD PACKAGING
                    7.2.1.1 Sustainability, bold design, and personalization shaping the future of food packaging
           7.2.2 CONSUMER GOODS PACKAGING
                    7.2.2.1 Increasing awareness about harmful effects of plastic packaging on environment fueling demand for sustainable products
           7.2.3 PHARMACEUTICAL PACKAGING
                    7.2.3.1 Introduction of innovative packaging and penetration of generic drugs increasing demand for pharmaceutical packaging
           TABLE 25 BIOADHESIVES MARKET SIZE IN PAPER & PACKAGING, BY REGION, 2016–2018 (KILOTON)
           TABLE 26 BIOADHESIVES MARKET SIZE IN PAPER & PACKAGING, BY REGION, 2019–2025 (KILOTON)
           TABLE 27 BIOADHESIVES MARKET SIZE IN PAPER & PACKAGING, BY REGION, 2016–2018 (USD MILLION)
           TABLE 28 BIOADHESIVES MARKET SIZE IN PAPER & PACKAGING, BY REGION, 2019–2025 (USD MILLION)
    7.3 CONSTRUCTION
           7.3.1 FLOORS
                    7.3.1.1 Bioadhesives replacing synthetic adhesives as they emit VOCs
           TABLE 29 BIOADHESIVES MARKET SIZE IN CONSTRUCTION, BY REGION, 2016–2018 (KILOTON)
           TABLE 30 BIOADHESIVES MARKET SIZE IN CONSTRUCTION, BY REGION, 2019–2025 (KILOTON)
           TABLE 31 BIOADHESIVES MARKET SIZE IN CONSTRUCTION, BY REGION, 2016–2018 (USD MILLION)
           TABLE 32 BIOADHESIVES MARKET SIZE IN CONSTRUCTION, BY REGION, 2019–2025 (USD MILLION)
    7.4 WOODWORKING
           7.4.1 FURNITURE
                    7.4.1.1 Changing consumer demographics, growing tourism & hospitality and real estate markets boosting the furniture market
           7.4.2 DOORS & WINDOWS
                    7.4.2.1 Increasing residential and commercial construction and remodeling trends expected to influence the demand
           7.4.3 JOINERY
                    7.4.3.1 Bioadhesives used to provide additional strength, protection, and increased service life to joints
           7.4.4 STRING INSTRUMENTS
                    7.4.4.1 Rise in music hobbyists expected to boost demand for string instruments and, in turn, boost demand for bioadhesives
           TABLE 33 BIOADHESIVES MARKET IN WOODWORKING, BY REGION, 2016–2018 (KILOTON)
           TABLE 34 BIOADHESIVES MARKET IN WOODWORKING, BY REGION, 2019–2025 (KILOTON)
           TABLE 35 BIOADHESIVES MARKET IN WOODWORKING, BY REGION, 2016–2018 (USD MILLION)
           TABLE 36 BIOADHESIVES MARKET IN WOODWORKING, BY REGION, 2019–2025 (USD MILLION)
    7.5 PERSONAL CARE
           7.5.1 SKINCARE
                    7.5.1.1 Bioadhesives used in skincare products as they do not contain harmful chemicals
           7.5.2 HAIR CARE
                    7.5.2.1 Increasing use of natural and organic hair care products fueling demand for bioadhesives
           7.5.3 COSMETICS
                    7.5.3.1 Increasing demand for safe products leading to popularity of bioadhesives in cosmetics
           TABLE 37 BIOADHESIVES MARKET SIZE IN PERSONAL CARE, BY REGION, 2016–2018 (KILOTON)
           TABLE 38 BIOADHESIVES MARKET SIZE IN PERSONAL CARE, BY REGION, 2019–2025 (KILOTON)
           TABLE 39 BIOADHESIVES MARKET SIZE IN PERSONAL CARE, BY REGION, 2016–2018 (USD MILLION)
           TABLE 40 BIOADHESIVES MARKET SIZE IN PERSONAL CARE, BY REGION, 2019–2025 (USD MILLION)
    7.6 MEDICAL
           7.6.1 INTERNAL
                    7.6.1.1 Bioadhesives used in applications where techniques such as suturing are ineffective or impractical
           7.6.2 EXTERNAL
                    7.6.2.1 External bioadhesives used to prevent fluid leakage from surgical wounds and incisions
           TABLE 41 BIOADHESIVES MARKET SIZE IN MEDICAL, BY REGION, 2016–2018 (KILOTON)
           TABLE 42 BIOADHESIVES MARKET SIZE IN MEDICAL, BY REGION, 2019–2025 (KILOTON)
           TABLE 43 BIOADHESIVES MARKET SIZE IN MEDICAL, BY REGION, 2016–2018 (USD MILLION)
           TABLE 44 BIOADHESIVES MARKET SIZE IN MEDICAL, BY REGION,2019–2025 (USD MILLION)
    7.7 OTHERS
           TABLE 45 BIOADHESIVES MARKET SIZE IN OTHER APPLICATIONS, BY REGION, 2016–2018 (KILOTON)
           TABLE 46 BIOADHESIVES MARKET SIZE IN OTHER APPLICATIONS, BY REGION, 2019–2025 (KILOTON)
           TABLE 47 BIOADHESIVES MARKET SIZE IN OTHER APPLICATIONS, BY REGION, 2016–2018 (USD MILLION)
           TABLE 48 BIOADHESIVES MARKET SIZE IN OTHER APPLICATIONS, BY REGION, 2019–2025 (USD MILLION)

8 BIOADHESIVES MARKET, BY REGION (Page No. - 108)
    8.1 INTRODUCTION
           FIGURE 35 APAC TO BE FASTEST-GROWING MARKET FOR BIOADHESIVES
           TABLE 49 BIOADHESIVES MARKET SIZE, BY REGION, 2016–2018 (KILOTON)
           TABLE 50 BIOADHESIVES MARKET SIZE, BY REGION, 2019–2025 (KILOTON)
           TABLE 51 BIOADHESIVES MARKET SIZE, BY REGION, 2016–2018 (USD MILLION)
           TABLE 52 BIOADHESIVES MARKET SIZE, BY REGION, 2019–2025 (USD MILLION)
    8.2 APAC
           FIGURE 36 APAC: BIOADHESIVES MARKET SNAPSHOT
           8.2.1 COVID-19 IMPACT ON APAC
           TABLE 53 APAC: BIOADHESIVES MARKET SIZE, BY TYPE, 2016–2018 (KILOTON)
           TABLE 54 APAC: BIOADHESIVES MARKET SIZE, BY TYPE, 2019–2025 (KILOTON)
           TABLE 55 APAC: BIOADHESIVES MARKET SIZE, BY TYPE, 2016–2018 (USD MILLION)
           TABLE 56 APAC: BIOADHESIVES MARKET SIZE, BY TYPE, 2019–2025 (USD MILLION)
           TABLE 57 APAC: BIOADHESIVES MARKET SIZE, BY APPLICATION, 2016–2018 (KILOTON)
           TABLE 58 APAC: BIOADHESIVES MARKET SIZE, BY APPLICATION, 2019–2025 (KILOTON)
           TABLE 59 APAC: BIOADHESIVES MARKET SIZE, BY APPLICATION, 2016–2018 (USD MILLION)
           TABLE 60 APAC: BIOADHESIVES MARKET SIZE, BY APPLICATION, 2019–2025 (USD MILLION)
           TABLE 61 APAC: BIOADHESIVES MARKET SIZE, BY COUNTRY, 2016–2018 (KILOTON)
           TABLE 62 APAC: BIOADHESIVES MARKET SIZE, BY COUNTRY, 2019–2025 (KILOTON)
           TABLE 63 APAC: BIOADHESIVES MARKET SIZE, BY COUNTRY, 2016–2018 (USD MILLION)
           TABLE 64 APAC: BIOADHESIVES MARKET SIZE, BY COUNTRY, 2019–2025 (USD MILLION)
           8.2.2 CHINA
                    8.2.2.1 Bioadhesives market in China witnessing significant growth owing to increased exports to North America, Europe
           TABLE 65 CHINA: BIOADHESIVES MARKET SIZE, BY APPLICATION, 2016–2018 (KILOTON)
           TABLE 66 CHINA: BIOADHESIVES MARKET SIZE, BY APPLICATION, 2019–2025 (KILOTON)
           TABLE 67 CHINA: BIOADHESIVES MARKET SIZE, BY APPLICATION, 2016–2018 (USD MILLION)
           TABLE 68 CHINA: BIOADHESIVES MARKET SIZE, BY APPLICATION, 2019–2025 (USD MILLION)
           8.2.3 INDIA
                    8.2.3.1 Growing population and income levels, coupled with changing regulatory policies, driving bioadhesives market
           TABLE 69 INDIA: BIOADHESIVES MARKET SIZE, BY APPLICATION, 2016–2018 (KILOTON)
           TABLE 70 INDIA: BIOADHESIVES MARKET SIZE, BY APPLICATION, 2019–2025 (KILOTON)
           TABLE 71 INDIA: BIOADHESIVES MARKET SIZE, BY APPLICATION, 2016–2018 (USD MILLION)
           TABLE 72 INDIA: BIOADHESIVES MARKET SIZE, BY APPLICATION, 2019–2025 (USD MILLION)
           8.2.4 JAPAN
                    8.2.4.1 Manufacturers significantly focusing on bio-based and biodegradable products
           TABLE 73 JAPAN: BIOADHESIVES MARKET SIZE, BY APPLICATION, 2016–2018 (KILOTON)
           TABLE 74 JAPAN: BIOADHESIVES MARKET SIZE, BY APPLICATION, 2019–2025 (KILOTON)
           TABLE 75 JAPAN: BIOADHESIVES MARKET SIZE, BY APPLICATION, 2016–2018 (USD MILLION)
           TABLE 76 JAPAN: BIOADHESIVES MARKET SIZE, BY APPLICATION, 2019–2025 (USD MILLION)
           8.2.5 SOUTH KOREA
                    8.2.5.1 Medical and pharmaceutical industries growing due to government support and favorable policies
           TABLE 77 SOUTH KOREA: BIOADHESIVES MARKET SIZE, BY APPLICATION, 2016–2018 (KILOTON)
           TABLE 78 SOUTH KOREA: BIOADHESIVES MARKET SIZE, BY APPLICATION, 2019–2025 (KILOTON)
           TABLE 79 SOUTH KOREA: BIOADHESIVES MARKET SIZE, BY APPLICATION, 2016–2018 (USD MILLION)
           TABLE 80 SOUTH KOREA: BIOADHESIVES MARKET SIZE, BY APPLICATION, 2019–2025 (USD MILLION)
           8.2.6 INDONESIA
                    8.2.6.1 Country’s health ministry encouraging synergy between medical industry and research institutions
           TABLE 81 INDONESIA: BIOADHESIVES MARKET SIZE, BY APPLICATION, 2016–2018 (KILOTON)
           TABLE 82 INDONESIA: BIOADHESIVES MARKET SIZE, BY APPLICATION, 2019–2025 (KILOTON)
           TABLE 83 INDONESIA: BIOADHESIVES MARKET SIZE, BY APPLICATION, 2016–2018 (USD MILLION)
           TABLE 84 INDONESIA: BIOADHESIVES MARKET SIZE, BY APPLICATION, 2019–2025 (USD MILLION)
           8.2.7 THAILAND
                    8.2.7.1 Increasing exports and public infrastructure plans contributing to improvement in Thailand’s economic outlook
           TABLE 85 THAILAND: BIOADHESIVES MARKET SIZE, BY APPLICATION, 2016–2018 (KILOTON)
           TABLE 86 THAILAND: BIOADHESIVES MARKET SIZE, BY APPLICATION, 2019–2025 (KILOTON)
           TABLE 87 THAILAND: BIOADHESIVES MARKET SIZE, BY APPLICATION, 2016–2018 (USD MILLION)
           TABLE 88 THAILAND: BIOADHESIVES MARKET SIZE, BY APPLICATION, 2019–2025 (USD MILLION)
           8.2.8 REST OF APAC
           TABLE 89 REST OF APAC: BIOADHESIVES MARKET SIZE, BY APPLICATION, 2016–2018 (KILOTON)
           TABLE 90 REST OF APAC: BIOADHESIVES MARKET SIZE, BY APPLICATION, 2019–2025 (KILOTON)
           TABLE 91 REST OF APAC: BIOADHESIVES MARKET SIZE, BY APPLICATION, 2016–2018 (USD MILLION)
           TABLE 92 REST OF APAC: BIOADHESIVES MARKET SIZE, BY APPLICATION, 2019–2025 (USD MILLION)
    8.3 NORTH AMERICA
           FIGURE 37 NORTH AMERICA: BIOADHESIVES MARKET SNAPSHOT
           8.3.1 COVID-19 IMPACT ON NORTH AMERICA
           TABLE 93 NORTH AMERICA: BIOADHESIVES MARKET SIZE, BY TYPE, 2016–2018 (KILOTON)
           TABLE 94 NORTH AMERICA: BIOADHESIVES MARKET SIZE, BY TYPE, 2019–2025 (KILOTON)
           TABLE 95 NORTH AMERICA: BIOADHESIVES MARKET SIZE, BY TYPE, 2016–2018 (USD MILLION)
           TABLE 96 NORTH AMERICA: BIOADHESIVES MARKET SIZE, BY TYPE, 2019–2025 (USD MILLION)
           TABLE 97 NORTH AMERICA: BIOADHESIVES MARKET SIZE, BY APPLICATION, 2016–2018 (KILOTON)
           TABLE 98 NORTH AMERICA: BIOADHESIVES MARKET SIZE, BY APPLICATION, 2019–2025 (KILOTON)
           TABLE 99 NORTH AMERICA: BIOADHESIVES MARKET SIZE, BY APPLICATION, 2016–2018 (USD MILLION)
           TABLE 100 NORTH AMERICA BIOADHESIVES MARKET SIZE, BY APPLICATION, 2019–2025 (USD MILLION)
           TABLE 101 NORTH AMERICA: BIOADHESIVES MARKET SIZE, BY COUNTRY, 2016–2018 (KILOTON)
           TABLE 102 NORTH AMERICA: BIOADHESIVES MARKET SIZE, BY COUNTRY, 2019–2025 (KILOTON)
           TABLE 103 NORTH AMERICA: BIOADHESIVES MARKET SIZE, BY COUNTRY, 2016–2018 (USD MILLION)
           TABLE 104 NORTH AMERICA: BIOADHESIVES MARKET SIZE, BY COUNTRY, 2019–2025 (USD MILLION)
           8.3.2 US
                    8.3.2.1 Strong presence of manufacturing facilities, strong economic sector, and increasing expenditure driving the market
           TABLE 105 US: BIOADHESIVES MARKET SIZE, BY APPLICATION, 2016–2018 (KILOTON)
           TABLE 106 US: BIOADHESIVES MARKET SIZE, BY APPLICATION, 2019–2025 (KILOTON)
           TABLE 107 US: BIOADHESIVES MARKET SIZE, BY APPLICATION, 2016–2018 (USD MILLION)
           TABLE 108 US: BIOADHESIVES MARKET SIZE, BY APPLICATION, 2019–2025 (USD MILLION)
           8.3.3 CANADA
                    8.3.3.1 Regulatory bodies regulate bio-based formulations in product manufacturing, which supports growth of bio-based products
           TABLE 109 CANADA: BIOADHESIVES MARKET SIZE, BY APPLICATION, 2016–2018 (KILOTON)
           TABLE 110 CANADA: BIOADHESIVES MARKET SIZE, BY APPLICATION, 2019–2025 (KILOTON)
           TABLE 111 CANADA: BIOADHESIVES MARKET SIZE, BY APPLICATION, 2016–2018 (USD MILLION)
           TABLE 112 CANADA: BIOADHESIVES MARKET SIZE, BY APPLICATION, 2019–2025 (USD MILLION)
           8.3.4 MEXICO
                    8.3.4.1 Bioadhesives market developing as global chemical companies set up manufacturing plants in Mexico
           TABLE 113 MEXICO: BIOADHESIVES MARKET SIZE, BY APPLICATION, 2016–2018 (KILOTON)
           TABLE 114 MEXICO: BIOADHESIVES MARKET SIZE, BY APPLICATION, 2019–2025 (KILOTON)
           TABLE 115 MEXICO: BIOADHESIVES MARKET SIZE, BY APPLICATION, 2016–2018 (USD MILLION)
           TABLE 116 MEXICO: BIOADHESIVES MARKET SIZE, BY APPLICATION, 2019–2025 (USD MILLION)
    8.4 EUROPE
           FIGURE 38 EUROPE: BIOADHESIVES MARKET SNAPSHOT
           8.4.1 COVID-19 IMPACT ON EUROPE
           TABLE 117 EUROPE: BIOADHESIVES MARKET SIZE, BY TYPE, 2016–2018 (KILOTON)
           TABLE 118 EUROPE: BIOADHESIVES MARKET SIZE, BY TYPE, 2019–2025 (KILOTON)
           TABLE 119 EUROPE: BIOADHESIVES MARKET SIZE, BY TYPE, 2016–2018 (USD MILLION)
           TABLE 120 EUROPE: BIOADHESIVES MARKET SIZE, BY TYPE, 2019–2025 (USD MILLION)
           TABLE 121 EUROPE: BIOADHESIVES MARKET SIZE, BY APPLICATION, 2016–2018 (KILOTON)
           TABLE 122 EUROPE: BIOADHESIVES MARKET SIZE, BY APPLICATION, 2019–2025 (KILOTON)
           TABLE 123 EUROPE: BIOADHESIVES MARKET SIZE, BY APPLICATION, 2016–2018 (USD MILLION)
           TABLE 124 EUROPE: BIOADHESIVES MARKET SIZE, BY APPLICATION, 2019–2025 (USD MILLION)
           TABLE 125 EUROPE: BIOADHESIVES MARKET SIZE, BY COUNTRY, 2016–2018 (KILOTON)
           TABLE 126 EUROPE: BIOADHESIVES MARKET SIZE, BY COUNTRY, 2019–2025 (KILOTON)
           TABLE 127 EUROPE: BIOADHESIVES MARKET SIZE, BY COUNTRY, 2016–2018 (USD MILLION)
           TABLE 128 EUROPE: BIOADHESIVES MARKET SIZE, BY COUNTRY, 2019–2025 (USD MILLION)
           8.4.2 GERMANY
                    8.4.2.1 Demand for environmentally-friendly products high in Germany due to environmental policies
           TABLE 129 GERMANY: BIOADHESIVES MARKET SIZE, BY APPLICATION, 2016–2018 (KILOTON)
           TABLE 130 GERMANY: BIOADHESIVES MARKET SIZE, BY APPLICATION, 2019–2025 (KILOTON)
           TABLE 131 GERMANY: BIOADHESIVES MARKET SIZE, BY APPLICATION, 2016–2018 (USD MILLION)
           TABLE 132 GERMANY: BIOADHESIVES MARKET SIZE, BY APPLICATION, 2019–2025 (USD MILLION)
           8.4.3 UK
                    8.4.3.1 Economic growth, increased consumer spending, and consumer preference for sustainable products driving the demand
           TABLE 133 UK: BIOADHESIVES MARKET SIZE, BY APPLICATION, 2016–2018 (KILOTON)
           TABLE 134 UK: BIOADHESIVES MARKET SIZE, BY APPLICATION, 2019–2025 (KILOTON)
           TABLE 135 UK: BIOADHESIVES MARKET SIZE, BY APPLICATION, 2016–2018 (USD MILLION)
           TABLE 136 UK: BIOADHESIVES MARKET SIZE, BY APPLICATION, 2019–2025 (USD MILLION)
           8.4.4 FRANCE
                    8.4.4.1 France is a global leader in railway, automotive, aerospace, luxury goods, and cosmetic industries
           TABLE 137 FRANCE: BIOADHESIVES MARKET SIZE, BY APPLICATION, 2016–2018 (KILOTON)
           TABLE 138 FRANCE: BIOADHESIVES MARKET SIZE, BY APPLICATION, 2019–2025 (KILOTON)
           TABLE 139 FRANCE: BIOADHESIVES MARKET SIZE, BY APPLICATION, 2016–2018 (USD MILLION)
           TABLE 140 FRANCE: BIOADHESIVES MARKET SIZE, BY APPLICATION, 2019–2025 (USD MILLION)
           8.4.5 RUSSIA
                    8.4.5.1 Medical and pharmaceutical industries flourishing in Russia owing to favorable government policies
           TABLE 141 RUSSIA: BIOADHESIVES MARKET SIZE, BY APPLICATION, 2016–2018 (KILOTON)
           TABLE 142 RUSSIA: BIOADHESIVES MARKET SIZE, BY APPLICATION, 2019–2025 (KILOTON)
           TABLE 143 RUSSIA: BIOADHESIVES MARKET SIZE, BY APPLICATION, 2016–2018 (USD MILLION)
           TABLE 144 RUSSIA: BIOADHESIVES MARKET SIZE, BY APPLICATION, 2019–2025 (USD MILLION)
           8.4.6 ITALY
                    8.4.6.1 Debt crisis could pose threat to country’s economy and bioadhesives market
           TABLE 145 ITALY: BIOADHESIVES MARKET SIZE, BY APPLICATION, 2016–2018 (KILOTON)
           TABLE 146 ITALY: BIOADHESIVES MARKET SIZE, BY APPLICATION, 2019–2025 (KILOTON)
           TABLE 147 ITALY: BIOADHESIVES MARKET SIZE, BY APPLICATION, 2016–2018 (USD MILLION)
           TABLE 148 ITALY: BIOADHESIVES MARKET SIZE, BY APPLICATION, 2019–2025 (USD MILLION)
           8.4.7 TURKEY
                    8.4.7.1 Bioadhesives market in Turkey dominated by a few large and regional players
           TABLE 149 TURKEY: BIOADHESIVES MARKET SIZE, BY APPLICATION, 2016–2018 (KILOTON)
           TABLE 150 TURKEY: BIOADHESIVES MARKET SIZE, BY APPLICATION, 2019–2025 (KILOTON)
           TABLE 151 TURKEY: BIOADHESIVES MARKET SIZE, BY APPLICATION, 2016–2018 (USD MILLION)
           TABLE 152 TURKEY: BIOADHESIVES MARKET SIZE, BY APPLICATION, 2019–2025 (USD MILLION)
           8.4.8 REST OF EUROPE
           TABLE 153 REST OF EUROPE: BIOADHESIVES MARKET SIZE, BY APPLICATION, 2016–2018 (KILOTON)
           TABLE 154 REST OF EUROPE: BIOADHESIVES MARKET SIZE, BY APPLICATION, 2019–2025 (KILOTON)
           TABLE 155 REST OF EUROPE: BIOADHESIVES MARKET SIZE, BY APPLICATION, 2016–2018 (USD MILLION)
           TABLE 156 REST OF EUROPE: BIOADHESIVES MARKET SIZE, BY APPLICATION, 2019–2025 (USD MILLION)
    8.5 SOUTH AMERICA
           FIGURE 39 SOUTH AMERICA: BRAZIL TO BE LARGEST BIOADHESIVES MARKET
           8.5.1 COVID-19 IMPACT ON SOUTH AMERICA
           TABLE 157 SOUTH AMERICA: BIOADHESIVES MARKET SIZE, BY TYPE, 2016–2018 (KILOTON)
           TABLE 158 SOUTH AMERICA: BIOADHESIVES MARKET SIZE, BY TYPE, 2019–2025 (KILOTON)
           TABLE 159 SOUTH AMERICA: BIOADHESIVES MARKET SIZE, BY TYPE, 2016–2018 (USD MILLION)
           TABLE 160 SOUTH AMERICA: BIOADHESIVES MARKET SIZE, BY TYPE, 2019–2025 (USD MILLION)
           TABLE 161 SOUTH AMERICA: BIOADHESIVES MARKET SIZE, BY APPLICATION, 2016–2018 (KILOTON)
           TABLE 162 SOUTH AMERICA: BIOADHESIVES MARKET SIZE, BY APPLICATION, 2019–2025 (KILOTON)
           TABLE 163 SOUTH AMERICA: BIOADHESIVES MARKET SIZE, BY APPLICATION, 2016–2018 (USD MILLION)
           TABLE 164 SOUTH AMERICA: BIOADHESIVES MARKET SIZE, BY APPLICATION, 2019–2025 (USD MILLION)
           TABLE 165 SOUTH AMERICA: BIOADHESIVES MARKET SIZE, BY COUNTRY, 2016–2018 (KILOTON)
           TABLE 166 SOUTH AMERICA: BIOADHESIVES MARKET SIZE, BY COUNTRY, 2019–2025 (KILOTON)
           TABLE 167 SOUTH AMERICA: BIOADHESIVES MARKET SIZE, BY COUNTRY, 2016–2018 (USD MILLION)
           TABLE 168 SOUTH AMERICA: BIOADHESIVES MARKET SIZE, BY COUNTRY, 2019–2025 (USD MILLION)
           8.5.2 BRAZIL
                    8.5.2.1 The country is one of fastest-growing manufacturing hubs in the world
           TABLE 169 BRAZIL: BIOADHESIVES MARKET SIZE, BY APPLICATION, 2016–2018 (KILOTON)
           TABLE 170 BRAZIL: BIOADHESIVES MARKET SIZE, BY APPLICATION, 2019–2025 (KILOTON)
           TABLE 171 BRAZIL: BIOADHESIVES MARKET SIZE, BY APPLICATION, 2016–2018 (USD MILLION)
           TABLE 172 BRAZIL: BIOADHESIVES MARKET SIZE, BY APPLICATION, 2019–2025 (USD MILLION)
           8.5.3 ARGENTINA
                    8.5.3.1 Demand for adhesives expected to grow owing to growing population and improving economic conditions
           TABLE 173 ARGENTINA: BIOADHESIVES MARKET SIZE, BY APPLICATION, 2016–2018 (KILOTON)
           TABLE 174 ARGENTINA: BIOADHESIVES MARKET SIZE, BY APPLICATION, 2019–2025 (KILOTON)
           TABLE 175 ARGENTINA: BIOADHESIVES MARKET SIZE, BY APPLICATION, 2016–2018 (USD MILLION)
           TABLE 176 ARGENTINA: BIOADHESIVES MARKET SIZE, BY APPLICATION, 2019–2025 (USD MILLION)
           8.5.4 REST OF SOUTH AMERICA
           TABLE 177 REST OF SOUTH AMERICA: BIOADHESIVES MARKET SIZE, BY APPLICATION, 2016–2018 (KILOTON)
           TABLE 178 REST OF SOUTH AMERICA: BIOADHESIVES MARKET SIZE, BY APPLICATION, 2019–2025 (KILOTON)
           TABLE 179 REST OF SOUTH AMERICA: BIOADHESIVES MARKET SIZE, BY APPLICATION, 2016–2018 (USD MILLION)
           TABLE 180 REST OF SOUTH AMERICA: BIOADHESIVES MARKET SIZE, BY APPLICATION, 2019–2025 (USD MILLION)
    8.6 MIDDLE EAST & AFRICA
           FIGURE 40 MIDDLE EAST & AFRICA: SAUDI ARABIA TO BE LARGEST BIOADHESIVES MARKET
           8.6.1 COVID-19 IMPACT ON MIDDLE EAST & AFRICA
           TABLE 181 MIDDLE EAST & AFRICA: BIOADHESIVES MARKET SIZE, BY TYPE, 2016–2018 (KILOTON)
           TABLE 182 MIDDLE EAST & AFRICA: BIOADHESIVES MARKET SIZE, BY TYPE, 2019–2025 (KILOTON)
           TABLE 183 MIDDLE EAST & AFRICA: BIOADHESIVES MARKET SIZE, BY TYPE, 2016–2018 (USD MILLION)
           TABLE 184 MIDDLE EAST & AFRICA: BIOADHESIVES MARKET SIZE, BY TYPE, 2019–2025 (USD MILLION)
           TABLE 185 MIDDLE EAST & AFRICA: BIOADHESIVES MARKET SIZE, BY APPLICATION, 2016–2018 (KILOTON)
           TABLE 186 MIDDLE EAST & AFRICA: BIOADHESIVES MARKET SIZE, BY APPLICATION, 2019–2025 (KILOTON)
           TABLE 187 MIDDLE EAST & AFRICA: BIOADHESIVES MARKET SIZE, BY APPLICATION, 2016–2018 (USD MILLION)
           TABLE 188 MIDDLE EAST & AFRICA: BIOADHESIVES MARKET SIZE, BY APPLICATION, 2019–2025 (USD MILLION)
           TABLE 189 MIDDLE EAST & AFRICA: BIOADHESIVES MARKET SIZE, BY COUNTRY, 2016–2018 (KILOTON)
           TABLE 190 MIDDLE EAST & AFRICA: BIOADHESIVES MARKET SIZE, BY COUNTRY, 2019–2025 (KILOTON)
           TABLE 191 MIDDLE EAST & AFRICA: BIOADHESIVES MARKET SIZE, BY COUNTRY, 2016–2018 (USD MILLION)
           TABLE 192 MIDDLE EAST & AFRICA: BIOADHESIVES MARKET SIZE, BY COUNTRY, 2019–2025 (USD MILLION)
           8.6.2 SAUDI ARABIA
                    8.6.2.1 Saudi Arabia is largest and fastest-growing market for bioadhesives in Middle East & Africa
           TABLE 193 SAUDI ARABIA: BIOADHESIVES MARKET SIZE, BY APPLICATION, 2016–2018 (KILOTON)
           TABLE 194 SAUDI ARABIA: BIOADHESIVES MARKET SIZE, BY APPLICATION, 2019–2025 (KILOTON)
           TABLE 195 SAUDI ARABIA: BIOADHESIVES MARKET SIZE, BY APPLICATION, 2016–2018 (USD MILLION)
           TABLE 196 SAUDI ARABIA: BIOADHESIVES MARKET SIZE, BY APPLICATION, 2019–2025 (USD MILLION)
           8.6.3 UAE
                    8.6.3.1 Paper & packaging is largest application of bioadhesives in UAE in terms of volume
           TABLE 197 UAE: BIOADHESIVES MARKET SIZE, BY APPLICATION, 2016–2018 (KILOTON)
           TABLE 198 UAE: BIOADHESIVES MARKET SIZE, BY APPLICATION, 2019–2025 (KILOTON)
           TABLE 199 UAE: BIOADHESIVES MARKET SIZE, BY APPLICATION, 2016–2018 (USD MILLION)
           TABLE 200 UAE: BIOADHESIVES MARKET SIZE, BY APPLICATION, 2019–2025 (USD MILLION)
           8.6.4 QATAR
                    8.6.4.1 Medical sector is fastest-growing application of bioadhesives in Qatar
           TABLE 201 QATAR: BIOADHESIVES MARKET SIZE, BY APPLICATION, 2016–2018 (KILOTON)
           TABLE 202 QATAR: BIOADHESIVES MARKET SIZE, BY APPLICATION, 2019–2025 (KILOTON)
           TABLE 203 QATAR: BIOADHESIVES MARKET SIZE, BY APPLICATION, 2016–2018 (USD MILLION)
           TABLE 204 QATAR: BIOADHESIVES MARKET SIZE, BY APPLICATION, 2019–2025 (USD MILLION)
           8.6.5 SOUTH AFRICA
                    8.6.5.1 Paper & packaging is largest consumer of bioadhesives in South Africa
           TABLE 205 SOUTH AFRICA: BIOADHESIVES MARKET SIZE, BY APPLICATION, 2016–2018 (KILOTON)
           TABLE 206 SOUTH AFRICA: BIOADHESIVES MARKET SIZE, BY APPLICATION, 2019–2025 (KILOTON)
           TABLE 207 SOUTH AFRICA: BIOADHESIVES MARKET SIZE, BY APPLICATION, 2016–2018 (USD MILLION)
           TABLE 208 SOUTH AFRICA: BIOADHESIVES MARKET SIZE, BY APPLICATION, 2019–2025 (USD MILLION)
           8.6.6 REST OF MIDDLE EAST & AFRICA
           TABLE 209 REST OF MIDDLE EAST & AFRICA: BIOADHESIVES MARKET SIZE, BY APPLICATION, 2016–2018 (KILOTON)
           TABLE 210 REST OF MIDDLE EAST & AFRICA: BIOADHESIVES MARKET SIZE, BY APPLICATION, 2019–2025 (KILOTON)
           TABLE 211 REST OF MIDDLE EAST & AFRICA: BIOADHESIVES MARKET SIZE, BY APPLICATION, 2016–2018 (USD MILLION)
           TABLE 212 REST OF MIDDLE EAST & AFRICA: BIOADHESIVES MARKET SIZE, BY APPLICATION, 2019–2025 (USD MILLION)

9 COMPETITIVE LANDSCAPE (Page No. - 182)
    9.1 OVERVIEW
           FIGURE 41 INVESTMENT & EXPANSION IS MOST FOLLOWED STRATEGY BY LEADING PLAYERS BETWEEN 2017 AND 2020
    9.2 MARKET SHARE ANALYSIS
           TABLE 213 BIOADHESIVES MARKET: DEGREE OF COMPETITION
           FIGURE 42 KEY MARKET PLAYERS IN 2019
    9.3 COMPANY REVENUE ANALYSIS
           FIGURE 43 BIOADHESIVES MARKET: COMPANY REVENUE ANALYSIS, 2019
    9.4 COMPANY EVALUATION QUADRANT MATRIX, 2019
           9.4.1 STAR
           9.4.2 EMERGING LEADERS
           9.4.3 PERVASIVE
           9.4.4 PARTICIPANTS
           FIGURE 44 BIOADHESIVES MARKET (GLOBAL): COMPETITIVE LEADERSHIP MAPPING, 2019
    9.5 SME MATRIX, 2019
           9.5.1 PROGRESSIVE COMPANIES
           9.5.2 DYNAMIC COMPANIES
           9.5.3 STARTING BLOCKS
           9.5.4 RESPONSIVE COMPANIES
           FIGURE 45 BIOADHESIVES MARKET: EMERGING COMPANIES COMPETITIVE LEADERSHIP MAPPING, 2019
    9.6 STRENGTH OF PRODUCT PORTFOLIO
           FIGURE 46 PRODUCT PORTFOLIO ANALYSIS OF TOP PLAYERS IN BIOADHESIVES MARKET
    9.7 BUSINESS STRATEGY EXCELLENCE
           FIGURE 47 BUSINESS STRATEGY EXCELLENCE OF TOP PLAYERS IN BIOADHESIVES MARKET
    9.8 COMPETITIVE SCENARIO
           9.8.1 MARKET EVALUATION FRAMEWORK
           9.8.2 MARKET EVALUATION MATRIX
           TABLE 214 COMPANY PRODUCT FOOTPRINT
           TABLE 215 COMPANY REGION FOOTPRINT
           TABLE 216 COMPANY INDUSTRY FOOTPRINT
    9.9 STRATEGIC DEVELOPMENTS
           9.9.1 MERGER & ACQUISITION
           TABLE 217 MERGERS & ACQUISITIONS, 2017–2020
           9.9.2 INVESTMENT & EXPANSION
           TABLE 218 INVESTMENTS & EXPANSIONS, 2017–2020

10 COMPANY PROFILES (Page No. - 195)
     10.1 KEY PLAYERS
(Business Overview, Products Offered, Recent Developments, SWOT Analysis, Winning imperatives, Current focus and strategies, Threat from competition, right to win)* 
             10.1.1 HENKEL AG & COMPANY, KGAA
           FIGURE 48 HENKEL AG & COMPANY, KGAA: COMPANY SNAPSHOT
           FIGURE 49 HENKEL AG & COMPANY, KGAA: SWOT ANALYSIS
             10.1.2 DUPONT DE NEMOURS, INC.
           FIGURE 50 DUPONT DE NEMOURS, INC.: COMPANY SNAPSHOT
           FIGURE 51 DUPONT DE NEMOURS, INC.: SWOT ANALYSIS
           FIGURE 52 WINNING IMPERATIVES: DUPONT
             10.1.3 ARKEMA (BOSTIK SA)
           FIGURE 53 ARKEMA (BOSTIK SA): COMPANY SNAPSHOT
           FIGURE 54 ARKEMA (BOSTIK SA): SWOT ANALYSIS
             10.1.4 ASHLAND GLOBAL HOLDINGS INC.
           FIGURE 55 ASHLAND GLOBAL HOLDINGS INC.: COMPANY SNAPSHOT
           FIGURE 56 ASHLAND GLOBAL HOLDINGS INC.: SWOT ANALYSIS
             10.1.5 BEARDOW ADAMS GROUP
             10.1.6 PARAMELT BV
             10.1.7 JOWAT SE
             10.1.8 INGREDION INCORPORATED
           FIGURE 57 INGREDION INCORPORATED: COMPANY SNAPSHOT
             10.1.9 ECOSYNTHETIX INC.
           FIGURE 58 ECOSYNTHETIX INC.: COMPANY SNAPSHOT
             10.1.10 TATE & LYLE
           FIGURE 59 TATE & LYLE: COMPANY SNAPSHOT
     10.2 OTHER PLAYERS
             10.2.1 DANIMER SCIENTIFIC LLC
             10.2.2 THE COMPOUND COMPANY (YPAREX)
             10.2.3 CRYOLIFE INC.
             10.2.4 KOLLODIS BIOSCIENCES, INC.
             10.2.5 L.D. DAVIS INDUSTRIES, INC.
             10.2.6 WEISS CHEMIE + TECHNIK GMBH & CO. KG
             10.2.7 PREMIER STARCH PRODUCTS PVT. LTD.
             10.2.8 AVEBE U.A.
             10.2.9 WISDOM ADHESIVES WORLDWIDE
             10.2.10 U.S. ADHESIVES INC.
             10.2.11 C.B. ADHESIVES LTD.
*Details on Business Overview, Products Offered, Recent Developments, SWOT Analysis, Winning imperatives, Current focus and strategies, Threat from competition, right to win might not be captured in case of unlisted companies. 

11 ADJACENT/RELATED MARKETS (Page No. - 220)
     11.1 INTRODUCTION
     11.2 LIMITATION
     11.3 ADHESIVES & SEALANTS
             11.3.1 MARKET DEFINITION
             11.3.2 MARKET OVERVIEW
             11.3.3 ADHESIVES MARKET, BY FORMULATING TECHNOLOGY
           TABLE 219 ADHESIVES MARKET SIZE, BY FORMULATING TECHNOLOGY, 2016–2019 (USD MILLION)
           TABLE 220 ADHESIVES MARKET SIZE, BY FORMULATING TECHNOLOGY, 2020–2025 (USD MILLION)
           TABLE 221 ADHESIVES MARKET SIZE, BY FORMULATING TECHNOLOGY, 2016–2019 (KILOTON)
           TABLE 222 ADHESIVES MARKET SIZE, BY FORMULATING TECHNOLOGY, 2020–2025 (KILOTON)
                        11.3.3.1 Water-based
                        11.3.3.2 Solvent-based
                        11.3.3.3 Hot-melt
                        11.3.3.4 Reactive & others
             11.3.4 ADHESIVES MARKET, BY APPLICATION
           TABLE 223 ADHESIVES MARKET SIZE, BY APPLICATION, 2016–2019 (USD MILLION)
           TABLE 224 ADHESIVES MARKET SIZE, BY APPLICATION, 2020–2025 (USD MILLION)
           TABLE 225 ADHESIVES MARKET SIZE, BY APPLICATION, 2016–2019 (KILOTON)
           TABLE 226 ADHESIVES MARKET SIZE, BY APPLICATION, 2020–2025 (KILOTON)
                        11.3.4.1 Paper & Packaging
                        11.3.4.2 Building & construction
                        11.3.4.3 Woodworking
                        11.3.4.4 Automotive & transportation
                        11.3.4.5 Consumer & DIY
                        11.3.4.6 Leather & footwear
                        11.3.4.7 Assembly
                        11.3.4.8 Electronics
                        11.3.4.9 Medical
                        11.3.4.10 Others
             11.3.5 ADHESIVES & SEALANTS MARKET, BY REGION
           TABLE 227 ADHESIVES MARKET SIZE, BY REGION, 2016–2019 (USD MILLION)
           TABLE 228 ADHESIVES MARKET SIZE, BY REGION, 2020–2025 (USD MILLION)
           TABLE 229 ADHESIVES MARKET SIZE, BY REGION, 2016–2019 (KILOTON)
           TABLE 230 ADHESIVES MARKET SIZE, BY REGION, 2020–2025 (KILOTON)
                        11.3.5.1 Asia Pacific
                        11.3.5.2 North America
                        11.3.5.3 Europe
                        11.3.5.4 South America
                        11.3.5.5 Middle East & Africa

12 APPENDIX (Page No. - 231)
     12.1 DISCUSSION GUIDE
     12.2 KNOWLEDGE STORE: MARKETSANDMARKETS SUBSCRIPTION PORTAL
     12.3 AVAILABLE CUSTOMIZATIONS
     12.4 RELATED REPORTS
     12.5 AUTHOR DETAILS


The study involved four major activities in estimating the current market size of bioadhesives. Exhaustive secondary research was done to collect information on the market, the peer market, and the parent market. The next step was to validate these findings, assumptions, and sizing with industry experts across the value chain through primary research. Both top-down and bottom-up approaches were employed to estimate the complete market size. After that, the market breakdown and data triangulation methods were used to estimate the size of the segments and subsegments of the overall market.

Secondary Research

In the secondary research process, sources, such as annual reports, press releases, and investor presentations of companies; white papers; publications from recognized websites; and databases, have been referred to for identifying and collecting information. Secondary research has been used to obtain critical information about the supply chain of the industry, the total pool of key players, market classification, and segmentation according to industry trends to the bottom-most level, regional markets, and key developments from both market- and technology-oriented perspectives.

Primary Research

After the complete market estimation process (which includes calculations for market statistics, market breakdown, market size estimations, market forecast, and data triangulation), extensive primary research has been conducted to gather information and to verify and validate the critical numbers arrived at. Primary research has also been conducted to identify segmentation, industry trends, Porter’s Five Forces analysis, key players, competitive landscape, strategies of key players, and key market dynamics such as drivers, restraints, opportunities, and challenges.

In the primary research process, different primary sources from the supply and demand sides have been interviewed to obtain qualitative and quantitative information. The primary sources include industry experts, such as CEOs, vice presidents, marketing directors, technology & innovation directors, and related key executives from various companies and organizations operating in the bioadhesives market.

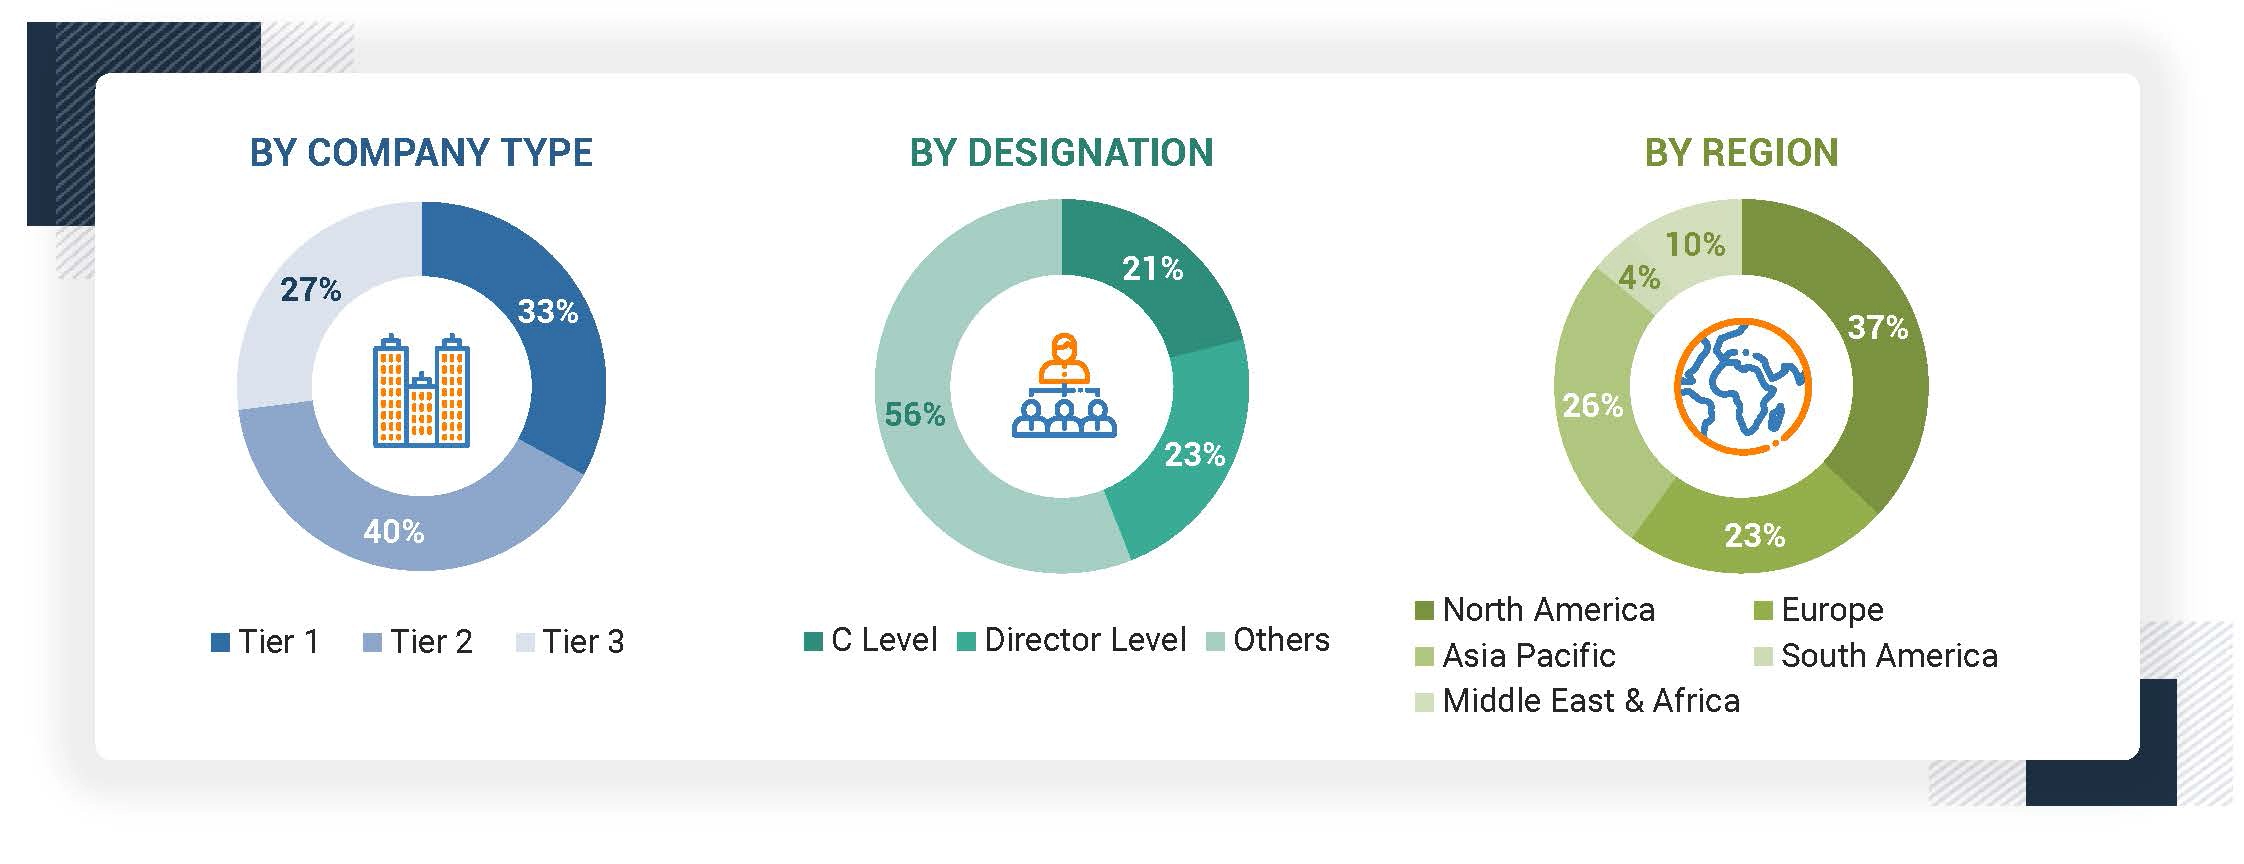
Following is the breakdown of primary respondents:

Bioadhesives Market  Size, and Share

To know about the assumptions considered for the study, download the pdf brochure

Market Size Estimation

Both top-down and bottom-up approaches have been used to estimate and validate the market size of bioadhesives for various applications in each region. The research methodology used to estimate the market size includes the following steps:

  • All percentage shares, splits, and breakdowns have been determined using secondary sources and verified through primary sources.
  • All possible parameters that affect the submarkets covered in this research study have been accounted for, viewed in extensive detail, verified through primary research, and analyzed to get the final quantitative and qualitative data. This data has been consolidated and added with detailed inputs and analysis from MarketsandMarkets and presented in this report.

Data Triangulation

After arriving at the overall market size from the estimation process explained above, the total market has been split into several segments and sub-segments. The data triangulation and market breakdown procedures have been used, wherever applicable, to complete the overall market engineering process and arrive at the exact statistics for all segments and sub-segments. The data has been triangulated by studying various factors and trends from the demand and supply sides. In addition, the market has been validated using the top-down and bottom-up approaches. Then, it has been verified through primary interviews. Hence, for every data, there are three sources — the top-down approach, the bottom-up approach, and expert interviews. Only when the values arrived at from the three points matched, the data has been assumed to be correct.

Report Objectives

  • To analyze and forecast the bioadhesives market size, in terms of value and volume
  • To provide detailed information about the key factors (drivers, restraints, opportunities, and challenges) influencing the market growth
  • To define, describe, and forecast the market by type and application
  • To forecast the market size with respect to five main regions, namely, North America, Europe, Asia Pacific (APAC), the Middle East & Africa, and South America
  • To strategically analyze the micromarkets with respect to individual growth trends, growth prospects, and their contribution to the overall market
  • To analyze the opportunities in the market for stakeholders and provide a competitive landscape for market leaders
  • To analyze competitive developments, such as investment & expansion and merger & acquisition, in the market
  • To strategically profile the key players and comprehensively analyze their market shares and core competencies

Available Customizations

MarketsandMarkets offers customizations according to the specific needs of the companies with the given market data.

The following customization options are available for the report:

Product Analysis

  • Product matrix that gives a detailed comparison of product portfolio of each company.

Regional Analysis

  • Further breakdown of a region with respect to a particular country

Company Information

  • Detailed analysis and profiling of additional market players
Custom Market Research Services

We will customize the research for you, in case the report listed above does not meet with your exact requirements. Our custom research will comprehensively cover the business information you require to help you arrive at strategic and profitable business decisions.

Request Customization

Instant Answers with GPT - Ask Now!

Ask real questions. Get complete answers !
Report Code
CH 3015
Published ON
Mar, 2021
Choose License Type
BUY NOW
  • SHARE
X
Request Customization
Speak to Analyst
Speak to Analyst
OR FACE-TO-FACE MEETING
PERSONALIZE THIS RESEARCH
  • Triangulate with your Own Data
  • Get Data as per your Format and Definition
  • Gain a Deeper Dive on a Specific Application, Geography, Customer or Competitor
  • Any level of Personalization
REQUEST A FREE CUSTOMIZATION
LET US HELP YOU!
  • What are the Known and Unknown Adjacencies Impacting the Bioadhesives Market
  • What will your New Revenue Sources be?
  • Who will be your Top Customer; what will make them switch?
  • Defend your Market Share or Win Competitors
  • Get a Scorecard for Target Partners
CUSTOMIZED WORKSHOP REQUEST
+1-888-600-6441
  • Call Us
  • +1-888-600-6441 (Corporate office hours)
  • +1-888-600-6441 (US/Can toll free)
  • +44-800-368-9399 (UK office hours)
CONNECT WITH US
ABOUT TRUST ONLINE
©2024 MarketsandMarkets Research Private Ltd. All rights reserved
DMCA.com Protection Status Website Feedback