Biofuel Market by Fuel Type (Ethanol, Biodiesel, Renewable Diesel, Biojet), Generation (First Generation, Second Generation, Third Generation), End-use (Transportation, Aviation), Region (North America, Europe, Asia Pacific) - Global Forecast to 2028
The global biofuel market size was valued at USD 167.4 Billion in 2023 to USD 225.9 Billion by 2028; it is expected to record a CAGR of 6.2% during the forecast period. The growing challenges on energy security and the need to mitigate greenhouse gas emissions are some of the major drivers for the growth of the biofuel market. Fuels derived from renewable sources act as a means of addressing the challenges while also providing a potential low-cost alternative to expensive fossil fuels. Domestic production of biofuels from renewable sources can reduce reliance on oil imports and improve energy security.
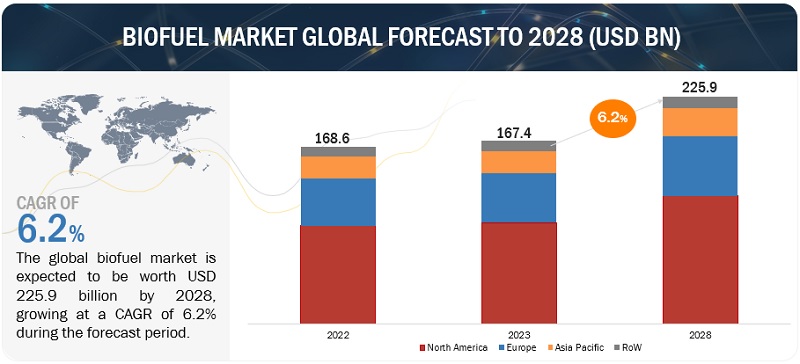
To know about the assumptions considered for the study, Request for Free Sample Report
To know about the assumptions considered for the study, download the pdf brochure
Biofuel Market Dynamics
Driver: Growing demand for cleaner fuels and favorable government policies
The growing demand for cleaner fuels is one of the major factors driving the biofuels market. Biofuels are renewable fuels that can be produced from a variety of biomass sources, such as crops, forestry residues, and municipal wastes. Several countries worldwide are trying to move away from dependence on oil imports. According to the Renewable Energy Directive (RED), the EU had set a goal of covering at least 20% of its total energy demand from renewable sources by 2020. The US Renewable Fuels Standards Program was created to reduce greenhouse gas emissions and expand the US renewable fuel sector. The implementation of stringent environmental regulations in several countries has also created the demand for efficient and less polluting energy sources, thus driving the growth of the biofuel market worldwide. For instance, the launch of the 2019 National Policy on Biofuel and the Food Safety and Standards Authority of India's (FSSAI) Repurposed Used Cooking Oil (RUCO) project has encouraged both established companies as well as startups to join the initiative. By 2040, India's primary energy demand is expected to double, with an increase in the usage of alternative fuels such as biodiesel. Biofuels are the most efficient alternative to fossil fuels, and they can be produced locally. As the final product is typically 95% carbon-free, these fuels also aid in reducing any negative effects on the environment.
Restraint: Requirement of high initial capital investment
The cost of building and operating a biofuels plant or biorefinery is significant, making it difficult for biofuels to compete with fossil fuels. The investment includes costs related to the installation of biorefineries, procurement, testing, maintenance, and cost of feedstock. Biofuel is a capital-intensive undertaking involving state-of-the-art technologies without prior experience or sufficient historical data. Energy-intensive processes require specialized energy production systems to co-generate heat or electricity. These are only a few factors that make investing in biofuels trading expensive and undesirable. The global inflation rate has been high, in part due to rising food and energy prices. This year, inflation is expected to be 6.6% in advanced economies and 9.5% in emerging markets and developing economies, and it is expected to stay higher for a longer period. Many economies have seen an increase in inflation as a result of supply chain disruptions, which have increased costs.
Opportunities: New oilfield discoveries to promote production activities
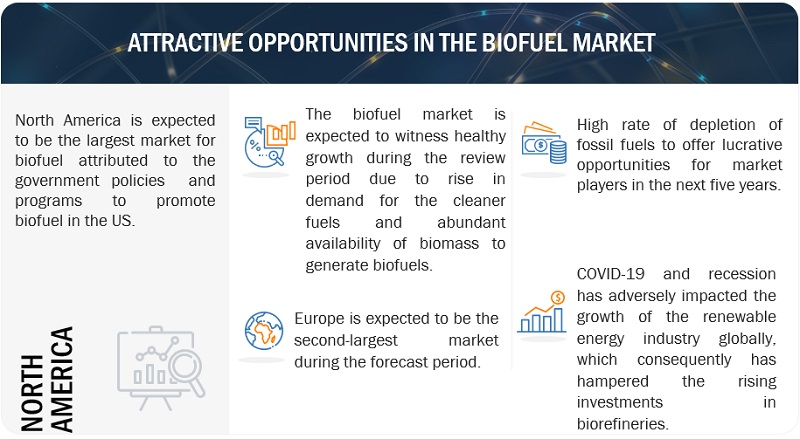
Fossil fuel reserves in the earth’s subsurface are limited. A finite resource will eventually run out if it is continuously used up. The demand for fuels is increasing day by day; it will directly drive the continuous rise in cost due to less availability of oil in the earth’s crust. Increased mining and extraction of high quantities of fossil fuels directly impact fossil fuel level depletion. According to Oil–Statistical Review of World Energy 2021, the earth has only the next 53 years of oil reserves left at the current consumption rate. According to the BP Statistical Review of World Energy 2021, fossil fuels accounted for 82% of primary energy use in 2020; in 2019, it was 83%, whereas five years ago, it used to be around 85%. So, as the quantity of fossil fuel reduces because of higher demand and less availability of crude oil, it will automatically impact its use every year. As the world faces the depletion of fossil fuels, many governments are promoting the use of biofuels instead of fossil fuels, creating opportunities for the biofuel industry.
Challenges: Variable and high cost of feedstock
The cost of the feedstock is a significant variable cost factor in the production of biofuel. To achieve high production and the longest possible onstream time, consistent feedstock quality is required. The variable and high feedstock cost is a challenge for the biofuels market. The cost of feedstock can vary depending on several factors, such as the type of feedstock, the location of the plant, and the market conditions. This can make it difficult for biofuels to compete with fossil fuels, which have a more stable price. The cost of different feedstock can vary significantly. For example, the cost of corn is relatively high, while the cost of sugarcane is relatively low. The feedstock cost can also vary depending on the plant’s location. For example, the cost of feedstock in Brazil is relatively low, while the cost in the US is relatively high. The cost of feedstock can also be affected by market conditions. For example, the cost of feedstock can increase during periods of high demand or when there is a shortage of feedstock.
Biofuel Market Ecosystem
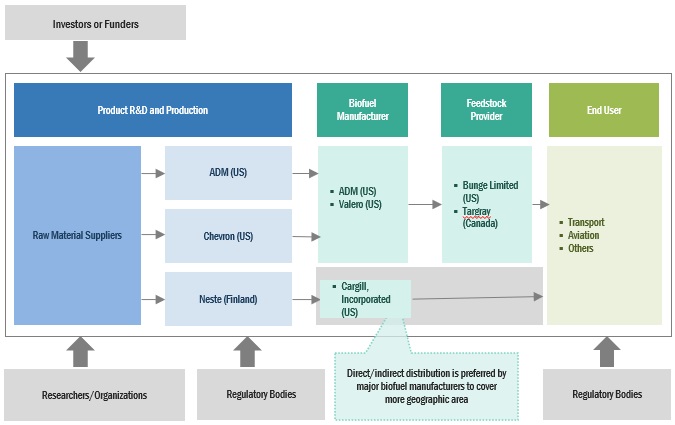
In this market, prominent companies stand out as well-established and financially stable providers of biofuel products and services. With years of experience, these companies boast a diverse product portfolio, cutting-edge technologies, and robust global sales and marketing networks. Their proven track record in the industry positions them as reliable and trusted partners for customers seeking biofuel solutions. These companies have demonstrated their ability to adapt to market dynamics and consistently deliver high-quality products and services, making them leaders in meeting the demands of the oil and gas sector. Prominent companies in this market include ADM (US), Chevron (US), Valero (US), Neste (Finland), and Cargill, Incorporated (US).
The biojets segment, by fuel type, is expected to be the fastest-growing market during the forecast period.
This report segments the biofuel market size based on fuel type into four types: ethanol, biodiesel, renewable diesel, and biojets. The biojets segment is expected to be the fastest-growing market during the forecast period. The growing investment in the production of sustainable aviation fuel is one of the key factors driving the biojets segment. Governments and international organizations are implementing regulations and targets to reduce aviation emissions. For instance, the International Civil Aviation Organisation (ICAO) has established industry-wide emission reduction targets. Incentives and mandates for the use of sustainable aviation fuels are frequently included in these regulations, boosting its adoption.
By end use, transportation is expected to be the largest segment during the forecast period.
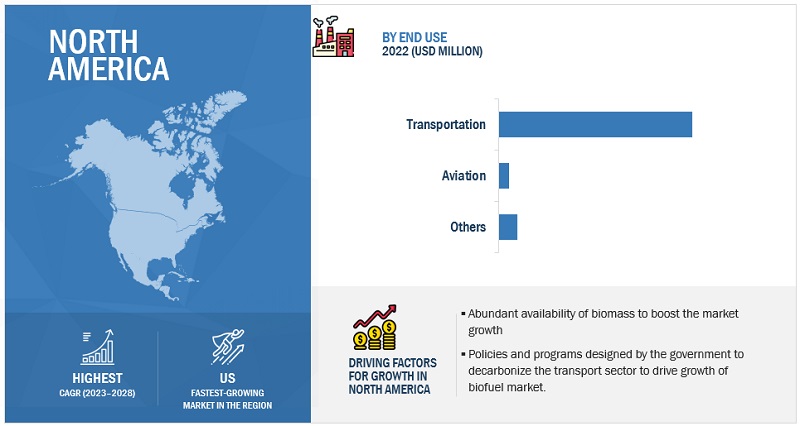
This report segments the biofuels market size is based on end use into three segments: transportation, aviation, and others. The transportation sector is a major source of greenhouse gas emissions. Biofuels can assist in lowering these emissions because they emit less carbon dioxide when burned as compared to fossil fuels. Governments worldwide have introduced regulations to encourage the use of renewable energy, such as biofuels. For instance, the European Union, has set a target to decarbonize the transport sector by 15% by 2025 and 30% by 2030.
“North America: The largest in the biofuel market.”
North America is expected to be the largest region in the biofuel market between 2023–2028, followed by Europe and Asia Pacific. North America has been leading the biofuel market. The regional biofuel market outlook is experiencing growth due to the presence of leading solution providers like ADM (US), Chevron (US), Valero (US), and Cargill, Incorporated (US). Notably, Valero invested around USD 315 million in January 2023 to enhance biofuel (sustainable aviation fuel) production, catering to North America's expanding market.
Key Market Players
The biofuel market is dominated by a few major players that have a wide regional presence. The major players in the biofuel market include ADM (US), Chevron (US), Valero (US), Neste (Finland), and Cargill, Incorporated (US). Between 2018 and 2023, Strategies such as new product launches, contracts, agreements, acquisitions, and expansions are followed by these companies to capture a larger share of the biofuel market.
Scope of the report
|
Report Metric |
Details |
|
Market size available for years |
2019–2028 |
|
Base year considered |
2022 |
|
Forecast period |
2023–2028 |
|
Forecast units |
Value (USD Million/Billion) |
|
Segments Covered |
Biofuel market by Fuel Type, Generation, End Use, and Region. |
|
Geographies covered |
Asia Pacific, North America, Europe, and Rest of the World |
|
Companies covered |
ADM (US), Chevron (US), Valero (US), Neste (Finland), Cargill, Incorporated (US), Wilmar International Ltd (Singapore), VERBIO AG (Germany), Borregaard AS (Norway), POET, LLC (US), The Andersons, Inc. (US), and Green Plains Inc. (US), BP p.l.c. (UK), FutureFuel Corporation (US), Münzer Bioindustrie GmbH (Austria), Aemetis, Inc. (US), CropEnergies AG (Germany), Raízen (Brazil), Blue Biofuels, Inc. (US), Pannonia Bio Zrt. (Hungary), GreenJoules (India), and Algenol (US). |
This research report categorizes the biofuels market based on fuel type, generation, end use, and region.
On the basis of Fuel Type:
- Ethanol
- Biodiesel
- Renewable Diesel
- Biojets
On the basis of Generation:
- First Generation
- Second Generation
- Third Generation
On the basis of End-Use:
- Transportation
- Aviation
-
Others
- Power Generation
- Heating
- Green Chemistry
On the basis of Region:
- North America
- Europe
- Asia Pacific
- Rest of the World
Recent Developments
- In May 2023, Neste and ITOCHU entered into a licencing agreement that will allow ITOCHU to become the official distributor of Neste MY Renewable Diesel in Japan.
- In February 2023, Neste opened an Innovation Centre in Singapore to improve its worldwide innovation and R&D capabilities. Asia has been an important market for Neste, and the new center will help the company's growth in the Asia-Pacific region.
- In June 2022, Cargill established its first state-of-the-art advanced biodiesel plant in Ghent, Belgium. This facility turns waste oils and residues into renewable fuel. The advanced biodiesel generated at the facility will be used in the maritime and trucking industries, allowing clients to reduce their carbon footprint connected with maritime and road transport activities.
- In March 2022, Chevron Renewable Energy Group launched its line of branded fuel solutions, EnDura Fuels, the line which produced many types of renewable fuel including InfinD, PuriD which is next-generation biodiesel, UltraClean BlenDVelociD, and beyond. These products help aviation, marine, trucking, rail, and other industries reach sustainability targets by using cleaner-burning and lower-emission fuels.
Frequently Asked Questions (FAQ):
What is the current size of the biofuel market?
The current market size of the biofuel market is USD 167.4 billion in 2023.
What are the major drivers for the biofuel market?
Growing demand for cleaner fuels and the implementation of supportive government policies to decarbonize various sectors are some of the major drivers for the biofuel market.
Which is the largest region during the forecasted period in the biofuel market?
North America is expected to dominate the biofuel market between 2023–2028, followed by Europe and Asia Pacific.
Which is the largest segment, by fuel type, during the forecasted period in the biofuel market?
The ethanol segment is expected to be the largest market during the forecast period. Raw materials such as corn, wheat, and sugarcane are predominantly used in the production of ethanol, which is widely available in various countries.
Which is the fastest segment, by end-use, during the forecasted period in the biofuel market?
Aviation is expected to be the fastest market during the forecast period. The production of biojet fuel is expected to scale up rapidly in the coming decade due to developments in technological pathways to commercialize the use of alternative jet fuels.
To speak to our analyst for a discussion on the above findings, click Speak to Analyst


- 5.1 INTRODUCTION
-
5.2 MARKET DYNAMICSDRIVERS- Favorable government policies promoting use of biofuels- Rising demand for cleaner fuels worldwide- Growing awareness of utilizing renewable sources to reduce greenhouse gas emissionsRESTRAINTS- Requirement for high initial capital investment- Uncertain economic conditions globallyOPPORTUNITIES- High depletion rate of fossil fuelsCHALLENGES- High variable costs of feedstock- High cost of setting up biofuel plants
-
5.3 TRENDS/DISRUPTIONS IMPACTING CUSTOMERS’ BUSINESSES
-
5.4 SUPPLY CHAIN ANALYSISFEEDSTOCK PROVIDERS/TECHNOLOGY AND EPC PROVIDERSBIOFUEL PRODUCERS/SUPPLIERSEND USERS
-
5.5 ECOSYSTEM/MARKET MAP
-
5.6 TECHNOLOGY ANALYSISTECHNOLOGY TRENDS IN BIOFUEL MARKETIMPLEMENTATION OF MACHINE LEARNING IN BIOFUEL MANUFACTURING PROCESSIOT-CONNECTED BIOFUEL PLANTS
-
5.7 PATENT ANALYSISLIST OF MAJOR PATENTS
-
5.8 TRADE ANALYSISIMPORT SCENARIOEXPORT SCENARIO
-
5.9 PRICING ANALYSISINDICATIVE PRICING ANALYSIS OF BIOFUELS, BY FUEL TYPEAVERAGE SELLING PRICE TREND, BY REGIONINDICATIVE PRICING ANALYSIS OF BIOFUELS, BY END USE
-
5.10 TARIFFS, CODES, AND REGULATORY BODIESREGULATORY BODIES, GOVERNMENT AGENCIES, AND OTHER ORGANIZATIONS
-
5.11 PORTER'S FIVE FORCES ANALYSISTHREAT OF SUBSTITUTESBARGAINING POWER OF SUPPLIERSBARGAINING POWER OF BUYERSTHREAT OF NEW ENTRANTSINTENSITY OF COMPETITIVE RIVALRY
- 5.12 CASE STUDY ANALYSIS
-
5.13 KEY STAKEHOLDERS AND BUYING CRITERIAKEY STAKEHOLDERS IN BUYING PROCESSBUYING CRITERIA
- 5.14 KEY CONFERENCES AND EVENTS, 2023–2024
- 6.1 INTRODUCTION
-
6.2 LIQUIDETHANOLBIODIESELRENEWABLE DIESELBIOJET
-
6.3 GASEOUSBIOGASBIOMETHANEBIOHYDROGEN
- 6.4 SOLID
- 7.1 INTRODUCTION
-
7.2 ETHANOLINCREASING CONCERNS OVER FOOD SECURITY TO ACCELERATE USE OF ETHANOL BLENDS
-
7.3 BIODIESELRISING USE OF BIODIESEL AS TRANSPORTATION FUEL TO DRIVE DEMAND
-
7.4 RENEWABLE DIESELGROWING FOCUS ON REDUCING CARBON EMISSIONS TO BOOST MARKET
-
7.5 BIOJETSURGING REQUIREMENT TO REDUCE CO2 AND GHG EMISSIONS IN AVIATION SECTOR TO PROPEL SEGMENTAL GROWTH
- 8.1 INTRODUCTION
-
8.2 TRANSPORTATIONBIOFUEL BLENDING MANDATES AND SUBSIDIES TO BOOST DEMAND FOR BIOFUELS
-
8.3 AVIATIONDROP-IN CAPABILITY OF BIOFUELS WITHOUT NEEDING TO REWORK AIRCRAFT INFRASTRUCTURE TO PROPEL MARKET
- 8.4 OTHER END USES
- 9.1 INTRODUCTION
-
9.2 FIRST GENERATIONEASY AVAILABILITY OF FEEDSTOCK TO BOOST DEMAND
-
9.3 SECOND GENERATIONTRANSITION TOWARD CLEAN ENERGY ECONOMY TO SUPPORT MARKET GROWTH
-
9.4 THIRD GENERATIONRISE IN DEMAND FOR ALGAE-BASED BIOFUELS TO DRIVE MARKET
- 10.1 INTRODUCTION
-
10.2 NORTH AMERICAIMPACT OF RECESSION ON BIOFUEL MARKET IN NORTH AMERICAUS- Government support, environmental concerns, and energy security to drive marketCANADA- Clean fuel regulations and stringent carbon reduction goals to boost demand for biofuelsMEXICO- Enforcement of policies liberalizing trade of biofuel products to drive market
-
10.3 EUROPEIMPACT OF RECESSION ON BIOFUEL MARKET IN EUROPEFRANCE- Development of sustainable biofuels from non-food feedstocks to foster market growthUK- Rising fossil fuel prices and environmental concerns to accelerate demand for biofuelsGERMANY- Biofuel blending mandates to support market growthPOLAND- Favorable policies to support development and use of biofuels to fuel market growthREST OF EUROPE
-
10.4 ASIA PACIFICIMPACT OF RECESSION ON BIOFUEL MARKET IN ASIA PACIFICCHINA- Growing export of biodiesel to drive marketINDIA- Significant investments in ethanol production and R&D to contribute to market growthINDONESIA- Rising adoption of biodiesel to accelerate market growthTHAILAND- Positive initiatives undertaken by government to support market growthREST OF ASIA PACIFIC
-
10.5 ROWIMPACT OF RECESSION ON BIOFUEL MARKET IN ROWBRAZIL- Significant investments in new biorefinery projects to drive marketARGENTINA- Rising use of bioethanol in fuel blends to boost demandCOLOMBIA- High domestic production of ethanol to boost marketOTHER COUNTRIES

-
11.1 OVERVIEWKEY PLAYER STRATEGIES
- 11.2 MARKET SHARE ANALYSIS, 2022
- 11.3 MARKET EVALUATION FRAMEWORK, 2019–2023
- 11.4 REVENUE ANALYSIS, 2018–2022
-
11.5 KEY COMPANY EVALUATION MATRIX, 2022STARSEMERGING LEADERSPERVASIVE PLAYERSPARTICIPANTS
- 11.6 COMPANY FOOTPRINT
-
11.7 STARTUPS/SMALL AND MEDIUM-SIZED ENTERPRISES (SMES) EVALUATION MATRIX, 2022PROGRESSIVE COMPANIESRESPONSIVE COMPANIESDYNAMIC COMPANIESSTARTING BLOCKS
- 11.8 COMPETITIVE BENCHMARKING
-
11.9 COMPETITIVE SCENARIOS AND TRENDSPRODUCT LAUNCHESDEALSOTHERS
-
12.1 KEY PLAYERSADM- Business overview- Products/Services/Solutions offered- Recent developments- MnM viewVALERO- Business overview- Products/Services/Solutions offered- Recent developments- MnM viewNESTE- Business overview- Products/Services/Solutions offered- Recent developments- MnM viewGREEN PLAINS INC.- Business overview- Products/Services/Solutions offered- Recent developmentsPOET, LLC.- Business overview- Products/Services/Solutions offered- Recent developmentsCHEVRON CORPORATION (CHEVRON RENEWABLE ENERGY GROUP)- Business overview- Products/Services/Solutions offered- Recent developments- MnM viewCARGILL, INCORPORATED- Business overview- Products/Services/Solutions offered- Recent developments- MnM viewWILMAR INTERNATIONAL LTD- Business overview- Products/Services/Solutions offeredTHE ANDERSONS, INC.- Business overview- Products/Services/Solutions offered- Recent developmentsVERBIO AG- Business overview- Products/Services/Solutions offered- Recent developmentsBORREGAARD AS- Business overview- Products/Services/Solutions offered- Recent developmentsAEMETIS, INC.- Business overview- Products/Services/Solutions offered- Recent developmentsRAÍZEN- Business overview- Products/Services/Solutions offered- Recent developmentsFUTUREFUEL CORPORATION- Business overview- Products/Services/Solutions offered
-
12.2 OTHER PLAYERSCROPENERGIES AGBP P.L.C.MÜNZER BIOINDUSTRIE GMBHALGENOLPANNONIA BIO ZRT.BLUE BIOFUELS, INC.
- 13.1 INSIGHTS FROM INDUSTRY EXPERTS
- 13.2 DISCUSSION GUIDE
- 13.3 KNOWLEDGESTORE: MARKETSANDMARKETS’ SUBSCRIPTION PORTAL
- 13.4 CUSTOMIZATION OPTIONS
- 13.5 RELATED REPORTS
- 13.6 AUTHOR DETAILS
- TABLE 1 BIOFUEL MARKET SNAPSHOT
- TABLE 2 MARKET: SUPPLY CHAIN ANALYSIS
- TABLE 3 MARKET: INNOVATIONS AND PATENT REGISTRATIONS, MARCH 2019–SEPTEMBER 2023
- TABLE 4 IMPORT DATA FOR HS CODE 3826, BY COUNTRY, 2020–2022 (USD THOUSAND)
- TABLE 5 EXPORT SCENARIO FOR HS CODE 3826, BY COUNTRY, 2020–2022 (USD THOUSAND)
- TABLE 6 INDICATIVE PRICING ANALYSIS OF BIOFUELS, BY FUEL TYPE, 2022
- TABLE 7 AVERAGE SELLING PRICE TREND, BY REGION, 2022
- TABLE 8 INDICATIVE PRICING ANALYSIS OF BIOFUELS, BY END USE, 2022
- TABLE 9 MARKET: PORTER'S FIVE FORCES ANALYSIS
- TABLE 10 INFLUENCE OF KEY STAKEHOLDERS ON BUYING PROCESS, BY END USE
- TABLE 11 KEY BUYING CRITERIA FOR TOP TWO PRODUCTS
- TABLE 12 MARKET: LIST OF CONFERENCES AND EVENTS
- TABLE 13 MARKET, BY FUEL TYPE, 2019–2022 (USD BILLION)
- TABLE 14 MARKET, BY FUEL TYPE, 2023–2028 (USD BILLION)
- TABLE 15 MARKET, BY FUEL TYPE, 2019–2022 (BILLION LITERS)
- TABLE 16 MARKET, BY FUEL TYPE, 2023–2028 (BILLION LITERS)
- TABLE 17 ETHANOL: MARKET, BY REGION, 2019–2022 (USD MILLION)
- TABLE 18 ETHANOL: MARKET, BY REGION, 2023–2028 (USD MILLION)
- TABLE 19 BIODIESEL: MARKET, BY REGION, 2019–2022 (USD MILLION)
- TABLE 20 BIODIESEL: MARKET, BY REGION, 2023–2028 (USD MILLION)
- TABLE 21 RENEWABLE DIESEL: MARKET, BY REGION, 2019–2022 (USD MILLION)
- TABLE 22 RENEWABLE DIESEL: MARKET, BY REGION, 2023–2028 (USD MILLION)
- TABLE 23 BIOJET: MARKET, BY REGION, 2019–2022 (USD MILLION)
- TABLE 24 BIOJET: MARKET, BY REGION, 2023–2028 (USD MILLION)
- TABLE 25 MARKET, BY END USE, 2019–2022 (USD BILLION)
- TABLE 26 MARKET, BY END USE, 2023–2028 (USD BILLION)
- TABLE 27 TRANSPORTATION: MARKET, BY REGION, 2019–2022 (USD MILLION)
- TABLE 28 TRANSPORTATION: MARKET, BY REGION, 2023–2028 (USD MILLION)
- TABLE 29 AVIATION: MARKET, BY REGION, 2019–2022 (USD MILLION)
- TABLE 30 AVIATION: MARKET, BY REGION, 2023–2028 (USD MILLION)
- TABLE 31 OTHER END USES: MARKET, BY REGION, 2019–2022 (USD MILLION)
- TABLE 32 OTHER END USES: MARKET, BY REGION, 2023–2028 (USD MILLION)
- TABLE 33 MARKET, BY GENERATION, 2019–2022 (USD BILLION)
- TABLE 34 MARKET, BY GENERATION, 2023–2028 (USD BILLION)
- TABLE 35 FIRST GENERATION: MARKET, BY FEEDSTOCK, 2019–2022 (USD BILLION)
- TABLE 36 FIRST GENERATION: MARKET, BY FEEDSTOCK, 2023–2028 (USD BILLION)
- TABLE 37 FIRST GENERATION: MARKET, BY REGION, 2019–2022 (USD MILLION)
- TABLE 38 FIRST GENERATION: MARKET, BY REGION, 2023–2028 (USD MILLION)
- TABLE 39 SECOND GENERATION: MARKET, BY FEEDSTOCK, 2019–2022 (USD BILLION)
- TABLE 40 SECOND GENERATION: MARKET, BY FEEDSTOCK, 2023–2028 (USD BILLION)
- TABLE 41 SECOND GENERATION: MARKET, BY REGION, 2019–2022 (USD MILLION)
- TABLE 42 SECOND GENERATION: MARKET, BY REGION, 2023–2028 (USD MILLION)
- TABLE 43 THIRD GENERATION: MARKET, BY FEEDSTOCK, 2019–2022 (USD BILLION)
- TABLE 44 THIRD GENERATION: MARKET, BY FEEDSTOCK, 2023–2028 (USD BILLION)
- TABLE 45 THIRD GENERATION: MARKET, BY REGION, 2019–2022 (USD MILLION)
- TABLE 46 THIRD GENERATION: MARKET, BY REGION, 2023–2028 (USD MILLION)
- TABLE 47 MARKET, BY REGION, 2019–2022 (USD BILLION)
- TABLE 48 MARKET, BY REGION, 2023–2028 (USD BILLION)
- TABLE 49 NORTH AMERICA: MARKET, BY FUEL TYPE, 2019–2022 (USD MILLION)
- TABLE 50 NORTH AMERICA: MARKET, BY FUEL TYPE, 2023–2028 (USD MILLION)
- TABLE 51 NORTH AMERICA: MARKET, BY GENERATION, 2019–2022 (USD MILLION)
- TABLE 52 NORTH AMERICA: MARKET, BY GENERATION, 2023–2028 (USD MILLION)
- TABLE 53 NORTH AMERICA: MARKET, BY END USE, 2019–2022 (USD MILLION)
- TABLE 54 NORTH AMERICA: MARKET, BY END USE, 2023–2028 (USD MILLION)
- TABLE 55 NORTH AMERICA: MARKET, BY COUNTRY, 2019–2022 (USD MILLION)
- TABLE 56 NORTH AMERICA: MARKET, BY COUNTRY, 2023–2028 (USD MILLION)
- TABLE 57 US: MARKET, BY FUEL TYPE, 2019–2022 (USD MILLION)
- TABLE 58 US: MARKET, BY FUEL TYPE, 2023–2028 (USD MILLION)
- TABLE 59 CANADA: MARKET, BY FUEL TYPE, 2019–2022 (USD MILLION)
- TABLE 60 CANADA: MARKET, BY FUEL TYPE, 2023–2028 (USD MILLION)
- TABLE 61 MEXICO: MARKET, BY FUEL TYPE, 2019–2022 (USD MILLION)
- TABLE 62 MEXICO: MARKET, BY FUEL TYPE, 2023–2028 (USD MILLION)
- TABLE 63 EUROPE: MARKET, BY FUEL TYPE, 2019–2022 (USD MILLION)
- TABLE 64 EUROPE: MARKET, BY FUEL TYPE, 2023–2028 (USD MILLION)
- TABLE 65 EUROPE: MARKET, BY GENERATION, 2019–2022 (USD MILLION)
- TABLE 66 EUROPE: MARKET, BY GENERATION, 2023–2028 (USD MILLION)
- TABLE 67 EUROPE: MARKET, BY END USE, 2019–2022 (USD MILLION)
- TABLE 68 EUROPE: MARKET, BY END USE, 2023–2028 (USD MILLION)
- TABLE 69 EUROPE: MARKET, BY COUNTRY, 2019–2022 (USD MILLION)
- TABLE 70 EUROPE: MARKET, BY COUNTRY, 2023–2028 (USD MILLION)
- TABLE 71 FRANCE: MARKET, BY FUEL TYPE, 2019–2022 (USD MILLION)
- TABLE 72 FRANCE: MARKET, BY FUEL TYPE, 2023–2028 (USD MILLION)
- TABLE 73 UK: MARKET, BY FUEL TYPE, 2019–2022 (USD MILLION)
- TABLE 74 UK: MARKET, BY FUEL TYPE, 2023–2028 (USD MILLION)
- TABLE 75 GERMANY: MARKET, BY FUEL TYPE, 2019–2022 (USD MILLION)
- TABLE 76 GERMANY: MARKET, BY FUEL TYPE, 2023–2028 (USD MILLION)
- TABLE 77 POLAND: MARKET, BY FUEL TYPE, 2019–2022 (USD MILLION)
- TABLE 78 POLAND: MARKET, BY FUEL TYPE, 2023–2028 (USD MILLION)
- TABLE 79 REST OF EUROPE: MARKET, BY FUEL TYPE, 2019–2022 (USD MILLION)
- TABLE 80 REST OF EUROPE: MARKET, BY FUEL TYPE, 2023–2028 (USD MILLION)
- TABLE 81 ASIA PACIFIC: MARKET, BY FUEL TYPE, 2019–2022 (USD MILLION)
- TABLE 82 ASIA PACIFIC: MARKET, BY FUEL TYPE, 2023–2028 (USD MILLION)
- TABLE 83 ASIA PACIFIC: MARKET, BY GENERATION, 2019–2022 (USD MILLION)
- TABLE 84 ASIA PACIFIC: MARKET, BY GENERATION, 2023–2028 (USD MILLION)
- TABLE 85 ASIA PACIFIC: MARKET, BY END USE, 2019–2022 (USD MILLION)
- TABLE 86 ASIA PACIFIC: MARKET, BY END USE, 2023–2028 (USD MILLION)
- TABLE 87 ASIA PACIFIC: MARKET, BY COUNTRY, 2019–2022 (USD MILLION)
- TABLE 88 ASIA PACIFIC: MARKET, BY COUNTRY, 2023–2028 (USD MILLION)
- TABLE 89 CHINA: MARKET, BY FUEL TYPE, 2019–2022 (USD MILLION)
- TABLE 90 CHINA: MARKET, BY FUEL TYPE, 2023–2028 (USD MILLION)
- TABLE 91 INDIA: MARKET, BY FUEL TYPE, 2019–2022 (USD MILLION)
- TABLE 92 INDIA: MARKET, BY FUEL TYPE, 2023–2028 (USD MILLION)
- TABLE 93 INDONESIA: MARKET, BY FUEL TYPE, 2019–2022 (USD MILLION)
- TABLE 94 INDONESIA: MARKET, BY FUEL TYPE, 2023–2028 (USD MILLION)
- TABLE 95 THAILAND: MARKET, BY FUEL TYPE, 2019–2022 (USD MILLION)
- TABLE 96 THAILAND: MARKET, BY FUEL TYPE, 2023–2028 (USD MILLION)
- TABLE 97 REST OF ASIA PACIFIC: MARKET, BY FUEL TYPE, 2019–2022 (USD MILLION)
- TABLE 98 REST OF ASIA PACIFIC: MARKET, BY FUEL TYPE, 2023–2028 (USD MILLION)
- TABLE 99 ROW: MARKET, BY FUEL TYPE, 2019–2022 (USD MILLION)
- TABLE 100 ROW: MARKET, BY FUEL TYPE, 2023–2028 (USD MILLION)
- TABLE 101 ROW: MARKET, BY GENERATION, 2019–2022 (USD MILLION)
- TABLE 102 ROW: MARKET, BY GENERATION, 2023–2028 (USD MILLION)
- TABLE 103 ROW: MARKET, BY END USE, 2019–2022 (USD MILLION)
- TABLE 104 ROW: MARKET, BY END USE, 2023–2028 (USD MILLION)
- TABLE 105 ROW: MARKET, BY COUNTRY, 2019–2022 (USD MILLION)
- TABLE 106 ROW: MARKET, BY COUNTRY, 2023–2028 (USD MILLION)
- TABLE 107 BRAZIL: MARKET, BY FUEL TYPE, 2019–2022 (USD MILLION)
- TABLE 108 BRAZIL: MARKET, BY FUEL TYPE, 2023–2028 (USD MILLION)
- TABLE 109 ARGENTINA: MARKET, BY FUEL TYPE, 2019–2022 (USD MILLION)
- TABLE 110 ARGENTINA: MARKET, BY FUEL TYPE, 2023–2028 (USD MILLION)
- TABLE 111 COLOMBIA: MARKET, BY FUEL TYPE, 2019–2022 (USD MILLION)
- TABLE 112 COLOMBIA: MARKET, BY FUEL TYPE, 2023–2028 (USD MILLION)
- TABLE 113 OTHER COUNTRIES: MARKET, BY FUEL TYPE, 2019–2022 (USD MILLION)
- TABLE 114 OTHER COUNTRIES: MARKET, BY FUEL TYPE, 2023–2028 (USD MILLION)
- TABLE 115 OVERVIEW OF STRATEGIES ADOPTED BY KEY PLAYERS
- TABLE 116 MARKET: DEGREE OF COMPETITION
- TABLE 117 MARKET: MARKET EVALUATION FRAMEWORK, 2019–2023
- TABLE 118 FUEL TYPE: COMPANY FOOTPRINT
- TABLE 119 GENERATION: COMPANY FOOTPRINT
- TABLE 120 END USE: COMPANY FOOTPRINT
- TABLE 121 REGION: COMPANY FOOTPRINT
- TABLE 122 MARKET: LIST OF KEY STARTUPS/SMES
- TABLE 123 FUEL TYPE: STARTUPS/SMES FOOTPRINT
- TABLE 124 GENERATION: STARTUPS/SMES FOOTPRINT
- TABLE 125 END USE: KEY PLAYERS
- TABLE 126 REGION: STARTUPS/SMES FOOTPRINT
- TABLE 127 MARKET: PRODUCT LAUNCHES, 2019–2023
- TABLE 128 MARKET: DEALS, 2018–2023
- TABLE 129 MARKET: OTHERS, 2019–2023
- TABLE 130 ADM: COMPANY OVERVIEW
- TABLE 131 ADM: PRODUCTS/SERVICES/SOLUTIONS OFFERED
- TABLE 132 ADM: DEALS
- TABLE 133 ADM: OTHERS
- TABLE 134 VALERO: COMPANY OVERVIEW
- TABLE 135 VALERO: PRODUCTS/SERVICES/SOLUTIONS OFFERED
- TABLE 136 VALERO: DEALS
- TABLE 137 VALERO: OTHERS
- TABLE 138 NESTE: COMPANY OVERVIEW
- TABLE 139 NESTE: PRODUCTS/SERVICES/SOLUTIONS OFFERED
- TABLE 140 NESTE: DEALS
- TABLE 141 NESTE: OTHERS
- TABLE 142 GREEN PLAINS INC.: COMPANY OVERVIEW
- TABLE 143 GREEN PLAINS INC.: PRODUCTS/SERVICES/SOLUTIONS OFFERED
- TABLE 144 GREEN PLAINS INC.: DEALS
- TABLE 145 GREEN PLAINS INC.: OTHERS
- TABLE 146 POET, LLC: COMPANY OVERVIEW
- TABLE 147 POET, LLC: PRODUCTS/SERVICES/SOLUTIONS OFFERED
- TABLE 148 POET, LLC: DEALS
- TABLE 149 POET, LLC: OTHERS
- TABLE 150 CHEVRON CORPORATION: COMPANY OVERVIEW
- TABLE 151 CHEVRON CORPORATION: PRODUCTS/SERVICES/SOLUTIONS OFFERED
- TABLE 152 CHEVRON CORPORATION: PRODUCT LAUNCHES
- TABLE 153 CHEVRON CORPORATION: DEALS
- TABLE 154 CHEVRON CORPORATION: OTHERS
- TABLE 155 CARGILL, INCORPORATED: COMPANY OVERVIEW
- TABLE 156 CARGILL, INCORPORATED: PRODUCTS/SERVICES/SOLUTIONS OFFERED
- TABLE 157 CARGILL, INCORPORATED: DEALS
- TABLE 158 CARGILL, INCORPORATED: OTHERS
- TABLE 159 WILMAR INTERNATIONAL LTD: COMPANY OVERVIEW
- TABLE 160 WILMAR INTERNATIONAL LTD: PRODUCTS/SERVICES/SOLUTIONS OFFERED
- TABLE 161 THE ANDERSONS, INC.: COMPANY OVERVIEW
- TABLE 162 THE ANDERSONS, INC.: PRODUCTS/SERVICES/SOLUTIONS OFFERED
- TABLE 163 THE ANDERSONS, INC.: DEALS
- TABLE 164 VERBIO AG: COMPANY OVERVIEW
- TABLE 165 VERBIO AG: PRODUCTS/SERVICES/SOLUTIONS OFFERED
- TABLE 166 VERBIO AG: DEALS
- TABLE 167 VERBIO AG: OTHERS
- TABLE 168 BORREGAARD AS: COMPANY OVERVIEW
- TABLE 169 BORREGAARD AS: PRODUCTS/SERVICES/SOLUTIONS OFFERED
- TABLE 170 BORREGAARD AS: OTHERS
- TABLE 171 AEMETIS, INC.: COMPANY OVERVIEW
- TABLE 172 AEMETIS, INC.: PRODUCTS/SERVICES/SOLUTIONS OFFERED
- TABLE 173 AEMETIS, INC.: DEALS
- TABLE 174 AEMETIS, INC.: OTHERS
- TABLE 175 RAÍZEN: COMPANY OVERVIEW
- TABLE 176 RAÍZEN: PRODUCTS/SERVICES/SOLUTIONS OFFERED
- TABLE 177 RAÍZEN: DEALS
- TABLE 178 RAÍZEN: OTHERS
- TABLE 179 FUTUREFUEL CORPORATION: COMPANY OVERVIEW
- TABLE 180 FUTUREFUEL CORPORATION: PRODUCTS/SERVICES/SOLUTIONS OFFERED
- FIGURE 1 MARKET: SEGMENTATION
- FIGURE 2 MARKET: RESEARCH DESIGN
- FIGURE 3 KEY DATA FROM PRIMARY SOURCES
- FIGURE 4 BREAKDOWN OF PRIMARY INTERVIEWS: BY COMPANY TYPE, DESIGNATION, AND REGION
- FIGURE 5 DATA TRIANGULATION METHODOLOGY
- FIGURE 6 MARKET SIZE ESTIMATION METHODOLOGY: BOTTOM-UP APPROACH
- FIGURE 7 MARKET SIZE ESTIMATION METHODOLOGY: TOP-DOWN APPROACH
- FIGURE 8 MAIN METRICS CONSIDERED TO ANALYZE AND ASSESS DEMAND FOR BIOFUELS
- FIGURE 9 MARKET: SUPPLY-SIDE ANALYSIS
- FIGURE 10 ETHANOL SEGMENT TO HOLD LARGEST SHARE OF MARKET, BY FUEL TYPE, IN 2028
- FIGURE 11 TRANSPORTATION SEGMENT TO LEAD MARKET, BY END USE, IN 2028
- FIGURE 12 FIRST-GENERATION BIOFUELS TO HOLD LARGEST SHARE OF MARKET, BY GENERATION, IN 2028
- FIGURE 13 NORTH AMERICA DOMINATED MARKET, BY REGION, IN 2022
- FIGURE 14 INCREASING GLOBAL FOCUS ON GHG EMISSION REDUCTION AND ENERGY SUFFICIENCY TO DRIVE MARKET
- FIGURE 15 ETHANOL AND US HELD LARGEST MARKET SHARES IN NORTH AMERICA IN 2022
- FIGURE 16 MARKET IN EUROPE TO RECORD HIGHEST CAGR DURING FORECAST PERIOD
- FIGURE 17 FIRST-GENERATION BIOFUELS HELD LARGEST MARKET SHARE IN 2022
- FIGURE 18 ETHANOL SEGMENT ACCOUNTED FOR LARGEST MARKET SHARE IN 2022
- FIGURE 19 TRANSPORTATION CAPTURED MAJOR MARKET SHARE IN 2022
- FIGURE 20 MARKET: DRIVERS, RESTRAINTS, OPPORTUNITIES, AND CHALLENGES
- FIGURE 21 REVENUE SHIFTS AND NEW REVENUE POCKETS FOR BIOFUEL PROVIDERS
- FIGURE 22 MARKET: SUPPLY CHAIN ANALYSIS
- FIGURE 23 ECOSYSTEM ANALYSIS
- FIGURE 24 MARKET: PATENT REGISTRATIONS, 2012–2022
- FIGURE 25 IMPORT DATA, BY TOP FIVE COUNTRIES, 2020–2022 (USD THOUSAND)
- FIGURE 26 EXPORT DATA, BY TOP FIVE COUNTRIES, 2020–2022 (USD THOUSAND)
- FIGURE 27 MARKET: PORTER'S FIVE FORCES ANALYSIS
- FIGURE 28 INFLUENCE OF KEY STAKEHOLDERS ON BUYING PROCESS, BY END USE
- FIGURE 29 INFLUENCE OF KEY STAKEHOLDERS ON BUYING PROCESS FOR TOP TWO PRODUCTS
- FIGURE 30 MARKET, BY FUEL TYPE, 2022
- FIGURE 31 TRANSPORTATION SEGMENT TO DOMINATE BIOFUEL MARKET IN 2028
- FIGURE 32 BIOFUEL MARKET, BY GENERATION, 2022
- FIGURE 33 EUROPE TO EXHIBIT FASTEST CAGR DURING FORECAST PERIOD
- FIGURE 34 NORTH AMERICA DOMINATED BIOFUEL MARKET IN 2022
- FIGURE 35 NORTH AMERICA: BIOFUEL MARKET SNAPSHOT
- FIGURE 36 EUROPE: BIOFUEL MARKET SNAPSHOT
- FIGURE 37 BIOFUEL MARKET: MARKET SHARE ANALYSIS, 2022
- FIGURE 38 BIOFUEL MARKET: REVENUE ANALYSIS, 2018–2022
- FIGURE 39 BIOFUEL MARKET: KEY COMPANY EVALUATION MATRIX, 2022
- FIGURE 40 BIOFUEL MARKET: STARTUPS/SMES EVALUATION MATRIX, 2022
- FIGURE 41 ADM: COMPANY SNAPSHOT
- FIGURE 42 VALERO: COMPANY SNAPSHOT
- FIGURE 43 NESTE: COMPANY SNAPSHOT
- FIGURE 44 GREEN PLAINS INC.: COMPANY SNAPSHOT
- FIGURE 45 CHEVRON CORPORATION: COMPANY SNAPSHOT
- FIGURE 46 CARGILL, INCORPORATED: COMPANY SNAPSHOT
- FIGURE 47 WILMAR INTERNATIONAL LTD: COMPANY SNAPSHOT
- FIGURE 48 THE ANDERSONS, INC.: COMPANY SNAPSHOT
- FIGURE 49 VERBIO AG: COMPANY SNAPSHOT
- FIGURE 50 BORREGAARD AS: COMPANY SNAPSHOT
- FIGURE 51 AEMETIS, INC.: COMPANY SNAPSHOT
- FIGURE 52 RAÍZEN: COMPANY SNAPSHOT
- FIGURE 53 FUTUREFUEL CORPORATION: COMPANY SNAPSHOT
The study involved major activities in estimating the current size of the biofuel market. Exhaustive secondary research was done to collect information on the peer and parent markets. The next step was to validate these findings, assumptions, and sizing with industry experts across the value chain through primary research. Both top-down and bottom-up approaches were employed to estimate the total market size. Thereafter, market breakdown and data triangulation were used to estimate the market size of the segments and subsegments.
Secondary Research
This research study on the biofuel market involved the use of extensive secondary sources, directories, and databases, such as Hoover’s, Bloomberg, Factiva, IRENA, International Energy Agency, and Statista Industry Journal, to collect and identify information useful for a technical, market-oriented, and commercial study of the biofuel market. The other secondary sources included annual reports, press releases & investor presentations of companies, white papers, certified publications, articles by recognized authors, manufacturer associations, trade directories, and databases.
Primary Research
The biofuel market comprises several stakeholders, such as feedstock providers, biofuel manufacturers and distributors, and end users in the supply chain. The demand side of this market is characterized by the rising demand for various fuel types of biofuels such as ethanol, biodiesel, renewable diesel, and biojets. The supply side is characterized by rising demand for contracts from the transport sector and mergers & acquisitions among big players. Various primary sources from both the supply and demand sides of the market were interviewed to obtain qualitative and quantitative information. Following is the breakdown of primary respondents:

To know about the assumptions considered for the study, download the pdf brochure
Market Size Estimation
Both top-down and bottom-up approaches were used to estimate and validate the total size of the biofuel market. These methods were also used extensively to estimate the size of various subsegments in the market. The research methodology used to estimate the market size includes the following:
- The key players in the industry and market have been identified through extensive secondary research, and their market share has been determined through primary and secondary research.
- The industry’s value chain and market size, in terms of value, have been determined through both primary and secondary research processes.
- All percentage shares, splits, and breakdowns have been determined using secondary sources and verified through primary sources.
Biofuel Market Size: Top-Down Approach
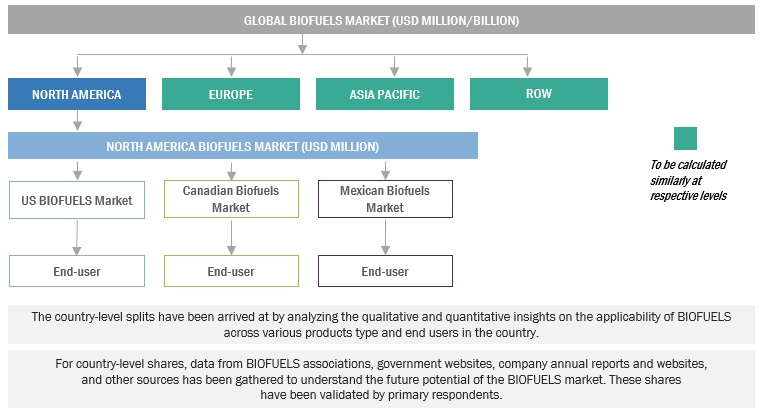
To know about the assumptions considered for the study, Request for Free Sample Report
Biofuel Market Size: Bottom-Up Approach
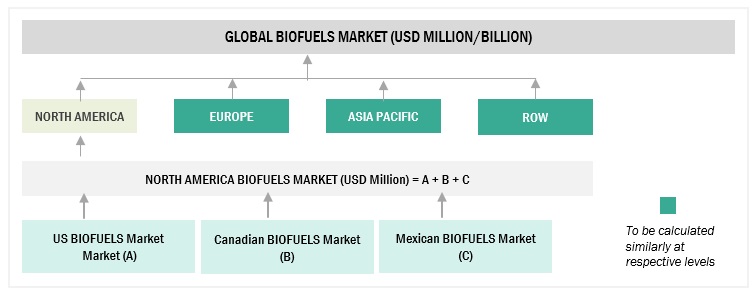
Data Triangulation
After arriving at the overall market size from the above estimation process, the total market has been split into several segments and subsegments. Data triangulation and market breakdown processes have been employed to complete the overall market engineering process and arrive at the exact statistics for all the segments and sub-segments, wherever applicable. The data has been triangulated by studying various factors and trends from both the demand- and supply sides. Along with this, the market has been validated using both the top-down and bottom-up approaches.
Market Definition
- Biofuel is produced from biomass, which is organic matter from living or recently living organisms. Biomass can be used to produce a variety of fuels, including ethanol, biodiesel, renewable diesel, and biojets. Biofuels are a renewable energy source because they can be produced from plant matter that can be grown and harvested on a regular basis.
- The market for biofuels is defined as the sum of revenues generated by global companies offering biofuels, such as ethanol, biodiesel, renewable diesel, and biojets. Biofuels can be utilized in various applications such as transportation, aviation, power generation, heating, and other applications.
Key Stakeholders
- Biofuel vendors
- Bio-based products and bioenergy dealers and suppliers
- Consulting companies in the energy & power sector
- Energy regulators
- Government and research organizations
- Power and energy associations
- Repairs and maintenance service providers
- State and national regulatory authorities
- End-use industries
- Research and consulting companies in the clean energy generation sector
- Organizations, forums, alliances, and associations
- Industrial authorities and associations
- State and national regulatory authorities
- Research institutes
Objectives of the Study
- To describe, segment, and forecast the biofuel market on the basis of fuel type, generation, end-use, and region in terms of value.
- To forecast the biofuel market size by fuel type in terms of volume
- To forecast the market size across four key regions: North America, Europe, Asia Pacific, and Rest of the World (RoW), along with country-level analysis
- To provide detailed information regarding key drivers, restraints, opportunities, and challenges influencing the market growth
- To provide the supply chain analysis, trends/disruptions impacting customers’ businesses, market map, pricing analysis, and regulatory analysis of the biofuel market
- To analyze opportunities for stakeholders and provide a detailed competitive landscape of the market leaders
- To strategically analyze the ecosystem, tariffs and regulations, patent landscape, trade landscape, Porter’s five forces, and case studies pertaining to the market under study
- To benchmark players within the market using the company evaluation matrix, which analyzes market players based on several parameters within the broad categories of business and product strategies
- To compare key market players with respect to product specifications and applications
- To strategically profile key players and comprehensively analyze their market rankings and core competencies
- To analyze competitive developments, such as contracts, agreements, investments, expansions, acquisitions, product launches, partnerships, joint ventures, and collaborations, in the biofuel market.
Available Customizations:
With the given market data, MarketsandMarkets offers customizations according to the specific requirements of companies. The following customization options are available for the report:
Product Analysis
- Product Matrix, which provides a detailed comparison of the product portfolio of each company
Company Information
- Detailed analyses and profiling of additional market players


Growth opportunities and latent adjacency in Biofuel Market