The study involved major activities in estimating the current size of the biorefinery market. Exhaustive secondary research was done to collect information on the peer and parent markets. The next step was to validate these findings, assumptions, and sizing with industry experts across the value chain through primary research. Both top-down and bottom-up approaches were employed to estimate the total market size. Thereafter, market breakdown and data triangulation were used to estimate the market size of the segments and subsegments.
Secondary Research
Secondary sources referred to for this research study include annual reports, press releases, and investor presentations of companies; white papers; certified publications; articles by recognized authors; and databases of various companies and associations. Secondary research was mainly used to obtain key information about the industry’s supply chain, the total pool of key players, market classification, and segmentation according to industry trends to the bottom-most level, regional markets, and key developments from both, market- and technology-oriented perspectives.
Primary Research
In the primary research process, various primary sources from the supply and demand sides were interviewed to obtain qualitative and quantitative information for this report. Primary sources from the supply side include industry experts such as chief executive officers (CEOs), vice presidents (VPs), marketing directors, and related key executives from various companies and organizations operating in the biorefinerys market.
In the complete market engineering process, the top-down and bottom-up approaches, along with several data triangulation methods, were extensively used to perform the market size estimations and forecasts for all segments and subsegments listed in this report. Extensive qualitative and quantitative analyses were conducted to complete the market engineering process and list key information/insights throughout the report. Following is the breakdown of primary respondents:

To know about the assumptions considered for the study, download the pdf brochure
Market Size Estimation
Both top-down and bottom-up approaches were used to estimate and validate the size of the biorefinery market. These methods were also used extensively to estimate the size of various subsegments in the market. The research methodology used to estimate the market size includes the following:

To know about the assumptions considered for the study, Request for Free Sample Report
Data Triangulation
After arriving at the overall market size from the estimation process explained below, the total market was split into several segments and subsegments. The data triangulation and market breakdown procedures were employed, wherever applicable, to complete the overall market engineering process and arrive at the exact statistics for all segments and subsegments. The data was triangulated by studying various factors and trends from both the demand and supply sides. The market size was validated using the top-down and bottom-up approaches.
Market Definition
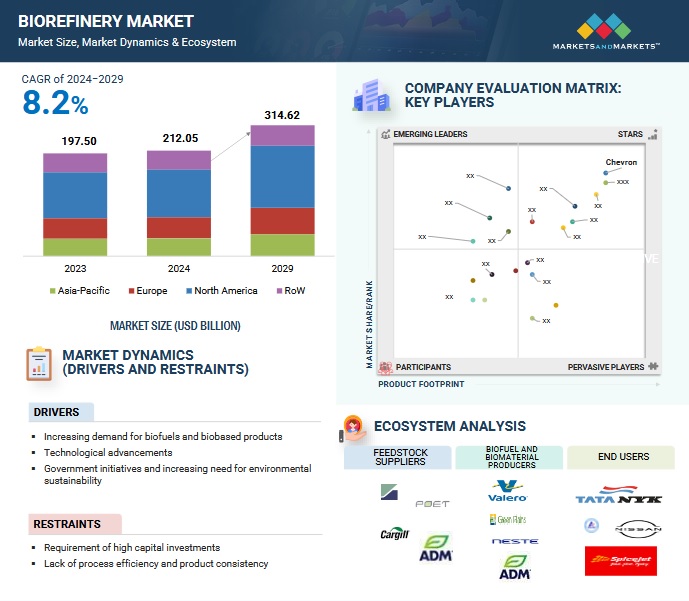
Biorefinery is a facility that converts biomass into bioenergy and bio-based products. Biorefineries can provide a variety of chemicals by fractionating an initial raw material (biomass) into numerous intermediates, such as carbohydrates, proteins, and triglycerides, that can then be further processed into value-added products. The use of biomass as feedstock leads to low emissions of pollutants or hazardous compounds, thus minimizing harmful effects on the environment.
The biorefinery market represents the annual capacity of major companies to produce bioenergy (especially biofuels) and bio-based products. The regions considered for the biorefinery market study include North America, Europe, Asia Pacific, and the Rest of the World (RoW).
Research Objectives
-
To define, describe, segment, and forecast the biorefinery market by product, type, technology, and region, in terms of value
-
To forecast the biorefinery market by energy driven product, in terms of volume
-
To forecast the market size for four key regions: North America, Europe, Asia Pacific, and the Rest of the World (RoW), along with their country-level market sizes, in terms of value
-
To provide detailed information regarding key drivers, restraints, opportunities, and challenges influencing the market growth
-
To strategically analyze the micromarkets1 with respect to individual growth trends, prospects, and contributions to the overall market size
-
To provide value chain analysis, ecosystem analysis, case study analysis, patent analysis, trade analysis, technology analysis, average selling price (ASP) analysis, Porter’s five forces analysis, and regulations pertaining to the biorefinery market
-
To analyze opportunities for stakeholders in the biorefinery market and draw a competitive landscape for market players
-
To strategically analyze the ecosystem, regulations, patents, and trading scenarios pertaining to the biorefinery market
-
To benchmark players within the market using the company evaluation matrix, which analyzes market players on various parameters within the broad categories of business and product strategies
-
To compare key market players with respect to their market share, product specifications, and applications
-
To strategically profile key players and comprehensively analyze their market rankings and core competencies2
-
To analyze competitive developments, such as contracts & agreements, investments & expansions, mergers & acquisitions, partnerships, and collaborations, in the biorefinery market
-
To study the impact of AI/Gen AI on the market under study, along with the global macroeconomic outlook
Key Stakeholders
-
Biofuel vendors
-
Bioenergy association
-
Bio-based products and bioenergy dealers and suppliers
-
Consulting companies in the energy & power sector
-
Consulting companies related to the energy & power sector
-
Energy regulators
-
Government and research organizations
-
Power and energy associations
-
Repairs and maintenance service providers
-
State and national regulatory authorities
-
Research and consulting companies in the clean energy generation sector
-
Organizations, forums, alliances, and associations
-
Industrial authorities and associations
-
State and national regulatory authorities
-
Biorefinery operators
-
Universities and Research institutes
Available Customizations:
With the given market data, MarketsandMarkets offers customizations according to the specific requirements of companies. The following customization options are available for the report:
PRODUCT ANALYSIS
-
Product Matrix, which provides a detailed comparison of the product portfolio of each company
COMPANY INFORMATION
-
Detailed analyses and profiling of additional market players


 HIGHEST CAGR MARKET IN 2024-2029
 CANADA TO BE FASTEST-GROWING MARKET IN REGION
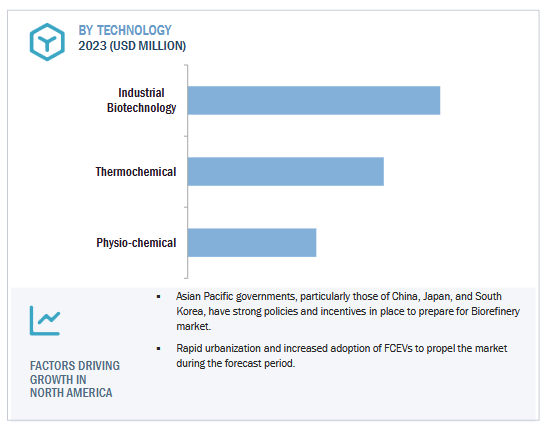


Growth opportunities and latent adjacency in Biorefinery Market