Bioinsecticides Market Size, Share, Industry Growth, Trends Report by Organism Type (Bacteria Thuringiensis, Beauveria Bassiana, and Metarhizium Anisopliae), Type (Microbials and Macrobials), Mode of Application, Formulation, Crop Type, and Region - Global Trends & Forecast to 2025


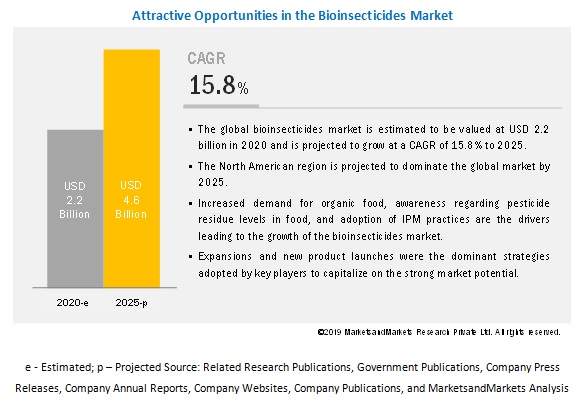
The global bioinsecticides market size projected to grow at a CAGR of 15.8% from an estimated value of USD 2.2 billion in 2020 to reach USD 4.6 billion by 2025. The increasing area under organic cultivation and growing concerns toward the impact of pesticide use on biodiversity is leading to the growth of the bioinsecticide industry.
The role of Integrated Pest Management (IPM) practices in biological crop protection has been gaining importance worldwide. The government has been supportive of the adoption of bioinsecticides through imposing laws and policies, which are in sync with the sustainability of the environment. Strategic developments such as expansions, new product launches, collaborations, and agreements have been adopted by the majority of key players to strengthen the bioinsecticides market.
By organism type, the baculovirus segment is projected to dominate the bioinsecticides market during the forecast period.
With the ban of key synthetic pesticides, there is a significant growth in the usage of bioinsecticides. Baculovirus is an effective biocontrol agent that does not harm the health of applicators, do not kill natural enemies of pests, do not contaminate the environment, or leave residues in the products; these are some of the driving factors for the growth of baculovirus as a bioinsecticide. The US has been one of the key markets for using virus-based bioinsecticides. Due to its effectiveness in killing invasive pests, it has boosted the growth of the baculovirus market.
By crop type, the fruits & vegetables segment is projected to be the fastest-growing segment in the bioinsecticides market during the forecast period.
Increasing demand for high-value crops grown under organic farming is driving market growth. With the change in dietary habits, farmers are compelled to cultivate crops organically using inputs that are devoid of harmful chemicals.
There is huge infestation witnessed in fruits and vegetables both in open fields and greenhouses. To meet the export demand for residue-free crops, farmers are implementing the use of bioinsecticide in combination with conventional chemicals. These are some of the key reasons that are driving the adoption of bioinsecticides in the fruits & vegetables segment.
By mode of application, the foliar spray segment is projected to be the fastest-growing segment in the bioinsecticides market during the forecast period.
Foliar spray is widely used among farmers as it helps in the immediate recovery of pest-infected parts of plants. It is considered to be more effective as it is easy to handle and safe in application. These are the reasons that are driving the adoption of foliar spray mode of application in the bioinsecticide industry.
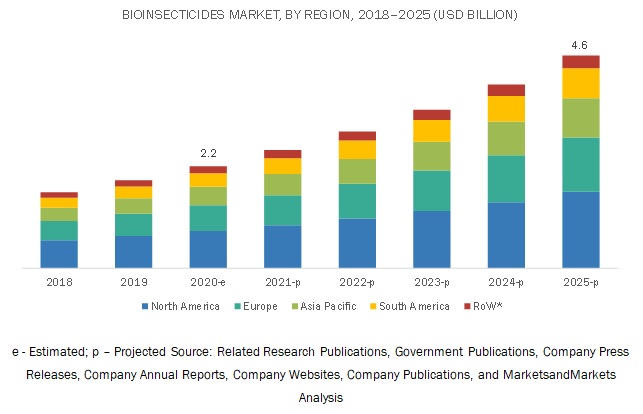
The increasing demand for bioinsecticides in the North American region is projected to drive the market.
The North American region accounted for the majority of the global bioinsecticides market share in 2019. The US is one of the leading countries for the export of various fruits and vegetables. Consumers are shifting their eating habits to residue-free crop produce. An increase in the awareness of pesticide residue levels in crops is driving the adoption of bioinsecticides. Also, the huge presence of companies in the US has led to investments and research on biological crop protection products.
Key Market Players
Key players in the bioinsecticides market include BASF SE (Germany), Syngenta AG (Switzerland), Marrone Bio Innovations (US), Bayer AG (Germany), Novozymes (Denmark), and Nufarm (Australia).
Scope of the report
|
Report Metric |
Details |
|
Market size available for years |
2018-2025 |
|
Base year considered |
2019 |
|
Forecast period |
2020-2025 |
|
Forecast units |
Value (USD million) |
|
Segments covered |
|
|
Regions covered |
|
|
Key Companies covered |
|
This research report provides bioinsecticides market which includes:
- By Type (Macrobials, Microbials, and Other types which include biorational and plant extract products
- By Organism Type (Bacillus thuringiensis, Beauveria bassiana, Verticillium lecanii, Metarhizium anisopliae, Baculovirus, and other organism types which include entomogenous nematodes, predatory insect and protozoa
- By Mode of Application (Foliar spray, Soil treatment, Seed treatment, and other mode of application which includes post-harvest and root dipping
- By Crop Type (Cereals & grains, Oilseeds & pulses, Fruits & vegetables, and Other crop types which include turf, ornamental and plantation crops
- By Formulation (Dry and Liquid)
- By Region
Recent Developments:
- In March 2020, Marrone Bio Innovations signed an agreement with Anasac (Chile) to develop and distribute Grandevo and Venerate bioinsecticide in Chile.
- In March 2020, Andermatt Biocontrol AGs’ Madex Top product was approved to be used in Sweden and Israel, to control codling moth in pome fruit orchards.
- In October 2019, Nufarm opened a new manufacturing facility in Greenville, Mississippi, US, which will allow the company to support its expanding portfolio and provide customers with high-quality crop protection products.
- In July 2019, a new biological insecticide named Velifer was launched by BASF SE for pest control in vegetable crops, registered for use in Australia.
- In March 2019, Syngenta AG launched its first bioinsecticide, Costar, in Portugal. The formulation is based on the strain of Bacillus spp., for use in more than 50 crops in European countries.
Key questions addressed by the report:
- Who are some of the key players operating in the bioinsecticides market, and how intense is the competition?
- What kind of competitors and stakeholders would be interested in this market? What will be their go-to-market strategy, and which emerging market will be of significant interest?
- How are the current R&D activities and M&As in the bioinsecticides market projected to create a disrupting environment in the coming years?
- What will be the level of impact of new product launches on the revenues of stakeholders due to the benefits offered by bioinsecticides, such as increasing revenue, environmental regulatory compliance, and sustainable profits for suppliers?
- Which regions are projected to witness an increase in the consumption of bioinsecticides?
To speak to our analyst for a discussion on the above findings, click Speak to Analyst
 Exclusive indicates content/data unique to MarketsandMarkets and not available with any competitors.
TABLE OF CONTENTS
1 INTRODUCTION (Page No. - 21)
1.1 OBJECTIVES OF THE STUDY
1.2 MARKET DEFINITION
1.3 STUDY SCOPE
1.4 INCLUSIONS & EXCLUSIONS
1.5 PERIODIZATION CONSIDERED
1.6 CURRENCY CONSIDERED
1.7 STAKEHOLDERS
2 RESEARCH METHODOLOGY (Page No. - 26)
2.1 RESEARCH DATA
2.1.1 SECONDARY DATA
2.1.1.1 Key Data from Secondary Sources
2.1.2 PRIMARY DATA
2.1.2.1 Key Data from Primary Sources
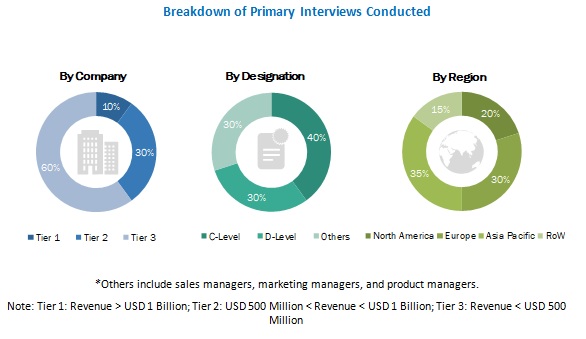
2.1.2.2 Breakdown of Primaries
2.2 MARKET SIZE ESTIMATION
2.2.1 BOTTOM-UP APPROACH
2.2.2 TOP-DOWN APPROACH
2.3 MARKET BREAKDOWN & DATA TRIANGULATION
2.4 RESEARCH ASSUMPTIONS & LIMITATIONS
2.4.1 ASSUMPTIONS
2.4.2 LIMITATIONS OF THE STUDY
3 EXECUTIVE SUMMARY (Page No. - 34)
4 PREMIUM INSIGHTS (Page No. - 38)
4.1 OPPORTUNITIES IN THE BIOINSECTICIDES MARKET
4.2 BIOINSECTICIDES MARKET, BY TYPE
4.3 SOUTH AMERICA: BIOINSECTICIDES MARKET, BY KEY COUNTRY & CROP TYPE
4.4 BIOINSECTICIDES MARKET, BY ORGANISM TYPE & REGION
4.5 BIOINSECTICIDES MARKET: MAJOR REGIONAL SUBMARKETS
5 MARKET OVERVIEW (Page No. - 41)
5.1 INTRODUCTION
5.2 MACROECONOMIC INDICATORS
5.2.1 GROWTH IN ORGANIC AGRICULTURAL PRACTICES
5.2.2 INCREASE IN ORGANIC FARM AREA
5.3 MARKET DYNAMICS
5.3.1 DRIVERS
5.3.1.1 Increase in pest resurgence and Integrated Pest Management (IPM) measures
5.3.1.2 Growth in acceptance for organic food
5.3.1.3 Awareness programs by government agencies
5.3.1.4 Huge crop loss due to invasive pest attacks
5.3.1.5 High costs associated with the development of synthetic crop protection products
5.3.2 RESTRAINTS
5.3.2.1 Short shelf life of bioinsecticides
5.3.2.2 Poor infrastructure & high initial investment required for storage and transport of bioinsecticides
5.3.3 OPPORTUNITIES
5.3.3.1 High growth in bio-control seed treatment solutions
5.3.3.2 Providing customized solutions targeted toward specific pests
5.3.3.3 Growth opportunities in developing regions such as Asia Pacific and South America
5.3.4 CHALLENGES
5.3.4.1 Counterfeit products in developing countries
5.3.4.2 Lack of awareness and low utilization of bioinsecticides
5.4 REGULATORY FRAMEWORK
5.4.1 NORTH AMERICA
5.4.1.1 US
5.4.1.1.1 The Federal Insecticide, Fungicide, and Rodenticide Act (FIFRA)
5.4.1.1.2 The Federal Food, Drug, and Cosmetic Act (FFDCA)and the Food Quality Protection Act (FQPA)
5.4.1.1.3 Pesticide Registration Improvement Extension Act (PRIA 3), 2012
5.4.1.1.4 Biopesticide Registration
5.4.2 EUROPE
5.4.2.1 Ëuropean Union
5.4.2.1.1 Regulation (EC) No 1107/2009 of the European Parliament and of the council of 21 October 2009
5.4.2.1.2 Scope
5.4.2.1.3 Active Substances: Requirements and Conditions for Approval
5.4.3 ASIA PACIFIC
5.4.3.1 India
5.4.3.2 China
5.4.4 SOUTH AMERICA
5.4.4.1 Brazil
5.5 SUPPLY CHAIN ANALYSIS
5.5.1 COVID-19 IMPACT ON THE BIOINSECTICIDES MARKET
5.6 VALUE CHAIN ANALYSIS
5.7 PATENT ANALYSIS
6 BIOINSECTICIDES MARKET, BY MODE OF APPLICATION (Page No. - 63)
6.1 INTRODUCTION
6.2 SEED TREATMENT
6.2.1 SEED TREATMENT IS GAINING POPULARITY TO CONTROL SOILBORNE PESTS
6.3 SOIL TREATMENT
6.3.1 SOIL TREATMENT USED DURING EARLY STAGES OF PLANT GROWTH, TO PREVENT SOIL BORNE INSECT LARVAE ATTACK
6.4 FOLIAR SPRAY
6.4.1 FOLIAR SPRAY HAS BEEN THE PREFERRED APPLICATION IN ALL KEY CROPS
6.5 OTHER MODES OF APPLICATION
6.5.1 BIOINSECTICIDES ARE GAINING INTEREST FOR POST-HARVEST PROTECTION OF FRUITS & VEGETABLES
7 BIOINSECTICIDES MARKET, BY ORGANISM TYPE (Page No. - 69)
7.1 INTRODUCTION
7.2 BACILLUS THURINGIENSIS
7.2.1 BT BIOINSECTICIDES ARE GAINING INTEREST AS POST-HARVEST PROTECTION FOR FRUITS & VEGETABLES
7.3 BEAUVERIA BASSIANA
7.3.1 B.BASSIANA IS USED TO CONTROL WHITEFLY, YELLOW STEM BORER, AND BROWN PLANT HOPPER
7.4 METARHIZIUM ANISOPLIAE
7.4.1 M.ANISOPLIAE MAKE AN EFFECTIVE TOOL TO CONTROL SPITTLE BUG IN SUGARCANE
7.5 VERTICILLIUM LECANII
7.5.1 THE FUNGUS HAS A WIDE RANGE OF APPLICATIONS ON VARIOUS CROPS
7.6 BACULOVIRUS
7.6.1 BACULOVIRUSES ARE EFFECTIVE IN IPM PROGRAMS
7.7 OTHER ORGANISM TYPE
7.7.1 NEMATODES ARE BEING RESEARCHED ON TO DEVELOP BIOINSECTICIDES
8 BIOINSECTICIDES MARKET, BY CROP TYPE (Page No. - 78)
8.1 INTRODUCTION
8.2 CEREALS & GRAINS
8.2.1 BIOINSECTICIDES REDUCE CHEMICAL APPLICATION ON CEREAL CROPS BOTH DURING CULTIVATION AND STORAGE
8.3 OILSEEDS & PULSES
8.3.1 ADOPTION OF BEAUVERIA BASSIANA AND METARHIZIUM ANISOPLIAE HAS BEEN INCREASING FOR OILSEED CROPS IN CERTAIN REGIONS
8.4 FRUITS & VEGETABLES
8.4.1 ORGANIC FARMING OF HIGH-VALUE CROPS IS GAINING HIGH DEMAND
8.5 OTHER CROP TYPES
8.5.1 INCREASE IN THE TURF GROUNDS HAVE LATELY CREATED A MARKET FOR BIOLOGICAL INPUTS
9 BIOINSECTICIDES MARKET, BY TYPE (Page No. - 85)
9.1 INTRODUCTION
9.2 MACROBIALS
9.2.1 LIMITED SHELF LIFE HINDERS THE GROWTH OF MACROBIALS
9.3 MICROBIALS
9.3.1 TARGET-SPECIFIC ACTION ON CROP-DAMAGING PESTS HAS BEEN A MAJOR ATTRIBUTE FOR MICROBIAL APPLICATION
9.4 OTHER TYPES
9.4.1 COLLECTIVE BENEFITS OF PROTECTION THROUGH PLANT EXTRACTS IS A SIGNIFICANT FACTOR FOR PRODUCT RESEARCH AMONG MANUFACTURERS
10 BIOINSECTICIDES MARKET, BY FORMULATION (Page No. - 90)
10.1 INTRODUCTION
10.2 DRY
10.2.1 DRY FORMULATIONS ARE SUITABLE FOR SOIL OR SEED TREATMENT
10.3 LIQUID
10.3.1 LIQUID FORMULATIONS REDUCE OCCUPATIONAL RISK AND ARE PREFERRED FOR BIOINSECTICIDES THAT ARE HOST-SPECIFIC
11 BIOINSECTICIDES MARKET, BY REGION (Page No. - 94)
11.1 INTRODUCTION
11.2 NORTH AMERICA
11.2.1 US
11.2.1.1 Change in food habits is paving the way for organic products in the US
11.2.2 CANADA
11.2.2.1 Production of greenhouse ornamentals to drive the market in Canada
11.2.3 MEXICO
11.2.3.1 Bacillus and Beauveria species gaining demand among corn and vegetable growers in Mexico
11.3 EUROPE
11.3.1 FRANCE
11.3.1.1 Investment in biological control is driving the market in France
11.3.2 GERMANY
11.3.2.1 Public and private funds aid the growth of the biological segment in Germany
11.3.3 SPAIN
11.3.3.1 A positive trend of bioinsecticide application in controlling pest attacks on crops in Spain
11.3.4 ITALY
11.3.4.1 Ban of toxic pesticides in Italy has paved the way for bioinsecticides
11.3.5 UK
11.3.5.1 Changing consumer preferences is driving the bioinsecticides market
11.3.6 REST OF EUROPE
11.3.6.1 Favorable regulations drive the use of bioinsecticides in Rest of Europe
11.4 ASIA PACIFIC
11.4.1 CHINA
11.4.1.1 Food safety concerns have paved the way for subsidized biological products in China
11.4.2 INDIA
11.4.2.1 To minimize the toxic levels in the food chain, eco-friendly products are on the rise in India
11.4.3 JAPAN
11.4.3.1 Strong IPM involving biologicals has played an important role in the significant production of residue-free food in Japan
11.4.4 AUSTRALIA
11.4.4.1 Investment programs have boosted the introduction of advanced agricultural inputs in Australia
11.4.5 THAILAND
11.4.5.1 Global demand for crops such as rice has driven changes in agricultural policies in Thailand
11.4.6 INDONESIA
11.4.6.1 Adoption of IPM solutions created a strong demand base for pest control in Indonesia
11.4.7 REST OF ASIA PACIFIC
11.4.7.1 Agriculture, being the main source of income, has boosted the demand for innovative agricultural products in Rest of Asia Pacific
11.5 SOUTH AMERICA
11.5.1 BRAZIL
11.5.1.1 The favorable regulatory mechanism is pushing the adoption of biocontrol products in Brazil
11.5.2 ARGENTINA
11.5.2.1 To maintain international export quality of produce in Argentina, the bioinsecticides market is booming
11.5.3 CHILE
11.5.3.1 Technological innovations to aid the control of crop pests in Chile
11.5.4 REST OF SOUTH AMERICA
11.5.4.1 Favorable market opportunities accelerate the growth in Rest of South America
11.6 REST OF THE WORLD
11.6.1 SOUTH AFRICA
11.6.1.1 Economic losses due to pest attack on crops are driving the South African bioinsecticides market
11.6.2 OTHERS IN ROW
11.6.2.1 Export of residue-free agricultural produce is gaining demand
12 COMPETITIVE LANDSCAPE (Page No. - 143)
12.1 OVERVIEW
12.2 COMPANY RANKING
12.3 COMPETITIVE LEADERSHIP MAPPING
12.3.1 VISIONARY LEADERS
12.3.2 INNOVATORS
12.3.3 DYNAMIC DIFFERENTIATORS
12.3.4 EMERGING COMPANIES
12.4 COMPETITIVE SCENARIO
12.4.1 NEW PRODUCT LAUNCHES
12.4.2 EXPANSIONS & INVESTMENTS
12.4.3 ACQUISITIONS
12.4.4 AGREEMENTS & COLLABORATIONS
13 COMPANY PROFILES (Page No. - 151)
(Business overview, Products offered, Recent Developments, SWOT analysis, Right to win)*
13.1 BASF SE
13.2 BAYER AG
13.3 SYNGENTA AG
13.4 MARRONE BIO INNOVATIONS
13.5 NOVOZYMES A/S
13.6 NUFARM
13.7 BIOBEST GROUP NV
13.8 SOM PHYTOPHARMA INDIA LTD
13.9 VALENT BIOSCIENCES LLC
13.10 KILPEST INDIA LTD
13.11 ANDERMATT BIOCONTROL AG
13.12 INTERNATIONAL PANAACEA LTD
13.13 BIOWORKS INC.
13.14 KAN BIOSYS
13.15 FUTURECO BIOSCIENCE S.A.
13.16 BIOSAFE SYSTEMS
13.17 CERTIS USA LLC
13.18 VESTARON CORPORATION
13.19 SDS BIOTECH K.K
13.20 CAMSON BIOTECHNOLOGIES LTD
*Details on Business overview, Products offered, Recent Developments, SWOT analysis, Right to win might not be captured in case of unlisted companies.
14 APPENDIX (Page No. - 186)
14.1 DISCUSSION GUIDE
14.2 KNOWLEDGE STORE: MARKETSANDMARKETS’ SUBSCRIPTION PORTAL
14.3 RELATED REPORTS
14.4 AUTHOR DETAILS
LIST OF TABLES (104 Tables)
TABLE 1 USD EXCHANGE RATES, 2015–2019
TABLE 2 RECENT PATENTS GRANTED WITH RESPECT TO BIOINSECTICIDES
TABLE 3 BIOINSECTICIDES MARKET SIZE, BY MODE OF APPLICATION, 2020–2025 (USD MILLION)
TABLE 4 BIOINSECTICIDE SEED TREATMENT MARKET SIZE, BY REGION, 2018–2025 (USD MILLION)
TABLE 5 BIOINSECTICIDE SOIL TREATMENT MARKET SIZE, BY REGION, 2018–2025 (USD MILLION)
TABLE 6 BIOINSECTICIDE FOLIAR SPRAY MARKET SIZE, BY REGION, 2018–2025 (USD MILLION)
TABLE 7 OTHER MODES OF BIOINSECTICIDE APPLICATION MARKET SIZE, BY REGION, 2018–2025 (USD MILLION)
TABLE 8 BIOINSECTICIDES MARKET SIZE, BY ORGANISM TYPE, 2018–2025 (USD MILLION)
TABLE 9 BACILLUS THURINGIENSIS BIOINSECTICIDE MARKET SIZE, BY REGION, 2018–2025 (USD MILLION)
TABLE 10 BEAUVERIA BASSIANA: BIOINSECTICIDE MARKET SIZE, BY REGION, 2018–2025 (USD MILLION)
TABLE 11 METARHIZIUM ANISOPLIAE: BIOINSECTICIDE MARKET SIZE, BY REGION, 2018–2025 (USD MILLION)
TABLE 12 VERTICILLIUM LECANII BIOINSECTICIDE MARKET SIZE, BY REGION, 2018–2025 (USD MILLION)
TABLE 13 BACULOVIRUS BIOINSECTICIDE MARKET SIZE, BY REGION, 2018–2025 (USD MILLION)
TABLE 14 OTHER BIOINSECTICIDAL ORGANISM TYPES MARKET SIZE, BY REGION, 2018–2025 (USD MILLION)
TABLE 15 BIOINSECTICIDES MARKET SIZE, BY CROP TYPE, 2018–2025 (USD MILLION)
TABLE 16 BIOINSECTICIDES MARKET SIZE IN CEREALS & GRAINS, BY REGION, 2018–2025 (USD MILLION)
TABLE 17 BIOINSECTICIDES MARKET SIZE IN OILSEEDS & PULSES, BY REGION, 2018–2025 (USD MILLION)
TABLE 18 BIOINSECTICIDES MARKET SIZE IN FRUITS & VEGETABLES, BY REGION, 2018–2025 (USD MILLION)
TABLE 19 BIOINSECTICIDES MARKET SIZE IN OTHER CROP TYPES, BY REGION, 2018–2025 (USD MILLION)
TABLE 20 BIOINSECTICIDES MARKET SIZE, BY TYPE, 2018–2025 (USD MILLION)
TABLE 21 BIOINSECTICIDAL MACROBIALS MARKET SIZE, BY REGION, 2018–2025 (USD MILLION)
TABLE 22 BIOINSECTICIDAL MICROBIALS MARKET SIZE, BY REGION, 2018–2025 (USD MILLION)
TABLE 23 OTHER BIOINSECTICIDE TYPES MARKET SIZE, BY REGION, 2018–2025 (USD MILLION)
TABLE 24 BIOINSECTICIDES MARKET SIZE, BY FORMULATION, 2018–2025 (USD MILLION)
TABLE 25 DRY FORMULATION MARKET SIZE, BY REGION, 2018–2025 (USD MILLION)
TABLE 26 LIQUID FORMULATIONS MARKET SIZE, BY REGION, 2018–2025 (USD MILLION)
TABLE 27 BIOINSECTICIDES MARKET SIZE, BY REGION, 2018–2025 (USD MILLION)
TABLE 28 NORTH AMERICA: BIOINSECTICIDES MARKET SIZE, BY COUNTRY, 2018–2025 (USD MILLION)
TABLE 29 NORTH AMERICA: MARKET SIZE, BY MODE OF APPLICATION, 2018–2025 (USD MILLION)
TABLE 30 NORTH AMERICA: MARKET SIZE, BY TYPE, 2018–2025 (USD MILLION)
TABLE 31 NORTH AMERICA: MARKET SIZE, BY CROP TYPE, 2018–2025 (USD MILLION)
TABLE 32 NORTH AMERICA: MARKET SIZE, BY ORGANISM TYPE, 2018–2025 (USD MILLION)
TABLE 33 NORTH AMERICA: MARKET SIZE, BY FORMULATION, 2018–2025 (USD MILLION)
TABLE 34 US: MARKET SIZE, BY ORGANISM TYPE, 2018–2025 (USD MILLION)
TABLE 35 US: MARKET SIZE, BY CROP TYPE, 2018–2025 (USD MILLION)
TABLE 36 CANADA: MARKET SIZE, BY ORGANISM TYPE, 2018–2025 (USD MILLION)
TABLE 37 CANADA: MARKET SIZE, BY CROP TYPE, 2018–2025 (USD MILLION)
TABLE 38 MEXICO: MARKET SIZE, BY ORGANISM TYPE, 2018–2025 (USD MILLION)
TABLE 39 MEXICO: MARKET SIZE, BY CROP TYPE, 2018–2025 (USD MILLION)
TABLE 40 EUROPE: BIOINSECTICIDES MARKET SIZE, BY COUNTRY, 2018–2025 (USD MILLION)
TABLE 41 EUROPE: MARKET SIZE, BY MODE OF APPLICATION, 2018–2025 (USD MILLION)
TABLE 42 EUROPE: MARKET SIZE, BY TYPE, 2018–2025 (USD MILLION)
TABLE 43 EUROPE: MARKET SIZE, BY ORGANISM TYPE, 2018–2025 (USD MILLION)
TABLE 44 EUROPE: MARKET SIZE, BY FORMULATION, 2018–2025 (USD MILLION)
TABLE 45 FRANCE: MARKET SIZE, BY ORGANISM TYPE, 2018–2025 (USD MILLION)
TABLE 46 FRANCE: MARKET SIZE, BY CROP TYPE, 2018–2025 (USD MILLION)
TABLE 47 GERMANY: MARKET SIZE, BY ORGANISM TYPE, 2018–2025 (USD MILLION)
TABLE 48 GERMANY: MARKET SIZE, BY CROP TYPE, 2018–2025 (USD MILLION)
TABLE 49 SPAIN: MARKET SIZE, BY ORGANISM TYPE, 2018–2025 (USD MILLION)
TABLE 50 SPAIN: MARKET SIZE, BY CROP TYPE, 2018–2025 (USD MILLION)
TABLE 51 ITALY: MARKET SIZE, BY ORGANISM TYPE, 2018–2025 (USD MILLION)
TABLE 52 ITALY: MARKET SIZE, BY CROP TYPE, 2018–2025 (USD MILLION)
TABLE 53 UK: MARKET SIZE, BY ORGANISM TYPE, 2018–2025 (USD MILLION)
TABLE 54 UK: MARKET SIZE, BY CROP TYPE, 2018–2025 (USD MILLION)
TABLE 55 REST OF EUROPE: MARKET SIZE, BY ORGANISM TYPE, 2018–2025 (USD MILLION)
TABLE 56 REST OF EUROPE: MARKET SIZE, BY CROP TYPE, 2018–2025 (USD MILLION)
TABLE 57 ASIA PACIFIC: BIOINSECTICIDES MARKET SIZE, BY COUNTRY, 2018–2025 (USD MILLION)
TABLE 58 ASIA PACIFIC: MARKET SIZE, BY MODE OF APPLICATION, 2018–2025 (USD MILLION)
TABLE 59 ASIA PACIFIC: MARKET SIZE, BY TYPE, 2018–2025 (USD MILLION)
TABLE 60 ASIA PACIFIC: MARKET SIZE, BY ORGANISM TYPE, 2018–2025 (USD MILLION)
TABLE 61 ASIA PACIFIC: MARKET SIZE, BY CROP TYPE, 2018–2025 (USD MILLION)
TABLE 62 ASIA PACIFIC: MARKET SIZE, BY FORMULATION, 2018–2025 (USD MILLION)
TABLE 63 CHINA: MARKET SIZE, BY ORGANISM TYPE, 2018–2025 (USD MILLION)
TABLE 64 CHINA: MARKET SIZE, BY CROP TYPE, 2018–2025 (USD MILLION)
TABLE 65 INDIA: MARKET SIZE, BY ORGANISM TYPE, 2018–2025 (USD MILLION)
TABLE 66 INDIA: MARKET SIZE, BY CROP TYPE, 2018–2025 (USD MILLION)
TABLE 67 JAPAN: MARKET SIZE, BY ORGANISM TYPE, 2018–2025 (USD MILLION)
TABLE 68 JAPAN: MARKET SIZE, BY CROP TYPE, 2018–2025 (USD MILLION)
TABLE 69 AUSTRALIA: MARKET SIZE, BY ORGANISM TYPE, 2018–2025 (USD MILLION)
TABLE 70 AUSTRALIA: MARKET SIZE, BY CROP TYPE, 2018–2025 (USD MILLION)
TABLE 71 THAILAND: MARKET SIZE, BY ORGANISM TYPE, 2018–2025 (USD MILLION)
TABLE 72 THAILAND: MARKET SIZE, BY CROP TYPE, 2018–2025 (USD MILLION)
TABLE 73 INDONESIA: MARKET SIZE, BY ORGANISM TYPE, 2018–2025 (USD MILLION)
TABLE 74 INDONESIA: MARKET SIZE, BY CROP TYPE, 2018–2025 (USD MILLION)
TABLE 75 REST OF ASIA PACIFIC: MARKET SIZE, BY ORGANISM TYPE, 2018–2025 (USD MILLION)
TABLE 76 REST OF ASIA PACIFIC: MARKET SIZE, BY CROP TYPE, 2018–2025 (USD MILLION)
TABLE 77 SOUTH AMERICA: BIOINSECTICIDES MARKET SIZE, BY COUNTRY, 2018–2025 (USD MILLION)
TABLE 78 SOUTH AMERICA: MARKET SIZE, BY MODE OF APPLICATION, 2018–2025 (USD MILLION)
TABLE 79 SOUTH AMERICA: MARKET SIZE, BY TYPE, 2018–2025 (USD MILLION)
TABLE 80 SOUTH AMERICA: MARKET SIZE, BY ORGANISM TYPE, 2018–2025 (USD MILLION)
TABLE 81 SOUTH AMERICA: MARKET SIZE, BY FORMULATION, 2018–2025 (USD MILLION)
TABLE 82 SOUTH AMERICA: MARKET SIZE, BY CROP TYPE, 2018–2025 (USD MILLION)
TABLE 83 BRAZIL: MARKET SIZE, BY ORGANISM TYPE, 2018–2025 (USD MILLION)
TABLE 84 BRAZIL: MARKET SIZE, BY CROP TYPE, 2018–2025 (USD MILLION)
TABLE 85 ARGENTINA: BIOINSECTICIDES MARKET SIZE, BY ORGANISM TYPE, 2018–2025 (USD MILLION)
TABLE 86 ARGENTINA: BIOINSECTICIDES MARKET SIZE, BY CROP TYPE, 2018–2025 (USD MILLION)
TABLE 87 CHILE: MARKET SIZE, BY ORGANISM TYPE, 2018–2025 (USD MILLION)
TABLE 88 CHILE: MARKET SIZE, BY CROP TYPE, 2018–2025 (USD MILLION)
TABLE 89 REST OF SOUTH AMERICA: MARKET SIZE, BY ORGANISM TYPE, 2018–2025 (USD MILLION)
TABLE 90 REST OF SOUTH AMERICA: MARKET SIZE, BY CROP TYPE, 2018–2025 (USD MILLION)
TABLE 91 ROW: BIOINSECTICIDES MARKET SIZE, BY COUNTRY, 2018–2025 (USD MILLION)
TABLE 92 ROW: MARKET SIZE, BY MODE OF APPLICATION, 2018–2025 (USD MILLION)
TABLE 93 ROW: MARKET SIZE, BY TYPE, 2018–2025 (USD MILLION)
TABLE 94 ROW: MARKET SIZE, BY ORGANISM TYPE, 2018–2025 (USD MILLION)
TABLE 95 ROW: MARKET SIZE, BY CROP TYPE, 2018–2025 (USD MILLION)
TABLE 96 ROW: MARKET SIZE, BY FORMULATION, 2018–2025 (USD MILLION)
TABLE 97 SOUTH AFRICA: MARKET SIZE, BY ORGANISM TYPE, 2018–2025 (USD MILLION)
TABLE 98 SOUTH AFRICA: MARKET SIZE, BY CROP TYPE, 2018–2025 (USD MILLION)
TABLE 99 OTHERS IN ROW: BIOINSECTICIDES MARKET SIZE, BY ORGANISM TYPE, 2018–2025 (USD MILLION)
TABLE 100 OTHERS IN ROW: BIOINSECTICIDES MARKET SIZE, BY CROP TYPE, 2018–2025 (USD MILLION)
TABLE 101 NEW PRODUCT LAUNCHES, 2018–2020
TABLE 102 EXPANSIONS & INVESTMENTS, 2019–2020
TABLE 103 ACQUISITIONS, 2018–2019
TABLE 104 AGREEMENTS & COLLABORATIONS, 2019–2020
LIST OF FIGURES (47 Figures)
FIGURE 1 BIOINSECTICIDES MARKET SEGMENTATION
FIGURE 2 REGIONAL SEGMENTATION
FIGURE 3 RESEARCH DESIGN: BIOINSECTICIDES MARKET
FIGURE 4 MARKET SIZE ESTIMATION METHODOLOGY: BOTTOM-UP APPROACH
FIGURE 5 MARKET SIZE ESTIMATION METHODOLOGY: TOP-DOWN APPROACH
FIGURE 6 DATA TRIANGULATION METHODOLOGY
FIGURE 7 BIOINSECTICIDES MARKET SIZE, BY ORGANISM TYPE, 2020 VS. 2025 (USD MILLION)
FIGURE 8 LIQUID FORMULATION IS PROJECTED TO DOMINATE BY 2025
FIGURE 9 FRUIT & VEGETABLE CULTIVATION IS ESTIMATED TO DOMINATE THE BIOINSECTICIDES MARKET IN 2020
FIGURE 10 NORTH AMERICA AND EUROPE WERE THE LARGEST MARKETS IN TERMS OF VALUE IN 2019
FIGURE 11 GRADUAL PHASE OUT OF KEY ACTIVE INGREDIENTS TO DRIVE THE GROWTH OF THE BIOINSECTICIDES MARKET
FIGURE 12 MICROBIALS BIOINSECTICIDES WERE PREFERRED IN THE MARKET IN 2019
FIGURE 13 BRAZIL WAS A MAJOR CONSUMER OF BIOINSECTICIDES IN THE SOUTH AMERICAN REGION IN 2019
FIGURE 14 NORTH AMERICA ACCOUNTED FOR THE LARGEST MARKET SHARE FOR BACILLUS THURINGIENSIS IN 2019
FIGURE 15 THE US ACCOUNTED FOR THE LARGEST MARKET SHARE IN 2019
FIGURE 16 GLOBAL ORGANIC AGRICULTURE SHARE, BY REGION, 2017
FIGURE 17 ORGANIC FARM AREA GROWTH TREND, 2015–2017
FIGURE 18 HIGH COSTS IN THE DEVELOPMENT OF SYNTHETIC CROP PROTECTION PRODUCTS TO DRIVE THE GROWTH OF THE MARKET
FIGURE 19 GLOBAL ORGANIC AREA FARMLAND, 2007–2018 (‘000 HA)
FIGURE 20 REDUCED INTRODUCTION OF NEW ACTIVE INGREDIENTS
FIGURE 21 PESTICIDE USAGE IN AGRICULTURE, BY REGION, 2015–2017 (TONNE)
FIGURE 22 SUPPLY CHAIN ANALYSIS
FIGURE 23 VALUE CHAIN ANALYSIS
FIGURE 24 BIOINSECTICIDE PATENTS, 2013–2020
FIGURE 25 BIOINSECTICIDES MARKET PATENT ANALYSIS, BY REGION, 2013–2020
FIGURE 26 BIOINSECTICIDES MARKET SIZE, BY MODE OF APPLICATION, 2020 VS. 2025 (USD MILLION)
FIGURE 27 MARKET SIZE, BY ORGANISM TYPE, 2020 VS. 2025 (USD MILLION)
FIGURE 28 MARKET SIZE, BY CROP TYPE, 2020 VS. 2025 (USD MILLION)
FIGURE 29 MARKET SIZE, BY TYPE, 2020 VS. 2025 (USD MILLION)
FIGURE 30 MARKET SIZE, BY FORMULATION, 2020 VS. 2025 (USD MILLION)
FIGURE 31 CHILE TO BE THE MOST ATTRACTIVE MARKET FOR BIOINSECTICIDE MANUFACTURERS (2018–2025)
FIGURE 32 NORTH AMERICA: BIOINSECTICIDES MARKET SNAPSHOT
FIGURE 33 SOUTH AMERICA: BIOINSECTICIDES MARKET SNAPSHOT
FIGURE 34 KEY DEVELOPMENTS OF THE LEADING PLAYERS IN THE BIOINSECTICIDES MARKET, 2016–2020
FIGURE 35 BIOINSECTICIDES MARKET COMPANY RANKINGS, 2019
FIGURE 36 BIOINSECTICIDES MARKET: COMPETITIVE LEADERSHIP MAPPING, 2019
FIGURE 37 BASF SE: COMPANY SNAPSHOT
FIGURE 38 BASF SE: SWOT ANALYSIS
FIGURE 39 BAYER AG: COMPANY SNAPSHOT
FIGURE 40 BAYER AG: SWOT ANALYSIS
FIGURE 41 SYNGENTA AG: COMPANY SNAPSHOT
FIGURE 42 SYNGENTA AG: SWOT ANALYSIS
FIGURE 43 MARRONE BIO INNOVATIONS: COMPANY SNAPSHOT
FIGURE 44 MARRONE BIO INNOVATIONS: SWOT ANALYSIS
FIGURE 45 NOVOZYMES A/S: COMPANY SNAPSHOT
FIGURE 46 NOVOZYMES A/S: SWOT ANALYSIS
FIGURE 47 NUFARM: COMPANY SNAPSHOT
The study involves the growth of the bioinsecticides market. Exhaustive secondary research was done to collect information on the market, peer market, and parent market. These findings, assumptions, and market sizes were validated with industry experts across the value chain through primary research. Both the top-down and bottom-up approaches were employed to estimate the complete market size. After that, the market breakdown and data triangulation approaches were used to estimate the market size of segments and subsegments.
Secondary Research
In the secondary research process, various secondary sources, such as Hoovers, Bloomberg BusinessWeek, and Dun & Bradstreet, were referred to identify and collect information for this study. These secondary sources included annual reports, press releases & investor presentations of companies, white papers, certified publications, articles by recognized authors, gold standard & silver standard websites, food safety organizations, regulatory bodies, trade directories, and databases.
Primary Research
The bioinsecticides market comprises several stakeholders in the supply chain, which include suppliers, manufacturers, and end-use product manufacturers. Various primary sources from both supply and demand sides of both markets have been interviewed to obtain qualitative and quantitative information. The primary interviewees from the demand side include key opinion leaders, executives, vice presidents, and CEOs of companies manufacturing biologicals. The primary sources from the supply-side include research institutions involved in R&D, key opinion leaders, and manufacturing companies.
To know about the assumptions considered for the study, download the pdf brochure
Market Size Estimation
The biopesticides market was considered as a parent market for arriving at the global market value for different child market segments in this report. The key trends of the bioinsecticides industries have been identified and studied in this report. The top-down approach has been used extensively to estimate the size of various dependent submarkets. The research methodology used to estimate the market size includes the following:
- The key players have been identified through extensive secondary research.
- All percentage shares have been determined using secondary sources and verified through primary sources.
- All the possible parameters that affect the markets covered in this research study have been accounted for, viewed in extensive detail, verified through primary research, and analyzed to obtain the final quantitative and qualitative data at a regional level.
- The research included the study of the reports, reviews, and newsletters of top market players along with extensive interviews for opinions from leaders such as CEOs, directors, and marketing executives.
Data Triangulation
In order to evaluate the overall bioinsecticides market and arrive at the exact statistics for all segments and subsegments, the data triangulation and market breakdown procedures have been employed, wherever applicable. The data has been triangulated by studying various factors and trends from both the demand and supply sides.
Report Objectives
- To describe, segment, and project the global market size for the bioinsecticides market
- To offer detailed information about the key factors influencing the growth of the market (drivers, restraints, opportunities, and industry-specific challenges)
- To evaluate the micro-markets, concerning individual growth trends, prospects, and their contribution to the total bioinsecticides market
- To propose the size of the submarkets, in terms of value, for various regions
- To profile the major players and comprehensively analyze their core competencies
- To understand the competitive landscape and identify the major growth strategies adopted by the players across key regions
- To analyze the competitive developments such as expansions & investments, mergers & acquisitions, new product launches, partnerships, joint ventures, and agreements
Available Customizations
With the given market data, MarketsandMarkets offers customizations according to company-specific scientific needs.
The following customization options are available for the bioinsecticides market report:
Product Analysis
- Product matrix, which gives a detailed comparison of the product portfolio of each company
Company Information
- Detailed analysis and profiling of additional market players (up to five)


Growth opportunities and latent adjacency in Bioinsecticides Market