Bionematicides Market by Type (Microbials & Biochemicals), Crop Type (Cereals & Grains, Oilseeds & Pulses, and Fruits & Vegetables), Form (Liquid and Dry), Mode of Application, Infestation, & by Region - Global Forecast to 2021


The bionematicides market, in terms of value, is projected to reach around USD 337.2 Million by 2021, at a CAGR of 17.4% from 2016 to 2021. The bionematicides market is segmented on the basis of type, form, crop type, application, infestation, and region. The objective of the study is to provide detailed information about the key factors influencing the growth of the market which include drivers, restraints, opportunities, and industry-specific challenges, strategically profile key players and comprehensively analyze their market share and core competencies, moreover, project the size of the market and its submarkets, in terms of value and volume, with respect to five regions along with their respective key countries, such as North America, Europe, Asia-Pacific, South America, and the Rest of the World (RoW). The years considered for the study are as follows:
- Base year � 2015
- Estimated year � 2016
- Projected year � 2021
- Forecast period � 2016 to 2021
This report includes estimation of market sizes for value (USD million) and volume (tons). Both top-down and bottom-up approaches have been used to estimate and validate the market size for bionematicides and various other dependent submarkets in the overall market. Key players in the market have been identified through secondary research, and their market share in their respective regions has been determined through primary and secondary research. All percentage shares, splits, and breakdowns have been determined using secondary sources and were verified through primary sources.
To know about the assumptions considered for the study, download the pdf brochure
Bionematicide are attracting greater interest as core options in crop protection programs. The raw materials required for the production of bionematicide are easily available. The manufacturing cost of bionematicide is low and hence, they are gaining more presence. Consumer preferences and requirements are largely taken into consideration. It must be ensured that the bionematicide product reaches the consumer whenever there is actual requirement. As these are used to control nematodes, their timely availability is important for the crop protection. Therefore, more value addition is needed at the wholesaler/retailer end.
Target Audience:
- Suppliers
- R&D institutes
- Technology providers
- pesticides manufacturers/suppliers
- Intermediary suppliers
- Wholesalers
- Dealers
- Consumers
- End users
- Retailers
�The study answers several questions for stakeholders, primarily which market segments to focus on in the next two to five years for prioritizing efforts and investments.�
Scope of the Report
This research report categorizes the market for bionematicides based on product, application, and region.
Based on Type, the bionematicides market has been segmented as follows:
- Microbials
- Biochemical
Based on Form, the bionematicides market has been segmented as follows:
- Dry
- Liquid
Based on Crop Type, the bionematicides market has been segmented as follows:
- Cereals & grains
- Oilseeds & pulses
- Fruits & vegetables
- Rest of crops (sugarbeet, cotton, and others)
Based on Mode of Application, the bionematicides market has been segmented as follows:
- Seed treatment
- Soil treatment
- Foliar sprays
- Others
Based on Infestation, the bionematicides market has been segmented as follows:
- Root knot
- Cyst nematodes
- Lesion nematodes
- Others
Based on Region, the bionematicides market has been segmented as follows:
- North America
- Europe
- Asia-Pacific
- Rest of the World (RoW)
- Available Customizations
With the given market data, MarketsandMarkets offers customizations according to client-specific scientific needs.
The following customization options are available for the report:
Product Analysis
- Product matrix, which gives a detailed comparison of the product portfolio of each company
Company Information
- Detailed analysis and profiling of additional market players (up to five)
The global bionematicides market has grown steadily in the last few years. The market size is projected to reach USD 337.2 Million by 2021, at a CAGR of around 17.4% from 2016 to 2021. Sustainability environmental initiatives along with the adoption of biologicals, the increasing growth of the biological control seed treatment solutions, and the utilization of integrated pest management techniques are some of the major driving factors for this market.
The bionematicides market based on crop type is segmented into cereals & grains, oilseeds & pulses, fruits & vegetables, and rest crops. Therest crops segment includes sugarbeet, cotton, and others. Fruits & vegetables accounted for the largest market in the bionematicides market in 2015. The demand for organic fruits & vegetables is increasing worldwide and this has led to the demand for biopesticides which holds a positive market outlook for bionematicides.
The bionematicides market, based on mode of application, is segmented into seed treatment, soil treatment, foliar sprays, and other applications. Soil treatment mode of application accounted for the largest share in the bionematicides market. The soil treatment mode of application promotes seed germination, enables faster plant growth, provides more efficient use of moisture and nutrients thus improving crop yields which is one of the factors driving the growth of soil treatment application.
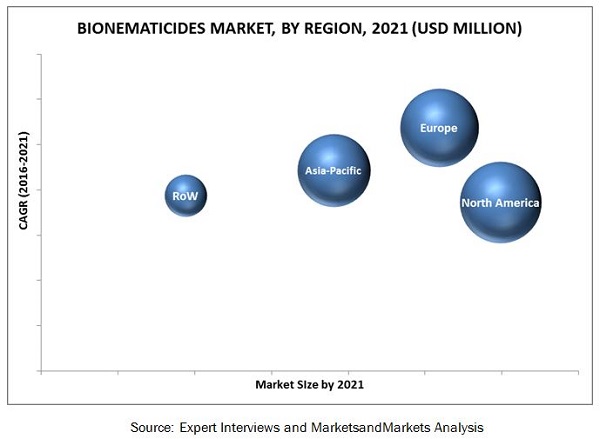
The bionematicides market in Europe is projected to grow at the highest CAGR during the forecast period. this region has large agricultural lands which produce fruits & vegetables on a large scale. Furthermore, the demand for organic products is increasing in the region which gives a market scope for the growth of the market.
Slow speed of action on large pests and low shelf life along with barriers in the adoption of bionematicides are the restraints of this product. Microbial bionematicide have a relatively low shelf life and cannot be stored for long time as compared to chemical pesticides which acts as a limitation in the growth of the market.
The bionematicides market is characterized by low competition due to low product differentiation and high adoption barriers. New product launches, Expansions, and mergers & acquisitions are the key strategies adopted by these players to ensure their growth in the market. The market is dominated by players such as Syngenta AG (Switzerland), Bayer CropScience AG (Germany), Marrone Bio Innovations, Inc. (U.S.), T. Stanes & Company Limited (India), and Valent BioSciences Corporation (U.S.).
To speak to our analyst for a discussion on the above findings, click Speak to Analyst
 Exclusive indicates content/data unique to MarketsandMarkets and not available with any competitors.
Table of Contents
1 Introduction (Page No. - 15)
1.1 Objectives of the Study
1.2 Market Definition
1.3 Study Scope
1.3.1 Markets Covered
1.3.2 Periodization Considered
1.4 Currency
1.5 Units
1.6 Stakeholders
2 Research Methodology (Page No. - 18)
2.1 Research Data
2.1.1 Secondary Data
2.1.1.1 Key Data From Secondary Sources
2.1.2 Primary Data
2.1.2.1 Key Data From Primary Sources
2.1.2.2 Key Industry Insights
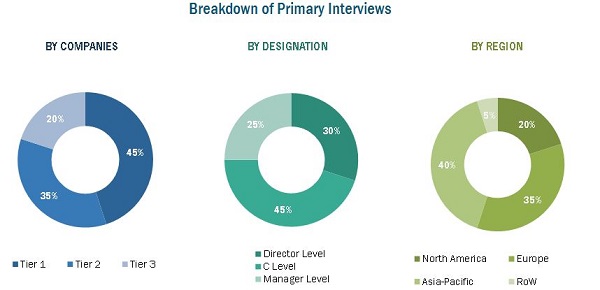
2.1.2.2.1 Breakdown of Primaries
2.2 Market Size Estimation
2.3 Market Breakdown & Data Triangulation
2.4 Research Assumptions and Limitations
2.4.1 Assumptions
2.4.2 Limitations
3 Executive Summary (Page No. - 26)
4 Premium Insights (Page No. - 32)
4.1 Opportunities in Bionematicides Market
4.2 Key Bionematicides Market Between 2016 & 2021
4.3 Life Cycle Analysis: Bionematicides Market, By Region
4.4 Bionematicides Market, By Type, 2016 vs 2021
4.5 Europe: Bionematicides Market, By Mode of Application & Country
4.6 Bionematicides Market Size, By Crop Type
4.7 Bionematicides Market, By Infestation & Region
4.8 Bionematicides Market, By Form
5 Market Overview (Page No. - 39)
5.1 Introduction
5.2 Macro Indicators
5.2.1 Need for Sustainable Agriculture to Support Growing Population
5.2.2 Rapid Urbanization Leading to A Reduction in Per Capita Arable Land
5.2.3 Gross Domestic Product (GDP) - Agriculture and Allied Services
5.2.4 Foreign Direct Investments (FDI)
5.3 Market Segmentation
5.3.1 Bionematicides Market, By Type
5.3.2 Bionematicides Market, By Infestation
5.3.3 Bionematicides Market, By Crop Type
5.3.4 Bionematicides Market, By Mode of Application
5.3.5 Bionematicides Market, By Form
5.3.6 Bionematicides Market, By Region
5.4 Market Dynamics
5.4.1 Drivers
5.4.1.1 High Level of Crop Infestation By Nematodes
5.4.1.2 Rapid Growth in Biocontrol Seed Treatment Solutions
5.4.1.3 Phasing Out of Chemical Fumigant Nematicides Due to Environmental Concerns
5.4.1.4 Sustainability Initiatives and Increased Adoption of Agricultural Biological Products
5.4.1.5 Integrated Pest Management Techniques
5.4.2 Restraints
5.4.2.1 Slow Speed of Action on Target Pests and Low Shelf Life
5.4.2.2 Barriers in Adoption of Bionematicides
5.4.3 Opportunities
5.4.3.1 Stringent Environmental Regulations Against Chemical/Traditional Nematicides
5.4.3.2 Constant R&D Activities, Product Launches, and Developments
5.4.3.3 Use of Plant-Based Nematicides in Organic Agriculture and Horticulture
5.4.4 Challenges
5.4.4.1 Requires New Skill and Understanding Nematode Infestation
6 Industry Trends (Page No. - 54)
6.1 Introduction
6.2 Supply Chain Analysis
6.2.1 Prominent Companies
6.2.2 Small & Medium Enterprises
6.2.3 End Users
6.3 Value Chain Analysis
6.4 Porter�s Five Forces Analysis
6.4.1 Intensity of Competitive Rivalry
6.4.2 Threat of New Entrants
6.4.3 Threat of Substitutes
6.4.4 Bargaining Power of Suppliers
6.4.5 Bargaining Power of Buyers
6.5 Global Regulatory Environment
6.5.1 North America
6.5.1.1 U.S.
6.5.2 Europe
6.5.2.1 France
6.5.2.2 U.K.
6.5.2.3 Russia
6.5.3 Asia-Pacific
6.5.3.1 India
6.5.3.2 China
6.5.4 RoW
6.5.4.1 Brazil
7 Bionematicides Market, By Type (Page No. - 63)
7.1 Introduction
7.2 Microbials
7.2.1 Paecilomyces Lilacinus
7.2.2 Bacillus Firmus
7.3 Biochemicals
8 Bionematicides Market, By Infestation (Page No. - 68)
8.1 Introduction
8.2 Root-Knot Nematodes
8.3 Cyst Nematodes
8.4 Lesion Nematodes
8.5 Others
9 Bionematicides Market, By Crop Type (Page No. - 74)
9.1 Introduction
9.2 Cereals & Grains
9.3 Oilseeds & Pulses
9.3.1 Rapeseed
9.3.2 Chickpeas
9.3.3 Others
9.4 Fruits & Vegetables
9.4.1 Potato
9.4.2 Banana
9.4.3 Others
9.5 Rest of the Crops
9.5.1 Cotton
9.5.2 Sugar Beet
9.5.3 Others
10 Bionematicides Market, By Mode of Application (Page No. - 86)
10.1 Introduction
10.2 Seed Treatment
10.3 Soil Treatment
10.4 Foliar Spray
10.5 Others
11 Bionematicides Market, By Form (Page No. - 92)
11.1 Introduction
11.2 Liquid Bionematicides
11.3 Dry Bionematicides
12 Bionematicides Market, By Region (Page No. - 97)
12.1 Introduction
12.2 North America
12.2.1 U.S.
12.2.2 Canada
12.2.3 Mexico
12.3 Europe
12.3.1 Germany
12.3.2 Spain
12.3.3 France
12.3.4 Italy
12.3.5 U.K.
12.3.6 Rest of Europe
12.4 Asia-Pacific
12.4.1 China
12.4.2 India
12.4.3 Japan
12.4.4 Australia
12.4.5 Rest of Asia-Pacific
12.5 Rest of the World (RoW)
12.5.1 Brazil
12.5.2 Argentina
12.5.3 South Africa
12.5.4 Others in RoW
13 Competitive Landscape (Page No. - 131)
13.1 Overview
13.2 Competitive Situation & Trends
13.2.1 Agreements
13.2.2 Acquisitions
13.2.3 Expansions
13.2.4 New Product Launches
13.2.5 Investments & Partnerships
14 Company Profiles (Page No. - 138)
14.1 Introduction
(Business overview, Products offered, Recent Developments, SWOT analysis, MNM view)*
14.2 Syngenta AG
14.3 Bayer Cropscience AG
14.4 Marrone Bio Innovations Inc.
14.5 T. Stanes & Company Limited
14.6 Valent Biosciences Corporation
14.7 Certis Usa L.L.C.
14.8 Agri Life
14.9 Bio Huma Netics, Inc.
14.10 The Real IPM Company Ltd.
14.11 Horizon Agrotech
*Details on Business overview, Products offered, Recent Developments, SWOT analysis, MNM view might not be captured in case of unlisted companies.
15 Appendix (Page No. - 159)
15.1 Insights of Industry Experts
15.2 Discussion Guide
15.3 Knowledge Store: Marketsandmarkets� Subscription Portal
15.4 Recent Developments
15.4.1 New Product Launches
15.4.2 Agreements
15.4.3 Acquisitions
15.4.4 Expansions
15.4.5 Investment & Partnership
15.5 Introducing RT: Real-Time Market Intelligence
15.6 Available Customizations
15.7 Related Reports
List of Tables (90 Tables)
Table 1 Agricultural GDP of Top 10 Countries of the World, 2015
Table 2 Bionematicides Market Size, By Type, 2014-2021 (USD Million)
Table 3 Bionematicides Market Size, By Type, 2014-2021 (KT)
Table 4 Microbial Bionematicides Market Size, By Subtype, 2014-2021 (USD Million)
Table 5 Microbial Bionematicides Market Size, By Subtype, 2014-2021 (KT)
Table 6 Bionematicides Market Size, By Infestation, 2014�2021 (USD Million)
Table 7 Root-Knot Nematodes Market Size, By Region, 2014�2021 (USD Million)
Table 8 Cyst Nematodes Market Size, By Region, 2014�2021 (USD Million)
Table 9 Lesion Nematodes Market Size, By Region, 2014�2021 (USD Million)
Table 10 Other Nematodes Market Size, By Region, 2014�2021 (USD Million)
Table 11 List of Nematodes & Their Common Host Crops
Table 12 Bionematicides Market Size, By Crop Type, 2014�2021 (USD Million)
Table 13 Bionematicides in Cereals & Grains Market Size, By Region, 2014�2021 (USD Million)
Table 14 Bionematicides in Cereals & Grains Market Size, By Sub-Type, 2014�2021 (USD Million)
Table 15 Bionematicides in Oilseeds & Pulses Market Size, By Region, 2014�2021 (USD Million)
Table 16 Bionematicides in Oilseeds & Pulses Market Size, By Sub-Type, 2014�2021 (USD Million)
Table 17 Bionematicides in Fruits & Vegetables Market Size, By Region, 2014�2021 (USD Million)
Table 18 Bionematicides in Fruits & Vegetables Market Size, By Sub-Type, 2014�2021 (USD Million)
Table 19 Bionematicides in Rest of Crops Market Size, By Region, 2014�2021 (USD Million)
Table 20 Bionematicides in Rest of the Crops Market Size, By Sub-Type, 2014�2021 (USD Million)
Table 21 Bionematicides Market Size, By Mode of Application, 2014�2021 (USD Million)
Table 22 Seed Treatment Market Size, By Region, 2014�2021 (USD Million)
Table 23 Soil Treatment Market Size, By Region, 2014�2021 (USD Million)
Table 24 Foliar Spray Market Size, By Region, 2014�2021 (USD Million)
Table 25 Others Market Size, By Region, 2014�2021 (USD Million)
Table 26 Bionematicides Market Size, By Form, 2014-2021 (USD Million)
Table 27 Liquid Bionematicides Market Size, By Region, 2014-2021 (USD Million)
Table 28 Dry Bionematicides Market Size, By Region, 2014-2021 (USD Million)
Table 29 Bionematicides Market Size, By Region, 2014-2021 (USD Million)
Table 30 Bionematicides Market Size, By Region, 2014-2021 (KT)
Table 31 North America: Bionematicides Market Size, By Country, 2014-2021 (USD Million)
Table 32 North America: Bionematicides Market Size, By Country, 2014-2021 (KT)
Table 33 North America: Bionematicides Market Size, By Type, 2014-2021 (USD Million)
Table 34 North America: Bionematicides Market Size, By Type, 2014-2021 (KT)
Table 35 U.S.: Bionematicides Market Size, By Type, 2014-2021 (USD Million)
Table 36 U.S.: Bionematicides Market Size, By Type, 2014-2021 (KT)
Table 37 Canada: Bionematicides Market Size, By Type, 2014-2021 (USD Million)
Table 38 Canada: Bionematicides Market Size, By Type, 2014-2021 (KT)
Table 39 Mexico: Bionematicides Market Size, By Type, 2014-2021 (USD Million)
Table 40 Mexico: Bionematicides Market Size, By Type, 2014-2021 (KT)
Table 41 Europe: Bionematicides Market Size, By Country, 2014-2021 (USD Million)
Table 42 Europe: Bionematicides Market Size, By Country, 2014-2021 (KT)
Table 43 Germany: Bionematicides Market Size, By Type, 2014-2021 (USD Million)
Table 44 Germany: Bionematicides Market Size, By Type, 2014-2021 (KT)
Table 45 Spain: Bionematicides Market Size, By Type, 2014-2021 (USD Million)
Table 46 Spain: Bionematicides Market Size, By Type, 2014-2021 (KT)
Table 47 France: Bionematicides Market Size, By Type, 2014-2021 (USD Million)
Table 48 France: Bionematicides Market Size, By Type, 2014-2021 (KT)
Table 49 Italy: Bionematicides Market Size, By Type, 2014-2021 (USD Million)
Table 50 Italy: Bionematicides Market Size, By Type, 2014-2021 (KT)
Table 51 U.K.: Bionematicides Market Size, By Type, 2014-2021 (USD Million)
Table 52 U.K.: Bionematicides Market Size, By Type, 2014-2021 (KT)
Table 53 Rest of Europe: Bionematicides Market Size, By Type, 2014-2021 (USD Million)
Table 54 Rest of Europe: Bionematicides Market Size, By Type, 2014-2021 (KT)
Table 55 Asia-Pacific: Bionematicides Market Size, By Country, 2014-2021 (USD Million)
Table 56 Asia-Pacific: Bionematicides Market Size, By Country, 2014-2021 (KT)
Table 57 Asia-Pacific: Bionematicides Market Size, By Type, 2014-2021 (USD Million)
Table 58 Asia-Pacific: Bionematicides Market Size, By Type, 2014-2021 (KT)
Table 59 China: Bionematicides Market Size, By Type, 2014-2021 (USD Million)
Table 60 China: Bionematicides Market Size, By Type, 2014-2021 (KT)
Table 61 India: Bionematicides Market Size, By Type, 2014-2021 (USD Million)
Table 62 India: Bionematicides Market Size, By Type, 2014-2021 (KT)
Table 63 Japan: Bionematicides Market Size, By Type, 2014-2021 (USD Million)
Table 64 Japan: Bionematicides Market Size, By Type, 2014-2021 (KT)
Table 65 Australia: Bionematicides Market Size, By Type, 2014-2021 (USD Million)
Table 66 Australia: Bionematicides Market Size, By Type, 2014-2021 (KT)
Table 67 Rest of Asia-Pacific: Bionematicides Market Size, By Type, 2014-2021 (USD Million)
Table 68 Rest of Asia-Pacific: Bionematicides Market Size, By Type, 2014-2021 (KT)
Table 69 RoW: Bionematicides Market Size, By Country, 2014-2021 (USD Million)
Table 70 RoW: Bionematicides Market Size, By Country, 2014-2021 (KT)
Table 71 RoW: Bionematicides Market Size, By Type, 2014-2021 (USD Million)
Table 72 RoW: Bionematicides Market Size, By Type, 2014-2021 (KT)
Table 73 Brazil: Bionematicides Market Size, By Type, 2014-2021 (USD Million)
Table 74 Brazil: Bionematicides Market Size, By Type, 2014-2021 (KT)
Table 75 Argentina: Bionematicides Market Size, By Type, 2014-2021 (USD Million)
Table 76 Argentina: Bionematicides Market Size, By Type, 2014-2021 (KT)
Table 77 South Africa: Bionematicides Market Size, By Type, 2014-2021 (USD Million)
Table 78 South Africa: Bionematicides Market Size, By Type, 2014-2021 (KT)
Table 79 Others in RoW: Bionematicides Market Size, By Type, 2014-2021 (USD Million)
Table 80 Others in RoW: Bionematicides Market Size, By Type, 2014-2021 (KT)
Table 81 Agreements, 2010�2015
Table 82 Acquisitions, 2010�2015
Table 83 Expansions, 2010�2015
Table 84 New Product Launches, 2010�2015
Table 85 Investments & Partnerships, 2010�2015
Table 86 New Product Launches
Table 87 Agreements
Table 88 Acquisitions
Table 89 Expansions
Table 90 Investment & Partnership
List of Figures (64 Figures)
Figure 1 Bionematicides Market Segmentation
Figure 2 Bionematicide: Research Design
Figure 3 Market Size Estimation Methodology: Bottom-Up Approach
Figure 4 Market Size Estimation Methodology: Top-Down Approach
Figure 5 Data Triangulation Methodology
Figure 6 Bionematicides Market Snapshot, By Type, 2016 vs 2021 (USD Million)
Figure 7 Bionematicides Market Size, By Infestation, 2016 vs 2021 (USD Million)
Figure 8 Bionematicides Market Size, By Crop Type, 2016 vs 2021 (USD Million)
Figure 9 Bionematicides Market Size, By Mode of Application, 2016 vs 2021
Figure 10 Bionematicides Market Size, By Form, 2016 vs 2021 (USD Million)
Figure 11 Bionematicides Market Ranking, By Region, 2016�2021 (USD Million)
Figure 12 Bionematicides Market Share (Value), By Region, 2015
Figure 13 Trend in Bionematicides Market, 2016-2021 (USD Million)
Figure 14 Europe & Asia-Pacific Poised for High Growth From 2016 to 2021
Figure 15 Europe Market Poised for Robust Growth, 2016 to 2021
Figure 16 The Market for Microbial-Based Bionematicides is Projected to Record High Growth Between 2016 & 2021
Figure 17 Soil Treatment Application Segment Dominated the European Market in 2015
Figure 18 Cereals & Grains Segment is Projected to Grow at the Highest CAGR From 2016 to 2021
Figure 19 Root-Knot Segment Poised for Significant Growth in Bionematicides Market, 2016�2021
Figure 20 Liquid Form Segment Poised for Significant Market Share in the Bionematicides Market, 2016�2021
Figure 21 Population Growth Trend, 1950�2050
Figure 22 Global Arable Land Per Person, 2008�2012 (Hectares)
Figure 23 Global Per Capita GDP, 2008�2014 (Current USD)
Figure 24 Bionematicides Market, By Type
Figure 25 Bionematicides Market, By Infestation
Figure 26 Bionematicides Market, By Crop Type
Figure 27 Bionematicides Market, By Mode of Application
Figure 28 Bionematicides Market, By Form
Figure 29 Bionematicides Market, By Region
Figure 30 High Level of Crop Infestation By Nematodes Drives the Bionematicides Market
Figure 31 Multi-Model Distribution System: Integral Part of Supply Chain of Bionematicides Market
Figure 32 Manufacturing of Bionematicide Contribute Major Value to Overall Price of Bionematicide
Figure 33 Porter�s Five Forces Analysis: Bionematicides Market
Figure 34 Microbials Segment to Dominate the Bionematicides Market in 2016 (USD Million)
Figure 35 Paecilomyces Lilacinus Segment to Witness the Fastest Growth From 2016 to 2021 (USD Million)
Figure 36 Root-Knot Nematodes to Witness the Largest Share in the Bionematicides Market By 2021 (USD Million)
Figure 37 The Fruit & Vegetables Segment to Lead the Bionematicides Market in 2016 (USD Million)
Figure 38 Wheat Dominated the Cereals & Grains Segment in the Bionematicides Market in 2016 (USD Million)
Figure 39 Rapeseed to Lead the Oilseeds & Pulses Segment in Bionematicides Market in 2016 (USD Million)
Figure 40 Potato to Lead the Fruits & Vegetables Segment in Bionematicides Market in 2016 (USD Million)
Figure 41 Cotton to Lead the Rest of the Crops Segment in the Bionematicides Market in 2016 (USD Million)
Figure 42 Soil Treatment Mode of Application to Dominate the Bionematicides Market By 2021 (USD Million)
Figure 43 Liquid Form to Dominate the Bionematicides Market By 2021 (USD Million)
Figure 44 Europe is Expected to Witness the Fastest Growth in the Global Bionematicides Market, Between 2016 and 2021
Figure 45 North America is Expected to Dominate the Global Bionematicides Market By 2021 (USD Million)
Figure 46 U.S. to Lead the North American Bionematicides Market By 2021
Figure 47 U.S. to Witness the Fastest Growth in the North American Bionematicides Market By 2021
Figure 48 Germany to Lead the European Bionematicides Market By 2021
Figure 49 Germany to Dominate the Market for Bionematicides in Europe By 2021
Figure 50 China Led the Market for Bionematicides in Asia-Pacific in 2015 (USD Million)
Figure 51 China to Be the Market Leader for Bionematicides in Asia-Pacific From 2016 to 2021 (USD Million)
Figure 52 South Africa is Expected to Witness Fastest Growth in the Bionematicides Market By 2021
Figure 53 Agreements: the Most Preferred Approach of Key Companies, 2010�2015
Figure 54 Expanding Revenue Base Through Agreements, 2014�2015
Figure 55 Agreements Was the Key Strategy Adopted By Companies in the Bionematicides Market, 2010�2015
Figure 56 Syngenta AG: Company Snapshot
Figure 57 Syngenta AG: SWOT Analysis
Figure 58 Bayer Cropscience AG: Company Snapshot
Figure 59 Bayer Cropscience AG: SWOT Analysis
Figure 60 Marrone Bio Innovations Inc.: Company Snapshot
Figure 61 Marrone Bio Innovations Inc.: SWOT Analysis
Figure 62 T. Stanes & Company Limited: Company Snapshot
Figure 63 T. Stanes & Company Limited: SWOT Analysis
Figure 64 Valent Biosciences Corporation: SWOT Analysis


Growth opportunities and latent adjacency in Bionematicides Market