2
RESEARCH METHODOLOGY
42
5
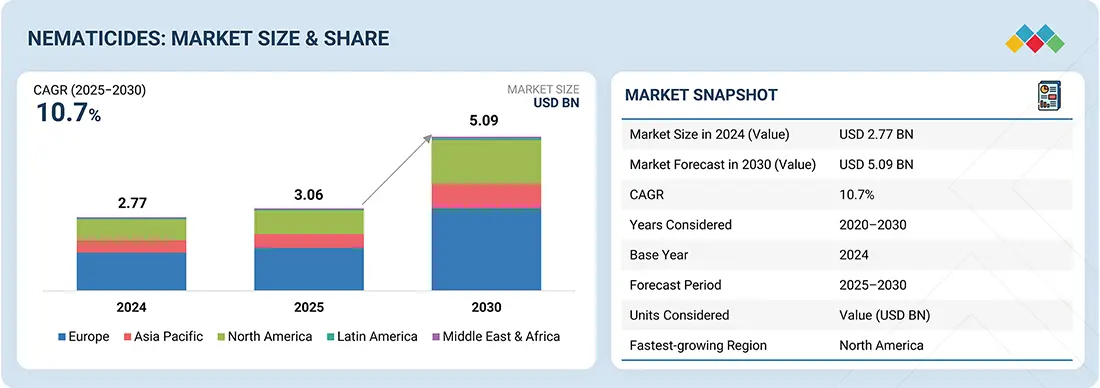
MARKET OVERVIEW
AI-driven innovations transform nematicide market, enhancing crop protection and reducing economic losses.
65
5.2
MACROECONOMIC INDICATORS
5.2.1
ADOPTION OF PESTICIDES FOR DEFENSE AGAINST PEST ATTACKS
5.2.2
FOREIGN DIRECT INVESTMENTS
5.3
GLOBAL CROP LOSSES DUE TO NEMATODES
5.4.1.1
Strong demand for high-value crops
5.4.1.2
Rising demand for low-cost crop protection solutions
5.4.1.3
Increasing damage to crop production due to nematode infestations
5.4.1.4
Integration of nematicides with modern farming practices
5.4.1.5
Advancements in biological nematicides
5.4.2.1
Technological limitations in using biological products
5.4.2.2
Stringent government regulations
5.4.3.1
Use of plant-based nematicides in organic agriculture and horticulture
5.4.3.2
Resistance to crop protection chemicals
5.4.3.3
Rising demand for biological solutions
5.4.4.1
Expanding adoption of GM crops to reduce dependence on conventional crop protection chemicals
5.4.4.2
Lack of awareness and low utilization of biologicals
5.4.4.3
Inconsistent field performance
5.5
IMPACT OF AI/GEN AI ON NEMATICIDES MARKET
5.5.2
USE OF GEN AI IN NEMATICIDES MARKET
5.5.3
CASE STUDY ANALYSIS
5.5.3.1
Revolutionizing nematode management: Syngenta’s satellite-powered precision tool
5.5.3.2
Agmatix and BASF partnered to develop AI-powered detection of soybean cyst nematode
6
INDUSTRY TRENDS
Explore tariff impacts reshaping nematicide prices and technology trends across global markets.
79
6.2
IMPACT OF 2025 US TARIFF – NEMATICIDES MARKET
6.2.3
PRICE IMPACT ANALYSIS
6.2.4
IMPACT ON COUNTRY/REGION
6.2.5
IMPACT ON END-USE INDUSTRIES
6.3.1
RESEARCH & DEVELOPMENT
6.4.1
EXPORT SCENARIO OF HS CODE 3808
6.4.2
IMPORT SCENARIO OF HS CODE 3808
6.5.1.1
RNAi-based nematicides
6.5.2
COMPLEMENTARY TECHNOLOGIES
6.5.2.1
Precision agriculture tools
6.5.3
ADJACENT TECHNOLOGIES
6.5.3.1
Seed treatment technologies
6.6.1
PRICING RANGE OF NEMATICIDE TYPES, BY KEY PLAYER, 2024
6.6.2
PRICING TREND, BY NEMATICIDE TYPE, 2020–2024
6.6.3
PRICING TREND OF NEMATICIDE PRODUCTS, BY REGION, 2020–2024
6.8
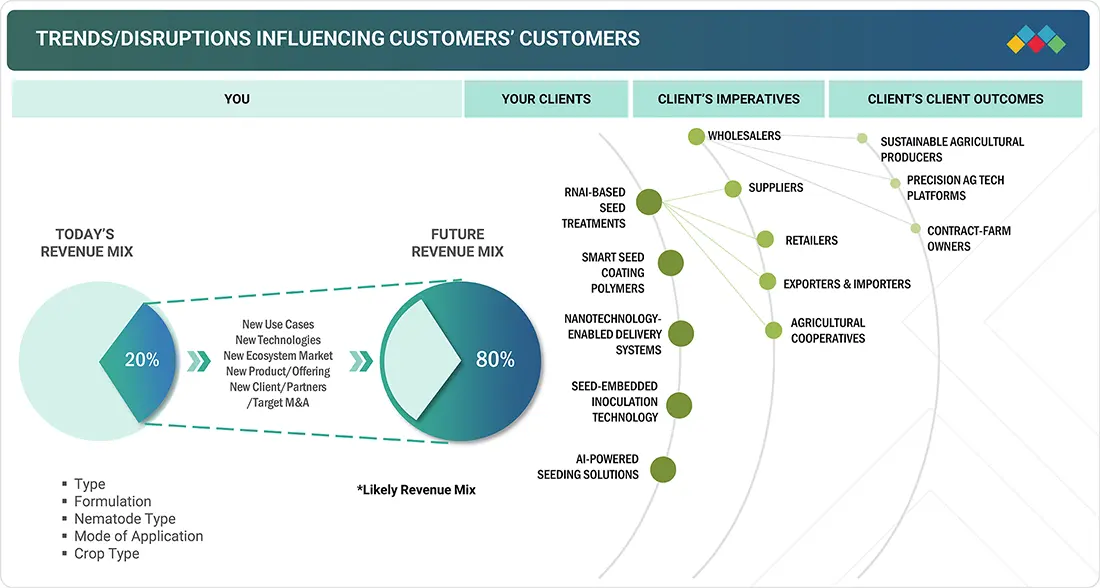
TRENDS/DISRUPTIONS IMPACTING CUSTOMER BUSINESS
6.10
KEY CONFERENCES & EVENTS, 2025–2026
6.11
REGULATORY LANDSCAPE
6.11.1
REGULATORY BODIES, GOVERNMENT AGENCIES, AND OTHER ORGANIZATIONS
6.12
PORTER’S FIVE FORCES ANALYSIS
6.12.1
THREAT OF NEW ENTRANTS
6.12.2
THREAT OF SUBSTITUTES
6.12.3
BARGAINING POWER OF BUYERS
6.12.4
BARGAINING POWER OF SUPPLIERS
6.12.5
INTENSITY OF COMPETITIVE RIVALRY
6.13
KEY STAKEHOLDERS AND BUYING CRITERIA
6.13.1
KEY STAKEHOLDERS IN BUYING PROCESS
6.14
INVESTMENT AND FUNDING SCENARIO
6.15.1
NUFARM LAUNCHED EVOLVANCE BIOLOGICAL BIONEMATICIDE TO ENHANCE CROP RESILIENCE
6.15.2
SYNGENTA LAUNCHED TYMIRIUM TECHNOLOGY FOR SUSTAINABLE NEMATODE AND FUNGAL DISEASE CONTROL
7
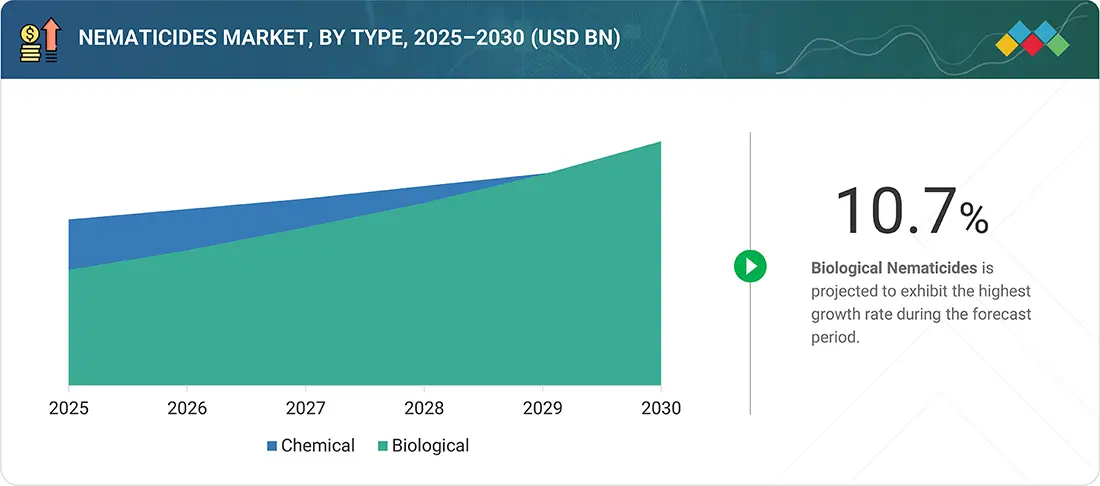
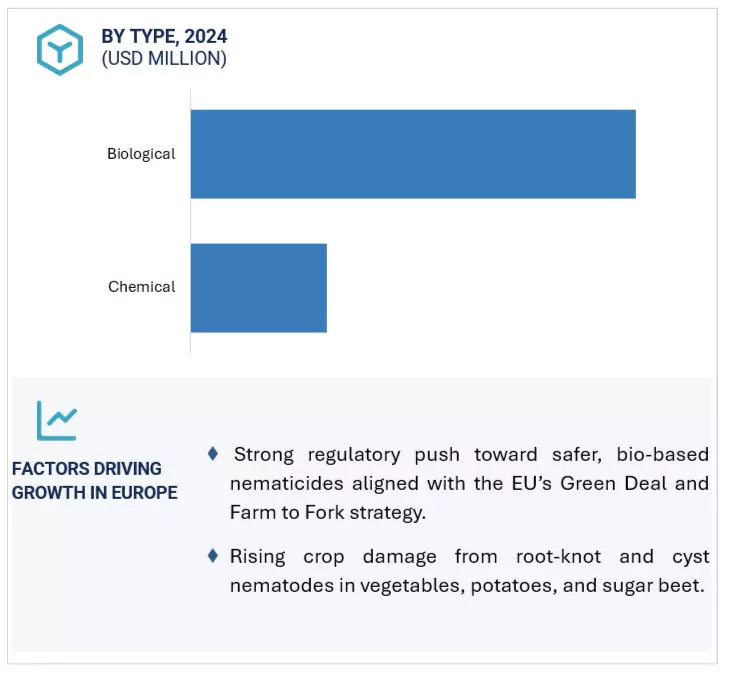
NEMATICIDES MARKET, BY TYPE
Market Size & Growth Rate Forecast Analysis to 2030 in USD Million and Tons | 60 Data Tables
112
7.2.1
LONGER RESIDUAL ACTIVITY AND QUICK MODE OF ACTION AGAINST NEMATODES TO DRIVE SEGMENT
7.2.2.1
Broad-spectrum functionality of fumigants against nematodes to drive market
7.2.2.4
1-3-Dichloropropene
7.2.2.5
Other fumigant types
7.2.3.3
Abamectin (Next-gen)
7.2.4.1
Fluoroalkenyl compounds
7.3.1
STRINGENT REGULATORY POLICIES ON CONVENTIONAL AGROCHEMICALS TO DRIVE MARKET
7.3.2.1
High adoption of sustainable agricultural techniques to fuel growth
7.3.3.1
Residue-free nematode management by biochemicals to propel growth
8
NEMATICIDES MARKET, BY NEMATODE TYPE
Market Size & Growth Rate Forecast Analysis to 2030 in USD Million | 20 Data Tables
142
8.2.1
RISING NEED TO REDUCE ECONOMIC LOSSES AND ENHANCE CROP QUALITY TO DRIVE DEMAND FOR NEMATICIDES
8.3.1
LARGE-SCALE ECONOMIC LOSSES AND LOWER YIELD QUALITY DUE TO CYST NEMATODE INFESTATION TO INCREASE DEMAND
8.4.1
WIDE HOST RANGE AND PRESENCE IN TEMPERATE AND TROPICAL ENVIRONMENTS TO DRIVE MARKET
9
NEMATICIDES MARKET, BY FORMULATION
Market Size & Growth Rate Forecast Analysis to 2030 in USD Million | 6 Data Tables
153
9.2.1
GOOD STORAGE VIABILITY TO DRIVE SEGMENT GROWTH
9.3.1
GREATER DEGREE OF DISPERSION PROPERTY OFFERED BY LIQUID NEMATICIDES TO DRIVE DEMAND
10
NEMATICIDES MARKET, BY MODE OF APPLICATION
Market Size & Growth Rate Forecast Analysis to 2030 in USD Million and Tons | 24 Data Tables
158
10.2.1
LOWER COSTS INVOLVED IN FUMIGATION FOR NEMATODE CONTROL TO PROPEL GROWTH
10.3.1
PRECISE APPLICATION AND DEEP PENETRATION OF NEMATICIDES ON TARGET NEMATODES TO DRIVE DEMAND
10.4.1
EFFECTIVE MANAGEMENT OF EARLY SEASON NEMATODE TO DRIVE DEMAND
10.5.1
SAFER APPLICATION AND EARLY SEASON PROTECTION AGAINST NEMATODE TO AUGMENT DEMAND
10.6
OTHER MODES OF APPLICATION
11
NEMATICIDES MARKET, BY CROP TYPE
Market Size & Growth Rate Forecast Analysis to 2030 in USD Million | 17 Data Tables
172
11.2.1
RISE IN CONSUMPTION AND EXTENSIVE CULTIVATION AREA TO DRIVE MARKET
11.2.5
OTHER CEREALS & GRAINS
11.3.1
INCREASE IN CONSUMPTION OF PROTEIN- AND HEALTHY FAT-RICH MEALS TO DRIVE SEGMENTAL GROWTH
11.3.4
OTHER OILSEEDS & PULSES
11.4.1
RISE IN EXPORTS OF FRESH, FROZEN, AND PROCESSED FRUITS & VEGETABLES FROM SOUTH ASIA TO DRIVE DEMAND
11.4.6
ROOTS & TUBERS VEGETABLES
11.4.7
OTHER FRUITS & VEGETABLES
12
NEMATICIDES MARKET, BY REGION
Market Size & Growth Rate Forecast Analysis to 2030 in USD Million and Tons | 377 Data Tables
188
12.2.1.1
Research undertaken to introduce nematode-resistant vegetables and field crops to drive market
12.2.2.1
Losses in high-value cash crops to drive adoption of nematicides
12.2.3.1
Increase in root-knot and root-lesion nematode infestation in wheat to fuel market
12.3.1.1
Environment-friendly and organic farming practices to cater to nematode attacks in field crops
12.3.2.1
High demand for nematicides since farmers still use traditional farming methods
12.3.3.1
Extensive government funds in R&D to devise sustainable methods for nematode control
12.3.4.1
Surge in government initiatives to encourage use of biological nematicides
12.3.5.1
Adoption of sustainable farming procedures to drive market
12.4.1.1
Rise in infestation by root-knot nematodes in crops to propel market
12.4.2.1
Rising demand for novel nematicides catering to long-term viability of crops to drive growth
12.4.3.1
Protected environment in polyhouses to create favorable environment for root-knot nematodes
12.4.4
AUSTRALIA & NEW ZEALAND
12.4.4.1
Increase in canola losses due to nematode attacks to support adoption of nematicides
12.4.5
REST OF ASIA PACIFIC
12.5.1.1
Increasing focus on soybean and corn cultivation to boost demand for nematicides
12.5.2.1
High adoption of genetically modified crops to increase usage of nematicides
12.5.3
REST OF SOUTH AMERICA
12.6
REST OF THE WORLD (ROW)
12.6.1.1
Rise in population, high dependency on imports, and yield loss due to nematodes to boost market
12.6.2.1
Growth in demand for vegetable crops to drive growth
13
COMPETITIVE LANDSCAPE
Uncover how top players and startups are reshaping market dynamics with strategic expansions and innovations.
311
13.2
KEY PLAYERS’ STRATEGIES/RIGHT TO WIN
13.3
REVENUE ANALYSIS, 2020–2024
13.4
MARKET SHARE ANALYSIS, 2024
13.5
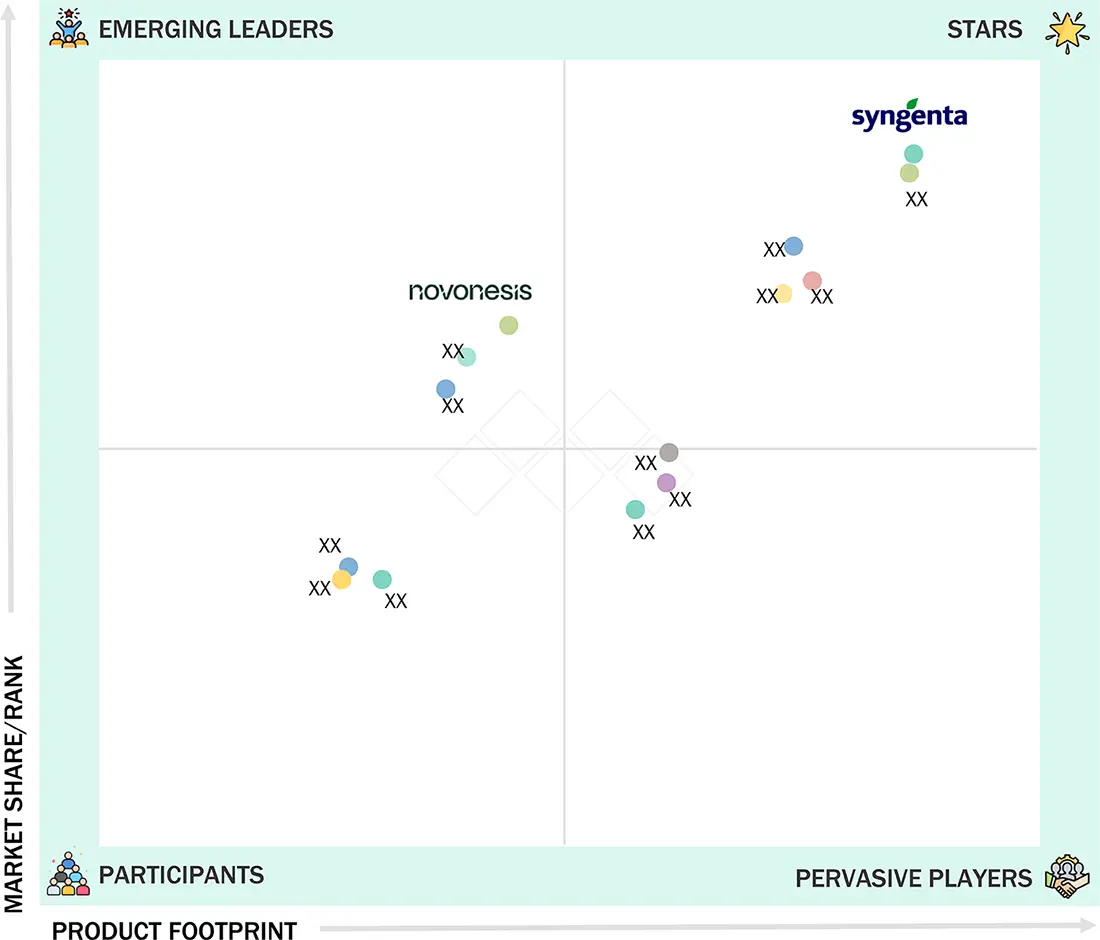
COMPANY EVALUATION MATRIX: KEY PLAYERS, 2024
13.5.5
COMPANY FOOTPRINT: KEY PLAYERS, 2024
13.5.5.1
Company footprint
13.5.5.2
Region footprint
13.5.5.4
Formulation footprint
13.5.5.5
Crop type footprint
13.6
COMPANY EVALUATION MATRIX: STARTUPS/SMES, 2024
13.6.1
PROGRESSIVE COMPANIES
13.6.2
RESPONSIVE COMPANIES
13.6.5
COMPETITIVE BENCHMARKING: STARTUPS/SMES, 2024
13.6.5.1
Detailed list of key startups/SMEs
13.6.5.2
Competitive benchmarking of key startups/SMEs
13.7
COMPANY VALUATION AND FINANCIAL METRICS
13.8
BRAND/PRODUCT COMPARISON
13.9
COMPETITIVE SCENARIO AND TRENDS
14
COMPANY PROFILES
In-depth Company Profiles of Leading Market Players with detailed Business Overview, Product and Service Portfolio, Recent Developments, and Unique Analyst Perspective (MnM View)
333
14.1.1.1
Business overview
14.1.1.2
Products offered
14.1.1.3
Recent developments
14.1.7
SUMITOMO CHEMICAL CO., LTD.
14.1.9
AMERICAN VANGUARD CORPORATION
14.1.11
BIOCERES CROP SOLUTIONS
14.1.13
CERTIS USA L.L.C.
14.1.15
AECI PLANT HEALTH
14.2.1
ANDERMATT GROUP AG
14.2.5
CROP IQ TECHNOLOGY
14.2.9
VIVE CROP PROTECTION INC.
15
ADJACENT AND RELATED MARKETS
389
15.3
CROP PROTECTION CHEMICALS MARKET
15.4
BIORATIONAL PESTICIDES MARKET
16.2
KNOWLEDGESTORE: MARKETSANDMARKETS’ SUBSCRIPTION PORTAL
16.3
AVAILABLE CUSTOMIZATION
TABLE 1
NEMATICIDES MARKET: INCLUSIONS AND EXCLUSIONS
TABLE 2
USD EXCHANGE RATES CONSIDERED, 2020–2024
TABLE 3
KEY DATA FROM PRIMARY SOURCES
TABLE 4
NEMATICIDES MARKET SNAPSHOT, 2025 VS. 2030
TABLE 5
AVERAGE ANNUAL MONETARY LOSS CAUSED BY PLANT PARASITIC NEMATODES TO ECONOMICALLY IMPORTANT CROPS
TABLE 6
US ADJUSTED RECIPROCAL TARIFF RATES
TABLE 7
EXPORT VALUE OF HS CODE 3808, BY KEY COUNTRY, 2020–2024 (USD THOUSAND)
TABLE 8
IMPORT VALUE OF HS CODE 3808, BY KEY COUNTRY, 2020–2024 (USD THOUSAND)
TABLE 9
PRICING RANGE OF NEMATICIDE TYPES, BY KEY PLAYER, 2024 (USD/KG)
TABLE 10
PRICING TREND, BY NEMATICIDE TYPE, 2020–2024 (USD/KG)
TABLE 11
PRICING TREND OF NEMATICIDE PRODUCTS, BY REGION, 2020–2024 (USD/KG)
TABLE 12
NEMATICIDES MARKET: ECOSYSTEM
TABLE 13
KEY PATENTS PERTAINING TO NEMATICIDES, 2015–2025
TABLE 14
NEMATICIDES MARKET: DETAILED LIST OF CONFERENCES AND EVENTS, 2025–2026
TABLE 15
NORTH AMERICA: REGULATORY BODIES, GOVERNMENT AGENCIES, AND OTHER ORGANIZATIONS
TABLE 16
EUROPE: REGULATORY BODIES, GOVERNMENT AGENCIES, AND OTHER ORGANIZATIONS
TABLE 17
ASIA PACIFIC: REGULATORY BODIES, GOVERNMENT AGENCIES, AND OTHER ORGANIZATIONS
TABLE 18
SOUTH AMERICA: REGULATORY BODIES, GOVERNMENT AGENCIES, AND OTHER ORGANIZATIONS
TABLE 19
REST OF WORLD: REGULATORY BODIES, GOVERNMENT AGENCIES, AND OTHER ORGANIZATIONS
TABLE 20
IMPACT OF PORTER’S FIVE FORCES ON NEMATICIDES MARKET
TABLE 21
INFLUENCE OF STAKEHOLDERS ON BUYING PROCESS, BY MODE OF APPLICATION
TABLE 22
KEY BUYING CRITERIA, BY MODE OF APPLICATION
TABLE 23
NEMATICIDES MARKET, BY TYPE, 2020–2024 (USD MILLION)
TABLE 24
NEMATICIDES MARKET, BY TYPE, 2025–2030 (USD MILLION)
TABLE 25
NEMATICIDES MARKET, BY TYPE, 2020–2024 (TONS)
TABLE 26
NEMATICIDES MARKET, BY TYPE, 2025–2030 (TONS)
TABLE 27
CHEMICAL: NEMATICIDES MARKET, BY TYPE, 2020–2024 (USD MILLION)
TABLE 28
CHEMICAL: NEMATICIDES MARKET, BY TYPE, 2025–2030 (USD MILLION)
TABLE 29
CHEMICAL: NEMATICIDES MARKET, BY TYPE, 2020–2024 (TONS)
TABLE 30
CHEMICAL: NEMATICIDES MARKET, BY TYPE, 2025–2030 (TONS)
TABLE 31
CHEMICAL: NEMATICIDES MARKET, BY REGION, 2020–2024 (USD MILLION)
TABLE 32
CHEMICAL: NEMATICIDES MARKET, BY REGION, 2025–2030 (USD MILLION)
TABLE 33
CHEMICAL: NEMATICIDES MARKET, BY REGION, 2020–2024 (TONS)
TABLE 34
CHEMICAL: NEMATICIDES MARKET, BY REGION, 2025–2030 (TONS)
TABLE 35
FUMIGANTS APPLIED TO AGRONOMIC CROPS
TABLE 36
FUMIGANTS: CHEMICAL NEMATICIDES MARKET, BY REGION, 2020–2024 (USD MILLION)
TABLE 37
FUMIGANTS: CHEMICAL NEMATICIDES MARKET, BY REGION, 2025–2030 (USD MILLION)
TABLE 38
FUMIGANTS: CHEMICAL NEMATICIDES MARKET, BY REGION, 2020–2024 (TONS)
TABLE 39
FUMIGANTS: CHEMICAL NEMATICIDES MARKET, BY REGION, 2025–2030 (TONS)
TABLE 40
FUMIGANTS: CHEMICAL NEMATICIDES MARKET, BY TYPE, 2020–2024 (USD MILLION)
TABLE 41
FUMIGANTS: CHEMICAL NEMATICIDES MARKET, BY TYPE, 2025–2030 (USD MILLION)
TABLE 42
NON-FUMIGANTS: CHEMICAL NEMATICIDES MARKET, BY REGION, 2020–2024 (USD MILLION)
TABLE 43
NON-FUMIGANTS: CHEMICAL NEMATICIDES MARKET, BY REGION, 2025–2030 (USD MILLION)
TABLE 44
NON-FUMIGANTS: CHEMICAL NEMATICIDES MARKET, BY REGION, 2020–2024 (TONS)
TABLE 45
NON-FUMIGANTS: CHEMICAL NEMATICIDES MARKET, BY REGION, 2025–2030 (TONS)
TABLE 46
NON-FUMIGANTS: CHEMICAL NEMATICIDES MARKET, BY TYPE, 2020–2024 (USD MILLION)
TABLE 47
NON-FUMIGANTS: CHEMICAL NEMATICIDES MARKET, BY TYPE, 2025–2030 (USD MILLION)
TABLE 48
NON-FUMIGANTS: CHEMICAL NEMATICIDES MARKET, BY TYPE, 2020–2024 (TONS)
TABLE 49
NON-FUMIGANTS: CHEMICAL NEMATICIDES MARKET, BY TYPE, 2025–2030 (TONS)
TABLE 50
CROPS RECEIVING CARBAMATE APPLICATIONS
TABLE 51
CARBAMATES: NON-FUMIGANT NEMATICIDES MARKET, BY REGION, 2020–2024 (USD MILLION)
TABLE 52
CARBAMATES: NON-FUMIGANT NEMATICIDES MARKET, BY REGION, 2025–2030 (USD MILLION)
TABLE 53
CARBAMATES: NON-FUMIGANT NEMATICIDES MARKET, BY REGION, 2020–2024 (TONS)
TABLE 54
CARBAMATES: NON-FUMIGANT NEMATICIDES MARKET, BY REGION, 2025–2030 (TONS)
TABLE 55
ORGANOPHOSPHATES: NON-FUMIGANT NEMATICIDES MARKET, BY REGION, 2020–2024 (USD MILLION)
TABLE 56
ORGANOPHOSPHATES: NON-FUMIGANT NEMATICIDES MARKET, BY REGION, 2025–2030 (USD MILLION)
TABLE 57
ORGANOPHOSPHATES: NON-FUMIGANT NEMATICIDES MARKET, BY REGION, 2020–2024 (TONS)
TABLE 58
ORGANOPHOSPHATES: NON-FUMIGANT NEMATICIDES MARKET, BY REGION, 2025–2030 (TONS)
TABLE 59
ABAMECTIN: NON-FUMIGANT NEMATICIDES MARKET, BY REGION, 2020–2024 (USD MILLION)
TABLE 60
ABAMECTIN: NON-FUMIGANT NEMATICIDES MARKET, BY REGION, 2025–2030 (USD MILLION)
TABLE 61
ABAMECTIN: NON-FUMIGANT NEMATICIDES MARKET, BY REGION, 2020–2024 (TONS)
TABLE 62
ABAMECTIN: NON-FUMIGANT NEMATICIDES MARKET, BY REGION, 2025–2030 (TONS)
TABLE 63
SUCCINATE DEHYDROGENASE INHIBITORS: NON-FUMIGANT NEMATICIDES MARKET, BY TYPE, 2020–2024 (USD MILLION)
TABLE 64
SUCCINATE DEHYDROGENASE INHIBITORS: NON-FUMIGANT NEMATICIDES MARKET, BY TYPE, 2025–2030 (USD MILLION)
TABLE 65
SUCCINATE DEHYDROGENASE INHIBITORS: NON-FUMIGANT NEMATICIDES MARKET, BY REGION, 2020–2024 (USD MILLION)
TABLE 66
SUCCINATE DEHYDROGENASE INHIBITORS: NON-FUMIGANT NEMATICIDES MARKET, BY REGION, 2025–2030 (USD MILLION)
TABLE 67
SUCCINATE DEHYDROGENASE INHIBITORS: NON-FUMIGANT NEMATICIDES MARKET, BY REGION, 2020–2024 (TONS)
TABLE 68
SUCCINATE DEHYDROGENASE INHIBITORS: NON-FUMIGANT NEMATICIDES MARKET, BY REGION, 2025–2030 (TONS)
TABLE 69
OTHERS: NON-FUMIGANT NEMATICIDES MARKET, BY REGION, 2020–2024 (USD MILLION)
TABLE 70
OTHERS: NON-FUMIGANT NEMATICIDES MARKET, BY REGION, 2025–2030 (USD MILLION)
TABLE 71
OTHERS: NON-FUMIGANT NEMATICIDES MARKET, BY REGION, 2020–2024 (TONS)
TABLE 72
OTHERS: NON-FUMIGANT NEMATICIDES MARKET, BY REGION, 2025–2030 (TONS)
TABLE 73
BIOLOGICAL: NEMATICIDES MARKET, BY TYPE, 2020–2024 (USD MILLION)
TABLE 74
BIOLOGICAL: NEMATICIDES MARKET, BY TYPE, 2025–2030 (USD MILLION)
TABLE 75
BIOLOGICAL: NEMATICIDES MARKET, BY REGION, 2020–2024 (USD MILLION)
TABLE 76
BIOLOGICAL: NEMATICIDES MARKET, BY REGION, 2025–2030 (USD MILLION)
TABLE 77
BIOLOGICAL: NEMATICIDES MARKET, BY REGION, 2020–2024 (TONS)
TABLE 78
BIOLOGICAL: NEMATICIDES MARKET, BY REGION, 2025–2030 (TONS)
TABLE 79
MICROBIALS: BIOLOGICAL NEMATICIDES MARKET, BY REGION, 2020–2024 (USD MILLION)
TABLE 80
MICROBIALS: BIOLOGICAL NEMATICIDES MARKET, BY REGION, 2025–2030 (USD MILLION)
TABLE 81
BIOCHEMICALS: BIOLOGICAL NEMATICIDES MARKET, BY REGION, 2020–2024 (USD MILLION)
TABLE 82
BIOCHEMICALS: BIOLOGICAL NEMATICIDES MARKET, BY REGION, 2025–2030 (USD MILLION)
TABLE 83
MOST COMMON NEMATODE SPECIES
TABLE 84
NEMATICIDES MARKET, BY NEMATODE TYPE, 2020–2024 (USD MILLION)
TABLE 85
NEMATICIDES MARKET, BY NEMATODE TYPE, 2025–2030 (USD MILLION)
TABLE 86
ROOT-KNOT NEMATODES: NEMATICIDES MARKET, BY REGION, 2020–2024 (USD MILLION)
TABLE 87
ROOT-KNOT NEMATODES: NEMATICIDES MARKET, BY REGION, 2025–2030 (USD MILLION)
TABLE 88
ROOT-KNOT NEMATODES: NEMATICIDES MARKET, BY CROP TYPE, 2020–2024 (USD MILLION)
TABLE 89
ROOT-KNOT NEMATODES: NEMATICIDES MARKET, BY CROP TYPE, 2025–2030 (USD MILLION)
TABLE 90
ECONOMIC LOSSES IN VEGETABLE CROPS DUE TO ROOT-KNOT NEMATODES
TABLE 91
CYST NEMATODES: NEMATICIDES MARKET, BY REGION, 2020–2024 (USD MILLION)
TABLE 92
CYST NEMATODES: NEMATICIDES MARKET, BY REGION, 2025–2030 (USD MILLION)
TABLE 93
CYST NEMATODES: NEMATICIDES MARKET, BY CROP TYPE, 2020–2024 (USD MILLION)
TABLE 94
CYST NEMATODES: NEMATICIDES MARKET, BY CROP TYPE, 2025–2030 (USD MILLION)
TABLE 95
LESION NEMATODES: NEMATICIDES MARKET, BY REGION, 2020–2024 (USD MILLION)
TABLE 96
LESION NEMATODES: NEMATICIDES MARKET, BY REGION, 2025–2030 (USD MILLION)
TABLE 97
LESION NEMATODES: NEMATICIDES MARKET, BY CROP TYPE, 2020–2024 (USD MILLION)
TABLE 98
LESION NEMATODES: NEMATICIDES MARKET, BY CROP TYPE, 2025–2030 (USD MILLION)
TABLE 99
OTHER NEMATODE TYPES: NEMATICIDES MARKET, BY REGION, 2020–2024 (USD MILLION)
TABLE 100
OTHER NEMATODE TYPES: NEMATICIDES MARKET, BY REGION, 2025–2030 (USD MILLION)
TABLE 101
OTHER NEMATODE TYPES: NEMATICIDES MARKET, BY CROP TYPE, 2020–2024 (USD MILLION)
TABLE 102
OTHER NEMATODE TYPES: NEMATICIDES MARKET, BY CROP TYPE, 2025–2030 (USD MILLION)
TABLE 103
NEMATICIDES MARKET, BY FORMULATION, 2020–2024 (USD MILLION)
TABLE 104
NEMATICIDES MARKET, BY FORMULATION, 2025–2030 (USD MILLION)
TABLE 105
GRANULAR NEMATICIDES MARKET, BY REGION, 2020–2024 (USD MILLION)
TABLE 106
GRANULAR NEMATICIDES MARKET, BY REGION, 2025–2030 (USD MILLION)
TABLE 107
LIQUID NEMATICIDES MARKET, BY REGION, 2020–2024 (USD MILLION)
TABLE 108
LIQUID NEMATICIDES MARKET, BY REGION, 2025–2030(USD MILLION)
TABLE 109
NEMATICIDES MARKET, BY MODE OF APPLICATION, 2020–2024 (USD MILLION)
TABLE 110
NEMATICIDES MARKET, BY MODE OF APPLICATION, 2025–2030 (USD MILLION)
TABLE 111
NEMATICIDES MARKET, BY MODE OF APPLICATION, 2020–2024 (TONS)
TABLE 112
NEMATICIDES MARKET, BY MODE OF APPLICATION, 2025–2030 (TONS)
TABLE 113
FUMIGATION: NEMATICIDES MARKET, BY REGION, 2020–2024 (USD MILLION)
TABLE 114
FUMIGATION: NEMATICIDES MARKET, BY REGION, 2025–2030 (USD MILLION)
TABLE 115
FUMIGATION: NEMATICIDES MARKET, BY REGION, 2020–2024 (TONS)
TABLE 116
FUMIGATION: NEMATICIDES MARKET, BY REGION, 2025–2030 (TONS)
TABLE 117
DRENCHING: NEMATICIDES MARKET, BY REGION, 2020–2024 (USD MILLION)
TABLE 118
DRENCHING: NEMATICIDES MARKET, BY REGION, 2025–2030 (USD MILLION)
TABLE 119
DRENCHING: NEMATICIDES MARKET, BY REGION, 2020–2024 (TONS)
TABLE 120
DRENCHING: NEMATICIDES MARKET, BY REGION, 2025–2030 (TONS)
TABLE 121
SOIL DRESSING: NEMATICIDES MARKET, BY REGION, 2020–2024 (USD MILLION)
TABLE 122
SOIL DRESSING: NEMATICIDES MARKET, BY REGION, 2025–2030 (USD MILLION)
TABLE 123
SOIL DRESSING: NEMATICIDES MARKET, BY REGION, 2020–2024 (TONS)
TABLE 124
SOIL DRESSING: NEMATICIDES MARKET, BY REGION, 2025–2030 (TONS)
TABLE 125
SEED TREATMENT: NEMATICIDES MARKET, BY REGION, 2020–2024 (USD MILLION)
TABLE 126
SEED TREATMENT: NEMATICIDES MARKET, BY REGION, 2025–2030 (USD MILLION)
TABLE 127
SEED TREATMENT: NEMATICIDES MARKET, BY REGION, 2020–2024 (TONS)
TABLE 128
SEED TREATMENT: NEMATICIDES MARKET, BY REGION, 2025–2030 (TONS)
TABLE 129
OTHER MODES OF APPLICATION: NEMATICIDES MARKET, BY REGION, 2020–2024 (USD MILLION)
TABLE 130
OTHER MODES OF APPLICATION: NEMATICIDES MARKET, BY REGION, 2025–2030 (USD MILLION)
TABLE 131
OTHER MODES OF APPLICATION: NEMATICIDES MARKET, BY REGION, 2020–2024 (TONS)
TABLE 132
OTHER MODES OF APPLICATION: NEMATICIDES MARKET, BY REGION, 2025–2030 (TONS)
TABLE 133
NEMATICIDES MARKET, BY CROP TYPE, 2020–2024 (USD MILLION)
TABLE 134
NEMATICIDES MARKET, BY CROP TYPE, 2025–2030 (USD MILLION)
TABLE 135
CEREALS & GRAINS: NEMATICIDES MARKET, BY REGION, 2020–2024 (USD MILLION)
TABLE 136
CEREALS & GRAINS: NEMATICIDES MARKET, BY REGION, 2025–2030 (USD MILLION)
TABLE 137
CEREALS & GRAINS: NEMATICIDES MARKET, BY CROP SUB-TYPE, 2020–2024 (USD MILLION)
TABLE 138
CEREALS & GRAINS: NEMATICIDES MARKET, BY CROP SUB-TYPE, 2025–2030 (USD MILLION)
TABLE 139
NEMATODE TYPES AFFECTING CORN
TABLE 140
OILSEEDS & PULSES: NEMATICIDES MARKET, BY REGION, 2020–2024 (USD MILLION)
TABLE 141
OILSEEDS & PULSES: NEMATICIDES MARKET, BY REGION, 2025–2030 (USD MILLION)
TABLE 142
OILSEEDS & PULSES: NEMATICIDES MARKET, BY CROP SUB-TYPE, 2020–2024 (USD MILLION)
TABLE 143
OILSEEDS & PULSES: NEMATICIDES MARKET, BY CROP SUB-TYPE, 2025–2030 (USD MILLION)
TABLE 144
FRUITS & VEGETABLES: NEMATICIDES MARKET, BY REGION, 2020–2024 (USD MILLION)
TABLE 145
FRUITS & VEGETABLES: NEMATICIDES MARKET, BY REGION, 2025–2030 (USD MILLION)
TABLE 146
FRUITS & VEGETABLES: NEMATICIDES MARKET, BY CROP SUB-TYPE, 2020–2024 (USD MILLION)
TABLE 147
FRUITS & VEGETABLES: NEMATICIDES MARKET, BY TYPE, 2025–2030 (USD MILLION)
TABLE 148
OTHER CROP TYPES: NEMATICIDES MARKET, BY REGION, 2020–2024 (USD MILLION)
TABLE 149
OTHER CROP TYPES: NEMATICIDES MARKET, BY REGION, 2025–2030 (USD MILLION)
TABLE 150
NEMATICIDES MARKET, BY REGION, 2020–2024 (USD MILLION)
TABLE 151
NEMATICIDES MARKET, BY REGION, 2025–2030 (USD MILLION)
TABLE 152
NEMATICIDES MARKET, BY REGION, 2020–2024 (TON)
TABLE 153
NEMATICIDES MARKET, BY REGION, 2025–2030 (TON)
TABLE 154
NORTH AMERICA: NEMATICIDES MARKET, BY COUNTRY, 2020–2024 (USD MILLION)
TABLE 155
NORTH AMERICA: NEMATICIDES MARKET, BY COUNTRY, 2025–2030 (USD MILLION)
TABLE 156
NORTH AMERICA: NEMATICIDES MARKET, BY COUNTRY, 2020–2024 (TON)
TABLE 157
NORTH AMERICA: NEMATICIDES MARKET, BY COUNTRY, 2025–2030 (TON)
TABLE 158
NORTH AMERICA: NEMATICIDES MARKET, BY CROP TYPE, 2020–2024 (USD MILLION)
TABLE 159
NORTH AMERICA: NEMATICIDES MARKET, BY CROP TYPE, 2025–2030 (USD MILLION)
TABLE 160
NORTH AMERICA: NEMATICIDES MARKET, BY NEMATODE TYPE, 2020–2024 (USD MILLION)
TABLE 161
NORTH AMERICA: NEMATICIDES MARKET, BY NEMATODE TYPE, 2025–2030 (USD MILLION)
TABLE 162
NORTH AMERICA: NEMATICIDES MARKET, BY FORMULATION, 2020–2024 (USD MILLION)
TABLE 163
NORTH AMERICA: NEMATICIDES MARKET, BY FORMULATION, 2025–2030 (USD MILLION)
TABLE 164
NORTH AMERICA: NEMATICIDES MARKET, BY TYPE, 2020–2024 (USD MILLION)
TABLE 165
NORTH AMERICA: NEMATICIDES MARKET, BY TYPE, 2025–2030 (USD MILLION)
TABLE 166
NORTH AMERICA: NEMATICIDES MARKET, BY TYPE, 2020–2024 (TON)
TABLE 167
NORTH AMERICA: NEMATICIDES MARKET, BY TYPE, 2025–2030 (TON)
TABLE 168
NORTH AMERICA: CHEMICAL NEMATICIDES MARKET, BY TYPE, 2020–2024 (USD MILLION)
TABLE 169
NORTH AMERICA: CHEMICAL NEMATICIDES MARKET, BY TYPE, 2025–2030 (USD MILLION)
TABLE 170
NORTH AMERICA: CHEMICAL NEMATICIDES MARKET, BY TYPE, 2020–2024 (TON)
TABLE 171
NORTH AMERICA: CHEMICAL NEMATICIDES MARKET, BY TYPE, 2025–2030 (TON)
TABLE 172
NORTH AMERICA: NON-FUMIGANT NEMATICIDES MARKET, BY TYPE, 2020–2024 (USD MILLION)
TABLE 173
NORTH AMERICA: NON-FUMIGANT NEMATICIDES MARKET, BY TYPE, 2025–2030 (USD MILLION)
TABLE 174
NORTH AMERICA: NON-FUMIGANT NEMATICIDES MARKET, BY TYPE, 2020–2024 (TON)
TABLE 175
NORTH AMERICA: NON-FUMIGANT NEMATICIDES MARKET, BY TYPE, 2025–2030 (TON)
TABLE 176
NORTH AMERICA: BIOLOGICAL NEMATICIDES MARKET, BY TYPE, 2020–2024 (USD MILLION)
TABLE 177
NORTH AMERICA: BIOLOGICAL NEMATICIDES MARKET, BY TYPE, 2025–2030 (USD MILLION)
TABLE 178
NORTH AMERICA: NEMATICIDES MARKET, BY MODE OF APPLICATION, 2020–2024 (USD MILLION)
TABLE 179
NORTH AMERICA: NEMATICIDES MARKET, BY MODE OF APPLICATION, 2025–2030 (USD MILLION)
TABLE 180
NORTH AMERICA: NEMATICIDES MARKET, BY MODE OF APPLICATION, 2020–2024 (TON)
TABLE 181
NORTH AMERICA: NEMATICIDES MARKET, BY MODE OF APPLICATION, 2025–2030 (TON)
TABLE 182
US: NEMATODE SPECIES AND THEIR PREVALENCE
TABLE 183
US: NEMATICIDES MARKET, BY TYPE, 2020–2024 (USD MILLION)
TABLE 184
US: NEMATICIDES MARKET, BY TYPE, 2025–2030 (USD MILLION)
TABLE 185
US: NEMATICIDES MARKET, BY TYPE, 2020–2024 (TON)
TABLE 186
US: NEMATICIDES MARKET, BY TYPE, 2025–2030 (TON)
TABLE 187
US: CHEMICAL NEMATICIDES MARKET, BY TYPE, 2020–2024 (USD MILLION)
TABLE 188
US: CHEMICAL NEMATICIDES MARKET, BY TYPE, 2025–2030 (USD MILLION)
TABLE 189
US: CHEMICAL NEMATICIDES MARKET, BY TYPE, 2020–2024 (TON)
TABLE 190
US: CHEMICAL NEMATICIDES MARKET, BY TYPE, 2025–2030 (TON)
TABLE 191
US: NON-FUMIGANT NEMATICIDES MARKET, BY TYPE, 2020–2024 (USD MILLION)
TABLE 192
US: NON-FUMIGANT NEMATICIDES MARKET, BY TYPE, 2025–2030 (USD MILLION)
TABLE 193
US: NEMATICIDES MARKET, BY CROP TYPE, 2020–2024 (USD MILLION)
TABLE 194
US: NEMATICIDES MARKET, BY CROP TYPE, 2025–2030 (USD MILLION)
TABLE 195
CANADA: CROPS INFESTED BY NEMATODES
TABLE 196
CANADA: NEMATICIDES MARKET, BY TYPE, 2020–2024 (USD MILLION)
TABLE 197
CANADA: NEMATICIDES MARKET, BY TYPE, 2025–2030 (USD MILLION)
TABLE 198
CANADA: NEMATICIDES MARKET, BY TYPE, 2020–2024 (TON)
TABLE 199
CANADA: NEMATICIDES MARKET, BY TYPE, 2025–2030 (TON)
TABLE 200
CANADA: CHEMICAL NEMATICIDES MARKET, BY TYPE, 2020–2024 (USD MILLION)
TABLE 201
CANADA: CHEMICAL NEMATICIDES MARKET, BY TYPE, 2025–2030 (USD MILLION)
TABLE 202
CANADA: CHEMICAL NEMATICIDES MARKET, BY TYPE, 2020–2024 (TON)
TABLE 203
CANADA: CHEMICAL NEMATICIDES MARKET, BY TYPE, 2025–2030 (TON)
TABLE 204
CANADA: NON-FUMIGANT NEMATICIDES MARKET, BY TYPE, 2020–2024 (USD MILLION)
TABLE 205
CANADA: NON-FUMIGANT NEMATICIDES MARKET, BY TYPE, 2025–2030 (USD MILLION)
TABLE 206
CANADA: NEMATICIDES MARKET, BY CROP TYPE, 2020–2024 (USD MILLION)
TABLE 207
CANADA: NEMATICIDES MARKET, BY CROP TYPE, 2025–2030 (USD MILLION)
TABLE 208
MEXICO: NEMATICIDES MARKET, BY TYPE, 2020–2024 (USD MILLION)
TABLE 209
MEXICO: NEMATICIDES MARKET, BY TYPE, 2025–2030 (USD MILLION)
TABLE 210
MEXICO: NEMATICIDES MARKET, BY TYPE, 2020–2024 (TON)
TABLE 211
MEXICO: NEMATICIDES MARKET, BY TYPE, 2025–2030 (TON)
TABLE 212
MEXICO: CHEMICAL NEMATICIDES MARKET, BY TYPE, 2020–2024 (USD MILLION)
TABLE 213
MEXICO: CHEMICAL NEMATICIDES MARKET, BY TYPE, 2025–2030 (USD MILLION)
TABLE 214
MEXICO: CHEMICAL NEMATICIDES MARKET, BY TYPE, 2020–2024 (TON)
TABLE 215
MEXICO: CHEMICAL NEMATICIDES MARKET, BY TYPE, 2025–2030 (TON)
TABLE 216
MEXICO: NON-FUMIGANT NEMATICIDES MARKET, BY TYPE, 2020–2024 (USD MILLION)
TABLE 217
MEXICO: NON-FUMIGANT NEMATICIDES MARKET, BY TYPE, 2025–2030 (USD MILLION)
TABLE 218
MEXICO: NEMATICIDES MARKET, BY CROP TYPE, 2020–2024 (USD MILLION)
TABLE 219
MEXICO: NEMATICIDES MARKET, BY CROP TYPE, 2025–2030 (USD MILLION)
TABLE 220
EUROPE: NEMATICIDES MARKET, BY COUNTRY, 2020–2024 (USD MILLION)
TABLE 221
EUROPE: NEMATICIDES MARKET, BY COUNTRY, 2025–2030 (USD MILLION)
TABLE 222
EUROPE: NEMATICIDES MARKET, BY COUNTRY, 2020–2024 (TON)
TABLE 223
EUROPE: NEMATICIDES MARKET, BY COUNTRY, 2025–2030 (TON)
TABLE 224
EUROPE: NEMATICIDES MARKET, BY CROP TYPE, 2020–2024 (USD MILLION)
TABLE 225
EUROPE: NEMATICIDES MARKET, BY CROP TYPE, 2025–2030 (USD MILLION)
TABLE 226
EUROPE: NEMATICIDES MARKET, BY NEMATODE TYPE, 2020–2024 (USD MILLION)
TABLE 227
EUROPE: NEMATICIDES MARKET, BY NEMATODE TYPE, 2025–2030 (USD MILLION)
TABLE 228
EUROPE: NEMATICIDES MARKET, BY FORMULATION, 2020–2024 (USD MILLION)
TABLE 229
EUROPE: NEMATICIDES MARKET, BY FORMULATION, 2025–2030 (USD MILLION)
TABLE 230
EUROPE: NEMATICIDES MARKET, BY TYPE, 2020–2024 (USD MILLION)
TABLE 231
EUROPE: NEMATICIDES MARKET, BY TYPE, 2025–2030 (USD MILLION)
TABLE 232
EUROPE: NEMATICIDES MARKET, BY TYPE, 2020–2024 (TON)
TABLE 233
EUROPE: NEMATICIDES MARKET, BY TYPE, 2025–2030 (TON)
TABLE 234
EUROPE: CHEMICAL NEMATICIDES MARKET, BY TYPE, 2020–2024 (USD MILLION)
TABLE 235
EUROPE: CHEMICAL NEMATICIDES MARKET, BY TYPE, 2025–2030 (USD MILLION)
TABLE 236
EUROPE: CHEMICAL NEMATICIDES MARKET, BY TYPE, 2020–2024 (TON)
TABLE 237
EUROPE: CHEMICAL NEMATICIDES MARKET, BY TYPE, 2025–2030 (TON)
TABLE 238
EUROPE: NON-FUMIGANT NEMATICIDES MARKET, BY TYPE, 2020–2024 (USD MILLION)
TABLE 239
EUROPE: NON-FUMIGANT NEMATICIDES MARKET, BY TYPE, 2025–2030 (USD MILLION)
TABLE 240
EUROPE: NON-FUMIGANT NEMATICIDES MARKET, BY TYPE, 2020–2024 (TON)
TABLE 241
EUROPE: NON-FUMIGANT NEMATICIDES MARKET, BY TYPE, 2025–2030 (TON)
TABLE 242
EUROPE: BIOLOGICAL NEMATICIDES MARKET, BY TYPE, 2020–2024 (USD MILLION)
TABLE 243
EUROPE: BIOLOGICAL NEMATICIDES MARKET, BY TYPE, 2025–2030 (USD MILLION)
TABLE 244
EUROPE: NEMATICIDES MARKET, BY MODE OF APPLICATION, 2020–2024 (USD MILLION)
TABLE 245
EUROPE: NEMATICIDES MARKET, BY MODE OF APPLICATION, 2025–2030 (USD MILLION)
TABLE 246
EUROPE: NEMATICIDES MARKET, BY MODE OF APPLICATION, 2020–2024 (TON)
TABLE 247
EUROPE: NEMATICIDES MARKET, BY MODE OF APPLICATION, 2025–2030 (TON)
TABLE 248
GERMANY: NEMATICIDES MARKET, BY TYPE, 2020–2024 (USD MILLION)
TABLE 249
GERMANY: NEMATICIDES MARKET, BY TYPE, 2025–2030 (USD MILLION)
TABLE 250
GERMANY: NEMATICIDES MARKET, BY TYPE, 2020–2024 (TON)
TABLE 251
GERMANY: NEMATICIDES MARKET, BY TYPE, 2025–2030 (TON)
TABLE 252
GERMANY: CHEMICAL NEMATICIDES MARKET, BY TYPE, 2020–2024 (USD MILLION)
TABLE 253
GERMANY: CHEMICAL NEMATICIDES MARKET, BY TYPE, 2025–2030 (USD MILLION)
TABLE 254
GERMANY: CHEMICAL NEMATICIDES MARKET, BY TYPE, 2020–2024 (TON)
TABLE 255
GERMANY: CHEMICAL NEMATICIDES MARKET, BY TYPE, 2025–2030 (TON)
TABLE 256
GERMANY: NON-FUMIGANT NEMATICIDES MARKET, BY TYPE, 2020–2024 (USD MILLION)
TABLE 257
GERMANY: NON-FUMIGANT NEMATICIDES MARKET, BY TYPE, 2025–2030 (USD MILLION)
TABLE 258
GERMANY: NEMATICIDES MARKET, BY CROP TYPE, 2020–2024 (USD MILLION)
TABLE 259
GERMANY: NEMATICIDES MARKET, BY CROP TYPE, 2025–2030 (USD MILLION)
TABLE 260
UK: NEMATICIDES MARKET, BY TYPE, 2020–2024 (USD MILLION)
TABLE 261
UK: NEMATICIDES MARKET, BY TYPE, 2025–2030 (USD MILLION)
TABLE 262
UK: NEMATICIDES MARKET, BY TYPE, 2020–2024 (TON)
TABLE 263
UK: NEMATICIDES MARKET, BY TYPE, 2025–2030 (TON)
TABLE 264
UK: CHEMICAL NEMATICIDES MARKET, BY TYPE, 2020–2024 (USD MILLION)
TABLE 265
UK: CHEMICAL NEMATICIDES MARKET, BY TYPE, 2025–2030 (USD MILLION)
TABLE 266
UK: CHEMICAL NEMATICIDES MARKET, BY TYPE, 2020–2024 (TON)
TABLE 267
UK: CHEMICAL NEMATICIDES MARKET, BY TYPE, 2025–2030 (TON)
TABLE 268
UK: NON-FUMIGANT NEMATICIDES MARKET, BY TYPE, 2020–2024 (USD MILLION)
TABLE 269
UK: NON-FUMIGANT NEMATICIDES MARKET, BY TYPE, 2025–2030 (USD MILLION)
TABLE 270
UK: NEMATICIDES MARKET, BY CROP TYPE, 2020–2024 (USD MILLION)
TABLE 271
UK: NEMATICIDES MARKET, BY CROP TYPE, 2025–2030 (USD MILLION)
TABLE 272
FRANCE: NEMATICIDES MARKET, BY TYPE, 2020–2024 (USD MILLION)
TABLE 273
FRANCE: NEMATICIDES MARKET, BY TYPE, 2025–2030 (USD MILLION)
TABLE 274
FRANCE: NEMATICIDES MARKET, BY TYPE, 2020–2024 (TON)
TABLE 275
FRANCE: NEMATICIDES MARKET, BY TYPE, 2025–2030 (TON)
TABLE 276
FRANCE: CHEMICAL NEMATICIDES MARKET, BY TYPE, 2020–2024 (USD MILLION)
TABLE 277
FRANCE: CHEMICAL NEMATICIDES MARKET, BY TYPE, 2025–2030 (USD MILLION)
TABLE 278
FRANCE: CHEMICAL NEMATICIDES MARKET, BY TYPE, 2020–2024 (TON)
TABLE 279
FRANCE: CHEMICAL NEMATICIDES MARKET, BY TYPE, 2025–2030 (TON)
TABLE 280
FRANCE: NON-FUMIGANT NEMATICIDES MARKET, BY TYPE, 2020–2024 (USD MILLION)
TABLE 281
FRANCE: NON-FUMIGANT NEMATICIDES MARKET, BY TYPE, 2025–2030 (USD MILLION)
TABLE 282
FRANCE: NEMATICIDES MARKET, BY CROP TYPE, 2020–2024 (USD MILLION)
TABLE 283
FRANCE: NEMATICIDES MARKET, BY CROP TYPE, 2025–2030 (USD MILLION)
TABLE 284
SPAIN: NEMATICIDES MARKET, BY TYPE, 2020–2024 (USD MILLION)
TABLE 285
SPAIN: NEMATICIDES MARKET, BY TYPE, 2025–2030 (USD MILLION)
TABLE 286
SPAIN: NEMATICIDES MARKET, BY TYPE, 2020–2024 (TON)
TABLE 287
SPAIN: NEMATICIDES MARKET, BY TYPE, 2025–2030 (TON)
TABLE 288
SPAIN: CHEMICAL NEMATICIDES MARKET, BY TYPE, 2020–2024 (USD MILLION)
TABLE 289
SPAIN: CHEMICAL NEMATICIDES MARKET, BY TYPE, 2025–2030 (USD MILLION)
TABLE 290
SPAIN: CHEMICAL NEMATICIDES MARKET, BY TYPE, 2020–2024 (TON)
TABLE 291
SPAIN: CHEMICAL NEMATICIDES MARKET, BY TYPE, 2025–2030 (TON)
TABLE 292
SPAIN: NON-FUMIGANT NEMATICIDES MARKET, BY TYPE, 2020–2024 (USD MILLION)
TABLE 293
SPAIN: NON-FUMIGANT NEMATICIDES MARKET, BY TYPE, 2025–2030 (USD MILLION)
TABLE 294
SPAIN: NEMATICIDES MARKET, BY CROP TYPE, 2020–2024 (USD MILLION)
TABLE 295
SPAIN: NEMATICIDES MARKET, BY CROP TYPE, 2025–2030 (USD MILLION)
TABLE 296
ITALY: NEMATICIDES MARKET, BY TYPE, 2020–2024 (USD MILLION)
TABLE 297
ITALY: NEMATICIDES MARKET, BY TYPE, 2025–2030 (USD MILLION)
TABLE 298
ITALY: NEMATICIDES MARKET, BY TYPE, 2020–2024 (TON)
TABLE 299
ITALY: NEMATICIDES MARKET, BY TYPE, 2025–2030 (TON)
TABLE 300
ITALY: CHEMICAL NEMATICIDES MARKET, BY TYPE, 2020–2024 (USD MILLION)
TABLE 301
ITALY: CHEMICAL NEMATICIDES MARKET, BY TYPE, 2025–2030 (USD MILLION)
TABLE 302
ITALY: CHEMICAL NEMATICIDES MARKET, BY TYPE, 2020–2024 (TON)
TABLE 303
ITALY: CHEMICAL NEMATICIDES MARKET, BY TYPE, 2025–2030 (TON)
TABLE 304
ITALY: NON-FUMIGANT NEMATICIDES MARKET, BY TYPE, 2020–2024 (USD MILLION)
TABLE 305
ITALY: NON-FUMIGANT NEMATICIDES MARKET, BY TYPE, 2025–2030 (USD MILLION)
TABLE 306
ITALY: NEMATICIDES MARKET, BY CROP TYPE, 2020–2024 (USD MILLION)
TABLE 307
ITALY: NEMATICIDES MARKET, BY CROP TYPE, 2025–2030 (USD MILLION)
TABLE 308
REST OF EUROPE: NEMATICIDES MARKET, BY TYPE, 2020–2024 (USD MILLION)
TABLE 309
REST OF EUROPE: NEMATICIDES MARKET, BY TYPE, 2025–2030 (USD MILLION)
TABLE 310
REST OF EUROPE: NEMATICIDES MARKET, BY TYPE, 2020–2024 (TON)
TABLE 311
REST OF EUROPE: NEMATICIDES MARKET, BY TYPE, 2025–2030 (TON)
TABLE 312
REST OF EUROPE: CHEMICAL NEMATICIDES MARKET, BY TYPE, 2020–2024 (USD MILLION)
TABLE 313
REST OF EUROPE: CHEMICAL NEMATICIDES MARKET, BY TYPE, 2025–2030 (USD MILLION)
TABLE 314
REST OF EUROPE: CHEMICAL NEMATICIDES MARKET, BY TYPE, 2020–2024 (TON)
TABLE 315
REST OF EUROPE: CHEMICAL NEMATICIDES MARKET, BY TYPE, 2025–2030 (TON)
TABLE 316
REST OF EUROPE: NON-FUMIGANT NEMATICIDES MARKET, BY TYPE, 2020–2024 (USD MILLION)
TABLE 317
REST OF EUROPE: NON-FUMIGANT NEMATICIDES MARKET, BY TYPE, 2025–2030 (USD MILLION)
TABLE 318
REST OF EUROPE: NEMATICIDES MARKET, BY CROP TYPE, 2020–2024 (USD MILLION)
TABLE 319
REST OF EUROPE: NEMATICIDES MARKET, BY CROP TYPE, 2025–2030 (USD MILLION)
TABLE 320
ASIA PACIFIC: NEMATICIDES MARKET, BY COUNTRY, 2020–2024 (USD MILLION)
TABLE 321
ASIA PACIFIC: NEMATICIDES MARKET, BY COUNTRY, 2025–2030 (USD MILLION)
TABLE 322
ASIA PACIFIC: NEMATICIDES MARKET, BY COUNTRY, 2020–2024 (TON)
TABLE 323
ASIA PACIFIC: NEMATICIDES MARKET, BY COUNTRY, 2025–2030 (TON)
TABLE 324
ASIA PACIFIC: NEMATICIDES MARKET, BY CROP TYPE, 2020–2024 (USD MILLION)
TABLE 325
ASIA PACIFIC: NEMATICIDES MARKET, BY CROP TYPE, 2025–2030 (USD MILLION)
TABLE 326
ASIA PACIFIC: NEMATICIDES MARKET, BY NEMATODE TYPE, 2020–2024 (USD MILLION)
TABLE 327
ASIA PACIFIC: NEMATICIDES MARKET, BY NEMATODE TYPE, 2025–2030 (USD MILLION)
TABLE 328
ASIA PACIFIC: NEMATICIDES MARKET, BY FORMULATION, 2020–2024 (USD MILLION)
TABLE 329
ASIA PACIFIC: NEMATICIDES MARKET, BY FORMULATION, 2025–2030 (USD MILLION)
TABLE 330
ASIA PACIFIC: NEMATICIDES MARKET, BY TYPE, 2020–2024 (USD MILLION)
TABLE 331
ASIA PACIFIC: NEMATICIDES MARKET, BY TYPE, 2025–2030 (USD MILLION)
TABLE 332
ASIA PACIFIC: NEMATICIDES MARKET, BY TYPE, 2020–2024 (TON)
TABLE 333
ASIA PACIFIC: NEMATICIDES MARKET, BY TYPE, 2025–2030 (TON)
TABLE 334
ASIA PACIFIC: CHEMICAL NEMATICIDES MARKET, BY TYPE, 2020–2024 (USD MILLION)
TABLE 335
ASIA PACIFIC: CHEMICAL NEMATICIDES MARKET, BY TYPE, 2025–2030 (USD MILLION)
TABLE 336
ASIA PACIFIC: CHEMICAL NEMATICIDES MARKET, BY TYPE, 2020–2024 (TON)
TABLE 337
ASIA PACIFIC: CHEMICAL NEMATICIDES MARKET, BY TYPE, 2025–2030 (TON)
TABLE 338
ASIA PACIFIC: NON-FUMIGANT NEMATICIDES MARKET, BY TYPE, 2020–2024 (USD MILLION)
TABLE 339
ASIA PACIFIC: NON-FUMIGANT NEMATICIDES MARKET, BY TYPE, 2025–2030 (USD MILLION)
TABLE 340
ASIA PACIFIC: NON-FUMIGANT NEMATICIDES MARKET, BY TYPE, 2020–2024 (TON)
TABLE 341
ASIA PACIFIC: NON-FUMIGANT NEMATICIDES MARKET, BY TYPE, 2025–2030 (TON)
TABLE 342
ASIA PACIFIC: BIOLOGICAL NEMATICIDES MARKET, BY TYPE, 2020–2024 (USD MILLION)
TABLE 343
ASIA PACIFIC: BIOLOGICAL NEMATICIDES MARKET, BY TYPE, 2025–2030 (USD MILLION)
TABLE 344
ASIA PACIFIC: NEMATICIDES MARKET, BY MODE OF APPLICATION, 2020–2024 (USD MILLION)
TABLE 345
ASIA PACIFIC: NEMATICIDES MARKET, BY MODE OF APPLICATION, 2025–2030 (USD MILLION)
TABLE 346
ASIA PACIFIC: NEMATICIDES MARKET, BY MODE OF APPLICATION, 2020–2024 (TON)
TABLE 347
ASIA PACIFIC: NEMATICIDES MARKET, BY MODE OF APPLICATION, 2025–2030 (TON)
TABLE 348
CHINA: NEMATICIDES MARKET, BY TYPE, 2020–2024 (USD MILLION)
TABLE 349
CHINA: NEMATICIDES MARKET, BY TYPE, 2025–2030 (USD MILLION)
TABLE 350
CHINA: NEMATICIDES MARKET, BY TYPE, 2020–2024 (TON)
TABLE 351
CHINA: NEMATICIDES MARKET, BY TYPE, 2025–2030 (TON)
TABLE 352
CHINA: CHEMICAL NEMATICIDES MARKET, BY TYPE, 2020–2024 (USD MILLION)
TABLE 353
CHINA: CHEMICAL NEMATICIDES MARKET, BY TYPE, 2025–2030 (USD MILLION)
TABLE 354
CHINA: CHEMICAL NEMATICIDES MARKET, BY TYPE, 2020–2024 (TON)
TABLE 355
CHINA: CHEMICAL NEMATICIDES MARKET, BY TYPE, 2025–2030 (TON)
TABLE 356
CHINA: NON-FUMIGANT NEMATICIDES MARKET, BY TYPE, 2020–2024 (USD MILLION)
TABLE 357
CHINA: NON-FUMIGANT NEMATICIDES MARKET, BY TYPE, 2025–2030 (USD MILLION)
TABLE 358
CHINA: NEMATICIDES MARKET, BY CROP TYPE, 2020–2024 (USD MILLION)
TABLE 359
CHINA: NEMATICIDES MARKET, BY CROP TYPE, 2025–2030 (USD MILLION)
TABLE 360
JAPAN: MAJOR CROPS INFESTED BY NEMATODES
TABLE 361
JAPAN: NEMATICIDES MARKET, BY TYPE, 2020–2024 (USD MILLION)
TABLE 362
JAPAN: NEMATICIDES MARKET, BY TYPE, 2025–2030 (USD MILLION)
TABLE 363
JAPAN: NEMATICIDES MARKET, BY TYPE, 2020–2024 (TON)
TABLE 364
JAPAN: NEMATICIDES MARKET, BY TYPE, 2025–2030 (TON)
TABLE 365
JAPAN: CHEMICAL NEMATICIDES MARKET, BY TYPE, 2020–2024 (USD MILLION)
TABLE 366
JAPAN: CHEMICAL NEMATICIDES MARKET, BY TYPE, 2025–2030 (USD MILLION)
TABLE 367
JAPAN: CHEMICAL NEMATICIDES MARKET, BY TYPE, 2020–2024 (TON)
TABLE 368
JAPAN: CHEMICAL NEMATICIDES MARKET, BY TYPE, 2025–2030 (TON)
TABLE 369
JAPAN: NON-FUMIGANT NEMATICIDES MARKET, BY TYPE, 2020–2024 (USD MILLION)
TABLE 370
JAPAN: NON-FUMIGANT NEMATICIDES MARKET, BY TYPE, 2025–2030 (USD MILLION)
TABLE 371
JAPAN: NEMATICIDES MARKET, BY CROP TYPE, 2020–2024 (USD MILLION)
TABLE 372
JAPAN: NEMATICIDES MARKET, BY CROP TYPE, 2025–2030 (USD MILLION)
TABLE 373
INDIA: NEMATICIDES MARKET, BY TYPE, 2020–2024 (USD MILLION)
TABLE 374
INDIA: NEMATICIDES MARKET, BY TYPE, 2025–2030 (USD MILLION)
TABLE 375
INDIA: NEMATICIDES MARKET, BY TYPE, 2020–2024 (TON)
TABLE 376
INDIA: NEMATICIDES MARKET, BY TYPE, 2025–2030 (TON)
TABLE 377
INDIA: CHEMICAL NEMATICIDES MARKET, BY TYPE, 2020–2024 (USD MILLION)
TABLE 378
INDIA: CHEMICAL NEMATICIDES MARKET, BY TYPE, 2025–2030 (USD MILLION)
TABLE 379
INDIA: CHEMICAL NEMATICIDES MARKET, BY TYPE, 2020–2024 (TON)
TABLE 380
INDIA: CHEMICAL NEMATICIDES MARKET, BY TYPE, 2025–2030 (TON)
TABLE 381
INDIA: NON-FUMIGANT NEMATICIDES MARKET, BY TYPE, 2020–2024 (USD MILLION)
TABLE 382
INDIA: NON-FUMIGANT NEMATICIDES MARKET, BY TYPE, 2025–2030 (USD MILLION)
TABLE 383
INDIA: NEMATICIDES MARKET, BY CROP TYPE, 2020–2024 (USD MILLION)
TABLE 384
INDIA: NEMATICIDES MARKET, BY CROP TYPE, 2025–2030 (USD MILLION)
TABLE 385
AUSTRALIA & NEW ZEALAND: NEMATICIDES MARKET, BY TYPE, 2020–2024 (USD MILLION)
TABLE 386
AUSTRALIA & NEW ZEALAND: NEMATICIDES MARKET, BY TYPE, 2025–2030 (USD MILLION)
TABLE 387
AUSTRALIA & NEW ZEALAND: NEMATICIDES MARKET, BY TYPE, 2020–2024 (TON)
TABLE 388
AUSTRALIA & NEW ZEALAND: NEMATICIDES MARKET, BY TYPE, 2025–2030 (TON)
TABLE 389
AUSTRALIA & NEW ZEALAND: CHEMICAL NEMATICIDES MARKET, BY TYPE, 2020–2024 (USD MILLION)
TABLE 390
AUSTRALIA & NEW ZEALAND: CHEMICAL NEMATICIDES MARKET, BY TYPE, 2025–2030 (USD MILLION)
TABLE 391
AUSTRALIA & NEW ZEALAND: CHEMICAL NEMATICIDES MARKET, BY TYPE, 2020–2024 (TON)
TABLE 392
AUSTRALIA & NEW ZEALAND: CHEMICAL NEMATICIDES MARKET, BY TYPE, 2025–2030 (TON)
TABLE 393
AUSTRALIA & NEW ZEALAND: NON-FUMIGANT NEMATICIDES MARKET, BY TYPE, 2020–2024 (USD MILLION)
TABLE 394
AUSTRALIA & NEW ZEALAND: NON-FUMIGANT NEMATICIDES MARKET, BY TYPE, 2025–2030 (USD MILLION)
TABLE 395
AUSTRALIA & NEW ZEALAND: NEMATICIDES MARKET, BY CROP TYPE, 2020–2024 (USD MILLION)
TABLE 396
AUSTRALIA & NEW ZEALAND: NEMATICIDES MARKET, BY CROP TYPE, 2025–2030 (USD MILLION)
TABLE 397
REST OF ASIA PACIFIC: NEMATICIDES MARKET, BY TYPE, 2020–2024 (USD MILLION)
TABLE 398
REST OF ASIA PACIFIC: NEMATICIDES MARKET, BY TYPE,2025–2030 (USD MILLION)
TABLE 399
REST OF ASIA PACIFIC: NEMATICIDES MARKET, BY TYPE, 2020–2024 (TON)
TABLE 400
REST OF ASIA PACIFIC: NEMATICIDES MARKET, BY TYPE, 2025–2030 (TON)
TABLE 401
REST OF ASIA PACIFIC: CHEMICAL NEMATICIDES MARKET, BY TYPE, 2020–2024 (USD MILLION)
TABLE 402
REST OF ASIA PACIFIC: CHEMICAL NEMATICIDES MARKET, BY TYPE, 2025–2030 (USD MILLION)
TABLE 403
REST OF ASIA PACIFIC: CHEMICAL NEMATICIDES MARKET, BY TYPE, 2020–2024 (TON)
TABLE 404
REST OF ASIA PACIFIC: CHEMICAL NEMATICIDES MARKET, BY TYPE, 2025–2030 (TON)
TABLE 405
REST OF ASIA PACIFIC: NON-FUMIGANT NEMATICIDES MARKET, BY TYPE, 2020–2024 (USD MILLION)
TABLE 406
REST OF ASIA PACIFIC: NON-FUMIGANT NEMATICIDES MARKET, BY TYPE, 2025–2030 (USD MILLION)
TABLE 407
REST OF ASIA PACIFIC: NEMATICIDES MARKET, BY CROP TYPE, 2020–2024 (USD MILLION)
TABLE 408
REST OF ASIA PACIFIC: NEMATICIDES MARKET, BY CROP TYPE, 2025–2030 (USD MILLION)
TABLE 409
SOUTH AMERICA: NEMATICIDES MARKET, BY COUNTRY, 2020–2024 (USD MILLION)
TABLE 410
SOUTH AMERICA: NEMATICIDES MARKET, BY COUNTRY, 2025–2030 (USD MILLION)
TABLE 411
SOUTH AMERICA: NEMATICIDES MARKET, BY COUNTRY, 2020–2024 (TON)
TABLE 412
SOUTH AMERICA: NEMATICIDES MARKET, BY COUNTRY, 2025–2030 (TON)
TABLE 413
SOUTH AMERICA: NEMATICIDES MARKET, BY CROP TYPE, 2020–2024 (USD MILLION)
TABLE 414
SOUTH AMERICA: NEMATICIDES MARKET, BY CROP TYPE, 2025–2030 (USD MILLION)
TABLE 415
SOUTH AMERICA: NEMATICIDES MARKET, BY NEMATODE TYPE, 2020–2024 (USD MILLION)
TABLE 416
SOUTH AMERICA: NEMATICIDES MARKET, BY NEMATODE TYPE, 2025–2030 (USD MILLION)
TABLE 417
SOUTH AMERICA: NEMATICIDES MARKET, BY FORMULATION, 2020–2024 (USD MILLION)
TABLE 418
SOUTH AMERICA: NEMATICIDES MARKET, BY FORMULATION,2025–2030 (USD MILLION)
TABLE 419
SOUTH AMERICA: NEMATICIDES MARKET, BY TYPE, 2020–2024 (USD MILLION)
TABLE 420
SOUTH AMERICA: NEMATICIDES MARKET, BY TYPE, 2025–2030 (USD MILLION)
TABLE 421
SOUTH AMERICA: NEMATICIDES MARKET, BY TYPE, 2020–2024 (TON)
TABLE 422
SOUTH AMERICA: NEMATICIDES MARKET, BY TYPE, 2025–2030 (TON)
TABLE 423
SOUTH AMERICA: CHEMICAL NEMATICIDES MARKET, BY TYPE, 2020–2024 (USD MILLION)
TABLE 424
SOUTH AMERICA: CHEMICAL NEMATICIDES MARKET, BY TYPE, 2025–2030 (USD MILLION)
TABLE 425
SOUTH AMERICA: CHEMICAL NEMATICIDES MARKET, BY TYPE, 2020–2024 (TON)
TABLE 426
SOUTH AMERICA: CHEMICAL NEMATICIDES MARKET, BY TYPE, 2025–2030 (TON)
TABLE 427
SOUTH AMERICA: NON-FUMIGANT NEMATICIDES MARKET, BY TYPE, 2020–2024 (USD MILLION)
TABLE 428
SOUTH AMERICA: NON-FUMIGANT NEMATICIDES MARKET, BY TYPE, 2025–2030 (USD MILLION)
TABLE 429
SOUTH AMERICA: NON-FUMIGANT NEMATICIDES MARKET, BY TYPE, 2020–2024 (TON)
TABLE 430
SOUTH AMERICA: NON-FUMIGANT NEMATICIDES MARKET, BY TYPE, 2025–2030 (TON)
TABLE 431
SOUTH AMERICA: BIOLOGICAL NEMATICIDES MARKET, BY TYPE, 2020–2024 (USD MILLION)
TABLE 432
SOUTH AMERICA: BIOLOGICAL NEMATICIDES MARKET, BY TYPE,2025–2030 (USD MILLION)
TABLE 433
SOUTH AMERICA: NEMATICIDES MARKET, BY MODE OF APPLICATION, 2020–2024 (USD MILLION)
TABLE 434
SOUTH AMERICA: NEMATICIDES MARKET, BY MODE OF APPLICATION, 2025–2030 (USD MILLION)
TABLE 435
SOUTH AMERICA: NEMATICIDES MARKET, BY MODE OF APPLICATION, 2020–2024 (TON)
TABLE 436
SOUTH AMERICA: NEMATICIDES MARKET, BY MODE OF APPLICATION, 2025–2030 (TON)
TABLE 437
ARGENTINA: NEMATICIDES MARKET, BY TYPE, 2020–2024 (USD MILLION)
TABLE 438
ARGENTINA: NEMATICIDES MARKET, BY TYPE, 2025–2030 (USD MILLION)
TABLE 439
ARGENTINA: NEMATICIDES MARKET, BY TYPE, 2020–2024 (TON)
TABLE 440
ARGENTINA: NEMATICIDES MARKET, BY TYPE, 2025–2030 (TON)
TABLE 441
ARGENTINA: CHEMICAL NEMATICIDES MARKET, BY TYPE, 2020–2024 (USD MILLION)
TABLE 442
ARGENTINA: CHEMICAL NEMATICIDES MARKET, BY TYPE, 2025–2030 (USD MILLION)
TABLE 443
ARGENTINA: CHEMICAL NEMATICIDES MARKET, BY TYPE, 2020–2024 (TON)
TABLE 444
ARGENTINA: CHEMICAL NEMATICIDES MARKET, BY TYPE, 2025–2030 (TON)
TABLE 445
ARGENTINA: NON-FUMIGANT NEMATICIDES MARKET, BY TYPE,2020–2024 (USD MILLION)
TABLE 446
ARGENTINA: NON-FUMIGANT NEMATICIDES MARKET, BY TYPE, 2025–2030 (USD MILLION)
TABLE 447
ARGENTINA: NEMATICIDES MARKET, BY CROP TYPE, 2020–2024 (USD MILLION)
TABLE 448
ARGENTINA: NEMATICIDES MARKET, BY CROP TYPE, 2025–2030 (USD MILLION)
TABLE 449
BRAZIL: MOST PREVALENT NEMATODE SPECIES
TABLE 450
BRAZIL: NEMATICIDES MARKET, BY TYPE, 2020–2024 (USD MILLION)
TABLE 451
BRAZIL: NEMATICIDES MARKET, BY TYPE, 2025–2030 (USD MILLION)
TABLE 452
BRAZIL: NEMATICIDES MARKET, BY TYPE, 2020–2024 (TON)
TABLE 453
BRAZIL: NEMATICIDES MARKET, BY TYPE, 2025–2030 (TON)
TABLE 454
BRAZIL: CHEMICAL NEMATICIDES MARKET, BY TYPE, 2020–2024 (USD MILLION)
TABLE 455
BRAZIL: CHEMICAL NEMATICIDES MARKET, BY TYPE, 2025–2030 (USD MILLION)
TABLE 456
BRAZIL: CHEMICAL NEMATICIDES MARKET, BY TYPE, 2020–2024 (TON)
TABLE 457
BRAZIL: CHEMICAL NEMATICIDES MARKET, BY TYPE, 2025–2030 (TON)
TABLE 458
BRAZIL: NON-FUMIGANT NEMATICIDES MARKET, BY TYPE, 2020–2024 (USD MILLION)
TABLE 459
BRAZIL: NON-FUMIGANT NEMATICIDES MARKET, BY TYPE, 2025–2030 (USD MILLION)
TABLE 460
BRAZIL: NEMATICIDES MARKET, BY CROP TYPE, 2020–2024 (USD MILLION)
TABLE 461
BRAZIL: NEMATICIDES MARKET, BY CROP TYPE, 2025–2030 (USD MILLION)
TABLE 462
REST OF SOUTH AMERICA: NEMATICIDES MARKET, BY TYPE, 2020–2024 (USD MILLION)
TABLE 463
REST OF SOUTH AMERICA: NEMATICIDES MARKET, BY TYPE, 2025–2030 (USD MILLION)
TABLE 464
REST OF SOUTH AMERICA: NEMATICIDES MARKET, BY TYPE, 2020–2024 (TON)
TABLE 465
REST OF SOUTH AMERICA: NEMATICIDES MARKET, BY TYPE, 2025–2030 (TON)
TABLE 466
REST OF SOUTH AMERICA: CHEMICAL NEMATICIDES MARKET, BY TYPE,2020–2024 (USD MILLION)
TABLE 467
REST OF SOUTH AMERICA: CHEMICAL NEMATICIDES MARKET, BY TYPE, 2025–2030 (USD MILLION)
TABLE 468
REST OF SOUTH AMERICA: CHEMICAL NEMATICIDES MARKET, BY TYPE, 2020–2024 (TON)
TABLE 469
REST OF SOUTH AMERICA: CHEMICAL NEMATICIDES MARKET, BY TYPE, 2025–2030 (TON)
TABLE 470
REST OF SOUTH AMERICA: NON-FUMIGANT NEMATICIDES MARKET, BY TYPE, 2020–2024 (USD MILLION)
TABLE 471
REST OF SOUTH AMERICA: NON-FUMIGANT NEMATICIDES MARKET, BY TYPE, 2025–2030 (USD MILLION)
TABLE 472
REST OF SOUTH AMERICA: NEMATICIDES MARKET, BY CROP TYPE, 2020–2024 (USD MILLION)
TABLE 473
REST OF SOUTH AMERICA: NEMATICIDES MARKET, BY CROP TYPE, 2025–2030 (USD MILLION)
TABLE 474
ROW: NEMATICIDES MARKET, BY REGION, 2020–2024 (USD MILLION)
TABLE 475
ROW: NEMATICIDES MARKET, BY REGION, 2025–2030 (USD MILLION)
TABLE 476
ROW: NEMATICIDES MARKET, BY REGION, 2020–2024 (TON)
TABLE 477
ROW: NEMATICIDES MARKET, BY REGION, 2025–2030 (TON)
TABLE 478
ROW: NEMATICIDES MARKET, BY CROP TYPE, 2020–2024 (USD MILLION)
TABLE 479
ROW: NEMATICIDES MARKET, BY CROP TYPE, 2025–2030 (USD MILLION)
TABLE 480
ROW: NEMATICIDES MARKET, BY NEMATODE TYPE, 2020–2024 (USD MILLION)
TABLE 481
ROW: NEMATICIDES MARKET, BY NEMATODE TYPE, 2025–2030 (USD MILLION)
TABLE 482
ROW: NEMATICIDES MARKET, BY FORMULATION, 2020–2024 (USD MILLION)
TABLE 483
ROW: NEMATICIDES MARKET, BY FORMULATION, 2025–2030 (USD MILLION)
TABLE 484
ROW: NEMATICIDES MARKET, BY TYPE, 2020–2024 (USD MILLION)
TABLE 485
ROW: NEMATICIDES MARKET, BY TYPE, 2025–2030 (USD MILLION)
TABLE 486
ROW: NEMATICIDES MARKET, BY TYPE, 2020–2024 (TON)
TABLE 487
ROW: NEMATICIDES MARKET, BY TYPE, 2025–2030 (TON)
TABLE 488
ROW: CHEMICAL NEMATICIDES MARKET, BY TYPE, 2020–2024 (USD MILLION)
TABLE 489
ROW: CHEMICAL NEMATICIDES MARKET, BY TYPE, 2025–2030 (USD MILLION)
TABLE 490
ROW: CHEMICAL NEMATICIDES MARKET, BY TYPE, 2020–2024 (TON)
TABLE 491
ROW: CHEMICAL NEMATICIDES MARKET, BY TYPE, 2025–2030 (TON)
TABLE 492
ROW: NON-FUMIGANT NEMATICIDES MARKET, BY TYPE, 2020–2024 (USD MILLION)
TABLE 493
ROW: NON-FUMIGANT NEMATICIDES MARKET, BY TYPE, 2025–2030 (USD MILLION)
TABLE 494
ROW: NON-FUMIGANT NEMATICIDES MARKET, BY TYPE, 2020–2024 (TON)
TABLE 495
ROW: NON-FUMIGANT NEMATICIDES MARKET, BY TYPE, 2025–2030 (TON)
TABLE 496
ROW: BIOLOGICAL NEMATICIDES MARKET, BY TYPE, 2020–2024 (USD MILLION)
TABLE 497
ROW: BIOLOGICAL NEMATICIDES MARKET, BY TYPE, 2025–2030 (USD MILLION)
TABLE 498
ROW: NEMATICIDES MARKET, BY MODE OF APPLICATION, 2020–2024 (USD MILLION)
TABLE 499
ROW: NEMATICIDES MARKET, BY MODE OF APPLICATION, 2025–2030 (USD MILLION)
TABLE 500
ROW: NEMATICIDES MARKET, BY MODE OF APPLICATION, 2020–2024 (TON)
TABLE 501
ROW: NEMATICIDES MARKET, BY MODE OF APPLICATION, 2025–2030 (TON)
TABLE 502
MIDDLE EAST: NEMATICIDES MARKET, BY TYPE, 2020–2024 (USD MILLION)
TABLE 503
MIDDLE EAST: NEMATICIDES MARKET, BY TYPE, 2025–2030 (USD MILLION)
TABLE 504
MIDDLE EAST: NEMATICIDES MARKET, BY TYPE, 2020–2024 (TON)
TABLE 505
MIDDLE EAST: NEMATICIDES MARKET, BY TYPE, 2025–2030 (TON)
TABLE 506
MIDDLE EAST: CHEMICAL NEMATICIDES MARKET, BY TYPE, 2020–2024 (USD MILLION)
TABLE 507
MIDDLE EAST: CHEMICAL NEMATICIDES MARKET, BY TYPE, 2025–2030 (USD MILLION)
TABLE 508
MIDDLE EAST: CHEMICAL NEMATICIDES MARKET, BY TYPE, 2020–2024 (TON)
TABLE 509
MIDDLE EAST: CHEMICAL NEMATICIDES MARKET, BY TYPE, 2025–2030 (TON)
TABLE 510
MIDDLE EAST: NON-FUMIGANT NEMATICIDES MARKET, BY TYPE, 2020–2024 (USD MILLION)
TABLE 511
MIDDLE EAST: NON-FUMIGANT NEMATICIDES MARKET, BY TYPE, 2025–2030 (USD MILLION)
TABLE 512
MIDDLE EAST: NEMATICIDES MARKET, BY CROP TYPE, 2020–2024 (USD MILLION)
TABLE 513
MIDDLE EAST: NEMATICIDES MARKET, BY CROP TYPE, 2025–2030 (USD MILLION)
TABLE 514
SOUTH AFRICA: POPULAR WEED SPECIES AS HOSTS OF ROOT-KNOT NEMATODES
TABLE 515
AFRICA: NEMATICIDES MARKET, BY TYPE, 2020–2024 (USD MILLION)
TABLE 516
AFRICA: NEMATICIDES MARKET, BY TYPE, 2025–2030 (USD MILLION)
TABLE 517
AFRICA: NEMATICIDES MARKET, BY TYPE, 2020–2024 (TON)
TABLE 518
AFRICA: NEMATICIDES MARKET, BY TYPE, 2025–2030 (TON)
TABLE 519
AFRICA: CHEMICAL NEMATICIDES MARKET, BY TYPE, 2020–2024 (USD MILLION)
TABLE 520
AFRICA: CHEMICAL NEMATICIDES MARKET, BY TYPE, 2025–2030 (USD MILLION)
TABLE 521
AFRICA: CHEMICAL NEMATICIDES MARKET, BY TYPE, 2020–2024 (TON)
TABLE 522
AFRICA: CHEMICAL NEMATICIDES MARKET, BY TYPE, 2025–2030 (TON)
TABLE 523
AFRICA: NON-FUMIGANT NEMATICIDES MARKET, BY TYPE, 2020–2024 (USD MILLION)
TABLE 524
AFRICA: NON-FUMIGANT NEMATICIDES MARKET, BY TYPE, 2025–2030 (USD MILLION)
TABLE 525
AFRICA: NEMATICIDES MARKET, BY CROP TYPE, 2020–2024 (USD MILLION)
TABLE 526
AFRICA: NEMATICIDES MARKET, BY CROP TYPE, 2025–2030 (USD MILLION)
TABLE 527
OVERVIEW OF STRATEGIES ADOPTED BY KEY PLAYERS IN NEMATICIDES MARKET, 2020–2025
TABLE 528
NEMATICIDES MARKET: DEGREE OF COMPETITION
TABLE 529
NEMATICIDES MARKET: REGION FOOTPRINT
TABLE 530
NEMATICIDES MARKET: TYPE FOOTPRINT
TABLE 531
NEMATICIDES MARKET: FORMULATION FOOTPRINT
TABLE 532
NEMATICIDES MARKET: CROP TYPE FOOTPRINT
TABLE 533
NEMATICIDES MARKET: KEY STARTUPS/SMES
TABLE 534
NEMATICIDES MARKET: COMPETITIVE BENCHMARKING OF KEY STARTUPS/SMES, 2024
TABLE 535
NEMATICIDES MARKET: PRODUCT/SERVICE LAUNCHES, JANUARY 2020– JULY 2025
TABLE 536
NEMATICIDES MARKET: DEALS, JANUARY 2020–JULY 2025
TABLE 537
NEMATICIDES MARKET: EXPANSIONS, JANUARY 2020–JULY 2025
TABLE 538
BASF SE: COMPANY OVERVIEW
TABLE 539
BASF SE: PRODUCTS OFFERED
TABLE 540
BASF SE: PRODUCT LAUNCHES
TABLE 541
SYNGENTA: COMPANY OVERVIEW
TABLE 542
SYNGENTA: PRODUCTS OFFERED
TABLE 543
SYNGENTA: PRODUCT LAUNCHES
TABLE 544
CORTEVA: COMPANY OVERVIEW
TABLE 545
CORTEVA: PRODUCTS OFFERED
TABLE 546
CORTEVA: PRODUCT LAUNCHES
TABLE 547
CORTEVA: EXPANSIONS
TABLE 548
UPL: COMPANY OVERVIEW
TABLE 549
UPL: PRODUCTS OFFERED
TABLE 550
UPL: PRODUCT LAUNCHES
TABLE 552
BAYER AG: COMPANY OVERVIEW
TABLE 553
BAYER AG: PRODUCTS OFFERED
TABLE 554
FMC CORPORATION: COMPANY OVERVIEW
TABLE 555
FMC CORPORATION: PRODUCTS OFFERED
TABLE 556
FMC CORPORATION: DEALS
TABLE 557
FMC CORPORATION: EXPANSIONS
TABLE 558
SUMITOMO CHEMICAL CO., LTD: COMPANY OVERVIEW
TABLE 559
SUMITOMO CHEMICAL CO., LTD.: PRODUCTS OFFERED
TABLE 560
SUMITOMO CHEMICAL CO., LTD.: DEALS
TABLE 561
SUMITOMO CHEMICAL CO., LTD.: EXPANSIONS
TABLE 562
NUFARM: COMPANY OVERVIEW
TABLE 563
NUFARM: PRODUCTS OFFERED
TABLE 564
NUFARM: OTHER DEVELOPMENTS
TABLE 565
AMERICAN VANGUARD CORPORATION: COMPANY OVERVIEW
TABLE 566
AMERICAN VANGUARD CORPORATION: PRODUCTS OFFERED
TABLE 567
AMERICAN VANGUARD CORPORATION: DEALS
TABLE 568
NOVONESIS GROUP: COMPANY OVERVIEW
TABLE 569
NOVONESIS GROUP: PRODUCTS OFFERED
TABLE 570
NOVONESIS GROUP: DEALS
TABLE 571
BIOCERES CROP SOLUTIONS: COMPANY OVERVIEW
TABLE 572
BIOCERES CROP SOLUTIONS: PRODUCTS OFFERED
TABLE 573
BIOCERES CROP SOLUTIONS: PRODUCT LAUNCHES
TABLE 574
BIOCERES CROP SOLUTIONS: DEALS
TABLE 575
GOWAN COMPANY: COMPANY OVERVIEW
TABLE 576
GOWAN COMPANY: PRODUCTS OFFERED
TABLE 577
CERTIS USA L.L.C.: COMPANY OVERVIEW
TABLE 578
CERTIS USA L.L.C.: PRODUCTS OFFERED
TABLE 579
CERTIS USA L.L.C.: DEALS
TABLE 580
CERTIS USA L.L.C.: OTHER DEVELOPMENTS
TABLE 581
LALLEMAND INC: COMPANY OVERVIEW
TABLE 582
LALLEMAND INC: PRODUCTS OFFERED
TABLE 583
LALLEMAND INC: PRODUCT LAUNCHES
TABLE 584
AECI PLANT HEALTH: COMPANY OVERVIEW
TABLE 585
AECI PLANT HEALTH: PRODUCTS OFFERED
TABLE 586
ANDERMATT GROUP AG: COMPANY OVERVIEW
TABLE 587
ANDERMATT GROUP AG: PRODUCTS OFFERED
TABLE 588
IPL BIOLOGICALS: COMPANY OVERVIEW
TABLE 589
IPL BIOLOGICALS: PRODUCTS OFFERED
TABLE 590
IPL BIOLOGICALS: EXPANSIONS
TABLE 591
PHERONYM, INC.: COMPANY OVERVIEW
TABLE 592
PHERONYM, INC.: PRODUCTS OFFERED
TABLE 593
AGRILIFE: COMPANY OVERVIEW
TABLE 594
AGRILIFE: PRODUCTS OFFERED
TABLE 595
CROP IQ TECHNOLOGY LTD: COMPANY OVERVIEW
TABLE 596
CROP IQ TECHNOLOGY LTD: PRODUCTS OFFERED
TABLE 597
CROP IQ TECHNOLOGY LTD: EXPANSIONS
TABLE 598
ROVENSA NEXT: COMPANY OVERVIEW
TABLE 599
BIONEMA: COMPANY OVERVIEW
TABLE 600
BIOCONSORTIA: COMPANY OVERVIEW
TABLE 601
VIVE CROP PROTECTION INC.: COMPANY OVERVIEW
TABLE 602
VEGALAB SA: COMPANY OVERVIEW
TABLE 603
ADJACENT MARKETS TO NEMATICIDES
TABLE 604
CROP PROTECTION CHEMICALS MARKET, BY TYPE, 2019–2023 (USD MILLION)
TABLE 605
CROP PROTECTION CHEMICALS MARKET, BY TYPE, 2024–2029 (USD MILLION)
TABLE 606
CROP PROTECTION CHEMICALS MARKET, BY TYPE, 2019–2023 (KT)
TABLE 607
CROP PROTECTION CHEMICALS MARKET, BY TYPE, 2024–2029 (KT)
TABLE 608
LIST OF PLANT PRODUCTS REGISTERED AS BIOPESTICIDES
TABLE 609
BIORATIONAL PESTICIDES MARKET, BY SOURCE, 2018–2022 (USD MILLION)
TABLE 610
BIORATIONAL PESTICIDES MARKET, BY SOURCE, 2023–2028 (USD MILLION)
FIGURE 1
NEMATICIDES MARKET SEGMENTATION AND REGIONAL SCOPE
FIGURE 2
NEMATICIDES MARKET: RESEARCH DESIGN
FIGURE 3
KEY DATA FROM SECONDARY SOURCES
FIGURE 4
INSIGHTS FROM INDUSTRY EXPERTS
FIGURE 5
BREAKDOWN OF PRIMARIES, BY COMPANY TYPE, DESIGNATION, AND REGION
FIGURE 6
NEMATICIDES MARKET SIZE ESTIMATION (DEMAND SIDE)
FIGURE 7
NEMATICIDES MARKET SIZE ESTIMATION: BOTTOM-UP APPROACH
FIGURE 8
NEMATICIDES MARKET SIZE ESTIMATION, BY TYPE (SUPPLY SIDE)
FIGURE 9
NEMATICIDES MARKET SIZE ESTIMATION: TOP-DOWN APPROACH
FIGURE 10
DATA TRIANGULATION METHODOLOGY
FIGURE 11
NEMATICIDES MARKET, BY TYPE, 2025 VS. 2030 (USD MILLION)
FIGURE 12
NEMATICIDES MARKET, BY NEMATODE TYPE, 2025 VS. 2030 (USD MILLION)
FIGURE 13
NEMATICIDES MARKET, BY MODE OF APPLICATION, 2025 VS. 2030 (USD MILLION)
FIGURE 14
NEMATICIDES MARKET, BY FORMULATION, 2025 VS. 2030 (USD MILLION)
FIGURE 15
NEMATICIDES MARKET, BY CROP TYPE, 2025 VS. 2030 (USD MILLION)
FIGURE 16
NORTH AMERICA TO RECORD FASTEST GROWTH DURING FORECAST PERIOD
FIGURE 17
RISING DEMAND FOR HIGH-YIELD CROPS AND PUSH FOR SUSTAINABLE AND INTEGRATED PEST MANAGEMENT TO DRIVE MARKET
FIGURE 18
BIOLOGICAL SEGMENT & US TO ACCOUNT FOR LARGEST SHARE IN NORTH AMERICAN MARKET IN 2025
FIGURE 19
US TO ACCOUNT FOR LARGEST SHARE (BY VALUE) IN 2025
FIGURE 20
BIOLOGICAL TYPE SEGMENT AND NORTH AMERICA TO OCCUPY LARGEST MARKET SHARE DURING FORECAST PERIOD
FIGURE 21
ROOT-KNOT NEMATODES SEGMENT AND NORTH AMERICA TO LEAD MARKET DURING FORECAST PERIOD
FIGURE 22
LIQUID SEGMENT AND NORTH AMERICA TO ACCOUNT FOR LARGEST MARKET SHARE DURING FORECAST PERIOD
FIGURE 23
SOIL DRESSING SEGMENT AND NORTH AMERICA TO LEAD MARKET DURING FORECAST PERIOD
FIGURE 24
FRUITS & VEGETABLES SEGMENT AND NORTH AMERICA TO HOLD MAJOR SHARE DURING FORECAST PERIOD
FIGURE 25
PESTICIDE CONSUMPTION, BY MAJOR COUNTRIES, 2022
FIGURE 26
WORLDWIDE AVERAGE MONETARY LOSS OF MAJOR CROPS DUE TO NEMATODES (USD BILLION)
FIGURE 27
FREQUENCY OF NEMATODE INFESTATION IN CROPS
FIGURE 28
NEMATICIDES MARKET DYNAMICS
FIGURE 29
AREA HARVESTED UNDER FRUITS & VEGETABLES, 2019–2023 (MILLION HECTARES)
FIGURE 30
ADOPTION OF GEN AI IN NEMATICIDES MARKET
FIGURE 31
NEMATICIDES MARKET: VALUE CHAIN ANALYSIS
FIGURE 32
EXPORT VALUE OF HS CODE 3808: KEY COUNTRIES, 2020–2024 (USD THOUSAND)
FIGURE 33
IMPORT VALUE OF HS CODE 3808: KEY COUNTRIES, 2020–2024 (USD THOUSAND)
FIGURE 34
PRICING RANGE OF NEMATICIDE TYPES, BY KEY PLAYER, 2024
FIGURE 35
PRICING TREND, BY NEMATICIDE TYPE, 2020–2024
FIGURE 36
PRICING TREND OF NEMATICIDE PRODUCTS, BY REGION, 2020–2024
FIGURE 37
KEY STAKEHOLDERS IN NEMATICIDES MARKET ECOSYSTEM
FIGURE 38
NEMATICIDES MARKET: TRENDS/DISRUPTIONS IMPACTING CUSTOMER BUSINESS
FIGURE 39
PATENTS GRANTED FOR NEMATICIDES MARKET, 2015–2025
FIGURE 40
REGIONAL ANALYSIS OF PATENTS GRANTED FOR NEMATICIDES MARKET,2015–2025
FIGURE 41
NEMATICIDES MARKET: PORTER’S FIVE FORCES ANALYSIS
FIGURE 42
IMPACT OF STAKEHOLDERS ON BUYING PROCESS, BY MODE OF APPLICATION
FIGURE 43
KEY BUYING CRITERIA, BY MODE OF APPLICATION
FIGURE 44
INVESTMENT & FUNDING SCENARIO OF FEW MAJOR PLAYERS (JAN 2010–APRIL 2025)
FIGURE 45
NEMATICIDES MARKET, BY TYPE, 2025 VS. 2030 (USD MILLION)
FIGURE 46
NEMATICIDES MARKET, BY NEMATODE TYPE, 2025 VS. 2030 (USD MILLION)
FIGURE 47
NEMATICIDES MARKET, BY FORMULATION, 2025 VS. 2030 (USD MILLION)
FIGURE 48
NEMATICIDES MARKET, BY MODE OF APPLICATION, 2025 VS. 2030 (USD MILLION)
FIGURE 49
NEMATICIDES MARKET, BY CROP TYPE, 2025 VS. 2030 (USD MILLION)
FIGURE 50
MEXICO TO BE FASTEST-GROWING COUNTRY DURING FORECAST PERIOD
FIGURE 51
NORTH AMERICA: NEMATICIDES MARKET SNAPSHOT
FIGURE 52
ASIA PACIFIC: NEMATICIDES MARKET SNAPSHOT
FIGURE 53
SEGMENTAL REVENUE ANALYSIS OF KEY PLAYERS, 2020–2024 (USD BILLION)
FIGURE 54
NEMATICIDES MARKET: MARKET SHARE ANALYSIS, 2024
FIGURE 55
NEMATICIDES MARKET: COMPANY EVALUATION MATRIX (KEY PLAYERS), 2024
FIGURE 56
NEMATICIDES MARKET: COMPANY FOOTPRINT
FIGURE 57
NEMATICIDES MARKET: COMPANY EVALUATION MATRIX (STARTUPS/SMES), 2024
FIGURE 58
COMPANY VALUATION OF KEY VENDORS
FIGURE 59
FINANCIAL METRICS OF KEY VENDORS
FIGURE 60
PRODUCT ANALYSIS, BY KEY PLAYERS OF NEMATICIDES
FIGURE 61
BASF SE: COMPANY SNAPSHOT
FIGURE 62
SYNGENTA: COMPANY SNAPSHOT
FIGURE 63
CORTEVA: COMPANY SNAPSHOT
FIGURE 64
UPL LTD: COMPANY SNAPSHOT
FIGURE 65
BAYER AG: COMPANY SNAPSHOT
FIGURE 66
FMC CORPORATION: COMPANY SNAPSHOT
FIGURE 67
SUMITOMO CHEMICAL CO., LTD.: COMPANY SNAPSHOT
FIGURE 68
NUFARM: COMPANY SNAPSHOT
FIGURE 69
AMERICAN VANGUARD CORPORATION: COMPANY SNAPSHOT
FIGURE 70
NOVONESIS GROUP: COMPANY SNAPSHOT
FIGURE 71
BIOCERES CROP SOLUTIONS: COMPANY SNAPSHOT


 Exclusive indicates content/data unique to MarketsandMarkets and not available with any competitors.


Nathan
Jul, 2026
What are the major growth drivers influencing the nematicides market?.
Zoey
Jul, 2026
How is innovation influencing the nematicides industry?.
Jonathan
Jul, 2026
What are the major technological trends shaping the bionematicides market?.
Kevin
Jul, 2026
What is the long-term outlook for the bionematicides industry?.