Bleaching Agents Market by Type (Azodicarbonamide, Hydrogen Peroxide, Ascorbic Acid, Acetone Peroxide, and Chlorine Dioxide), Form (Powder and Liquid), Application (Bakery Products, Flour, and Cheese), and Region - Global Forecast to 2023
[126 Pages Report] The bleaching agents market was valued at USD 692.6 Million in 2017 and is projected to grow at a CAGR of 5.5% from 2018, to reach USD 953.8 Million by 2023. The base year considered for the study is 2017, while the forecast period spans from 2018 to 2023. The basic objective of the report is to define, segment, and project the global market size on the basis of type, form, application, and region. It also helps to understand the structure of the market by identifying its various segments. The other objectives include analyzing the opportunities for the stakeholders, providing the competitive landscape of the market trends, and projecting the size of the market and its submarkets, in terms of value.

For More details on this research, Request Free Sample Report
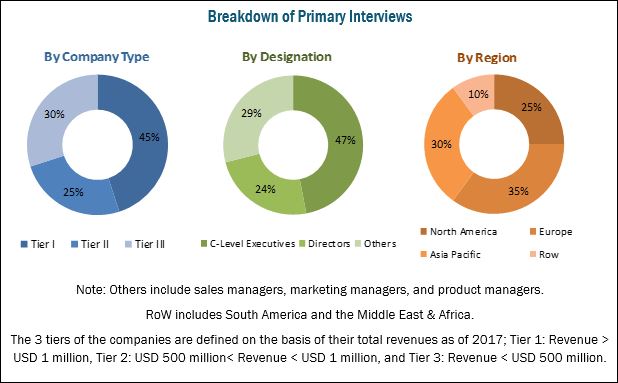
This research study involved the extensive use of secondary sources (which included directories and databases) such as Hoovers, Forbes, Bloomberg Businessweek, and Factiva to identify and collect information useful for this technical, market-oriented, and commercial study of the market. The primary sources that have been involved include industry experts from core and related industries and preferred suppliers, dealers, manufacturers, alliances, standards & certification organizations from companies, and organizations related to all segments of this industry’s value chain. In-depth interviews have been conducted with various primary respondents, such as key industry participants, subject matter experts, C-level executives of key market players, and industry consultants, to obtain and verify critical qualitative and quantitative information as well as to assess future prospects. The following figure depicts the market research methodology applied in drafting this report on the bleaching agents market.

To know about the assumptions considered for the study, download the pdf brochure
Key participants in the market include bleaching agent manufacturers, suppliers, and regulatory bodies. The key players that are profiled in the report include BASF (US), Aditya Birla Chemicals (Grasim) (India), Evonik Industries (Germany), Hawkins. Inc (US), Siemer Milling Company (US), Gujarat Alkalies and Chemicals (India), PeroxyChem (US), Solvay (Belgium), Supraveni Chemicals (India), Spectrum Chemicals Manufacturing Corporation (India), Engrain (US), and AkzoNobel (Netherlands).
This report is targeted at the existing players in the industry, which include the following:
- Raw material suppliers
- Bleaching agent manufacturers
- Regulatory bodies
- Intermediary suppliers
- Flour manufacturers
- Trade associations and industry bodies
- Government and research organizations
“The study answers several questions for the stakeholders; primarily, which market segments to focus on in the next two to five years, for prioritizing efforts and investments.”
Scope of the Report
On the basis of Type, the market for bleaching agents has been segmented as follows:
- Azodicarbonamide
- Hydrogen peroxide
- Ascorbic acid
- Acetone peroxide
- Chlorine dioxide
- Others (chlorine, benzoyl peroxide, calcium peroxide, and sulfur dioxide)
On the basis of Form, the market for bleaching agents has been segmented as follows:
- Powder
- Liquid
On the basis of Application, the market for bleaching agents has been segmented as follows:
- Bakery products
- Flour
- Cheese
- Others (sugar, candies, and caramel)
On the basis of Region, the market for bleaching agents has been segmented as follows:
- North America
- Europe
- Asia Pacific
- RoW (South America and the Middle East & Africa)
Available Customizations
With the given market data, MarketsandMarkets offers customizations according to the company’s specific needs.
The following customization options are available for the report:
Segment Analysis
- Product matrix, which gives a detailed comparison of the product portfolio of each company
Regional Analysis
- Further breakdown of the Rest of Asia Pacific bleaching agents market, by country
- Further breakdown of the Rest of European bleaching agents market, by country
Company Information
- Detailed analysis and profiling of additional market players (up to five)
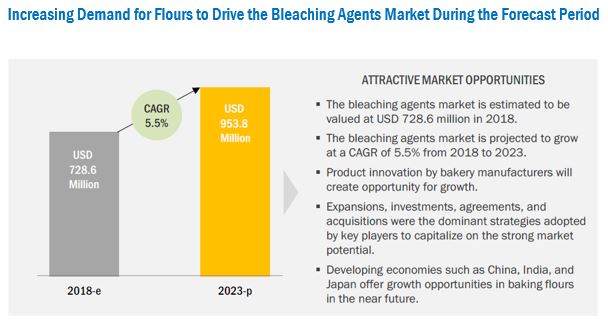
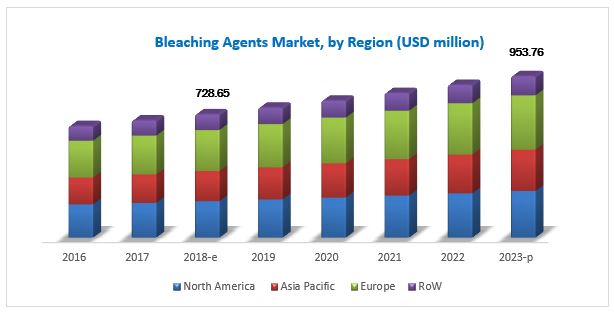
The bleaching agents market is estimated at USD 728.6 Million in 2018 and is projected to reach USD 953.8 Million by 2023, growing at a CAGR of 5.5% during the forecast period. The market size of bleaching agents includes both, the valuation of existing bleaching agents and incremental revenue year-on-year. The global demand for bleaching agents is increasing significantly due to the rising demand for bread and bread-related products, growing urban population, increasing disposable income, and the technological advancements in flour quality assessment.
Based on type, the hydrogen peroxide segment is projected to hold the largest share, in terms of value, of the global market. In the food & beverage processing industry, it is commonly used as a peroxygen agent in products such as flour, bakery foods, natural sugars, natural oils, waxes, gums, and starches. The US Food and Drug Administration (FDA) confirmed the generally recognized as safe (GRAS) status of hydrogen peroxide as a direct ingredient used in food products. Hydrogen peroxide primarily bleaches and purifies food products, which, in turn, helps in improving the color of food products. It enhances the shelf life of the products by sterilizing aseptic packaging containers in the food industry.
The powder segment, by form, accounted for a larger share of the global market in 2017. The powdered form of bleaching agents, which include ascorbic acid, hydrogen peroxide, and potassium bromates, has a longer shelf-life and is usually stable for many years when stored at room temperature. Furthermore, technological advancements have led to increased usage of powdered bleaching agents as the dosing is easier than the liquid form. AkzoNobel N.V. (Netherlands) and Aditya Birla Chemicals (India) are among the major players offering powdered bleaching agents in the market.
The flour segment, by application, accounted for the largest share of the market in 2017. Bleaching agents are used for whitening flour, as freshly milled flour has a slightly yellowish color as it contains carotenoids. Additionally, bleaching oxidizes the surface of the flour and promotes its gluten-producing potential. Bleaching of flour helps in the weakening of the proteins and maturation of the flour in a reduced amount of time and has thereby become a necessity for flour producers. Some of the most common flour bleaching agents include hydrogen peroxide, benzoyl peroxide, and chlorine dioxide.
Asia Pacific is projected to be the fastest-growing market for bleaching agents during the forecast period. The major countries with growth potential in this market include China, India, Japan, and Australia. India is estimated to account for a significant share of the Asia Pacific market through 2023. This is an emerging market and hence provides opportunities for the growth of the market.

For More details on this research, Request Free Sample Report
One of the major restraining factors for the growth of the market is the ban on certain flour bleaching agents such as potassium bromate, potassium iodate, and chlorine in some countries. Recent studies have shown that these agents have an adverse impact on the human health. Thus, the usage of such bleaching agents has been banned by food authorities of countries such as Australia, Japan, Brazil, New Zealand, Canada, the UK, and China.
Companies such as Evonik Industries (Germany), BASF (US), Solvay (Belgium), AkzoNobel (Netherlands), and PeroxyChem (US) collectively account for a share of more than half of the bleaching agents market. These companies have a strong presence in Europe, North America, and the Rest of the World (RoW). They also have manufacturing facilities across these regions and a strong distribution network.
To speak to our analyst for a discussion on the above findings, click Speak to Analyst

Table of Contents
1 Introduction (Page No. - 15)
1.1 Objectives of the Study
1.2 Market Definition
1.3 Market Scope
1.3.1 Periodization Considered
1.4 Currency Considered
1.5 Unit Considered
1.6 Stakeholders
2 Research Methodology (Page No. - 19)
2.1 Research Data
2.1.1 Secondary Data
2.1.1.1 Key Data From Secondary Sources
2.1.2 Primary Data
2.1.2.1 Breakdown of Primary Interviews
2.2 Market Size Estimation
2.2.1 Bottom-Up Approach (For Volume and Value Data)
2.2.2 Top-Down Approach
2.3 Market Breakdown & Data Triangulation
2.4 Research Assumptions & Limitations
2.4.1 Assumptions
2.4.2 Limitations
3 Executive Summary (Page No. - 28)
4 Premium Insights (Page No. - 33)
4.1 Attractive Opportunities in the Global Market
4.2 Market for Bleaching Agents, By Application & Region
4.3 Europe: Bleaching Agents Market, By Country & Type
4.4 Market for Bleaching Agents, By Form
4.5 Market for Bleaching Agents: Key Submarkets
5 Market Overview (Page No. - 37)
5.1 Introduction
5.2 Market Dynamics
5.2.1 Drivers
5.2.1.1 Increase in Consumption of Bread and Related Bakery Products
5.2.1.2 Advancements in Technology for Product Evaluation
5.2.2 Restraints
5.2.2.1 Ban on Certain Flour Bleaching Agents in Several Countries
5.2.3 Opportunities
5.2.3.1 Emerging Applications in the Food Industry
5.2.4 Challenges
5.2.4.1 Reduced Consumption of Food Products Containing Chemical Ingredients
5.2.4.2 Criticality of Formulations
5.3 Regulations
5.3.1 North America
5.3.2 Asia Pacific
5.3.3 Europe
5.3.4 Prohibited Products
6 Bleaching Agents Market, By Type (Page No. - 43)
6.1 Introduction
6.2 Azodicarbonamide
6.3 Hydrogen Peroxide
6.4 Ascorbic Acid
6.5 Acetone Peroxide
6.6 Chlorine Dioxide
6.7 Others
7 Bleaching Agents Market, By Form (Page No. - 48)
7.1 Introduction
7.2 Powder
7.3 Liquid
8 Bleaching Agents Market, By Application (Page No. - 51)
8.1 Introduction
8.2 Bakery Products
8.3 Flour
8.4 Cheese
8.5 Other Applications
9 Bleaching Agents Market, By Region (Page No. - 55)
9.1 Introduction
9.2 Asia Pacific
9.2.1 China
9.2.2 Japan
9.2.3 India
9.2.4 Australia
9.2.5 New Zealand
9.2.6 Rest of Asia Pacific
9.3 North America
9.3.1 US
9.3.2 Canada
9.3.3 Mexico
9.4 Europe
9.4.1 Germany
9.4.2 France
9.4.3 Spain
9.4.4 UK
9.4.5 Rest of Europe
9.5 Rest of the World
9.5.1 Middle East & Africa
9.5.2 South America
10 Competitive Landscape (Page No. - 91)
10.1 Overview
10.2 Market Ranking
10.2.1 Key Strategies
10.3 Competitive Scenario
10.3.1 Expansions
10.3.2 Acquisitions
10.3.3 New Product Launches
10.3.4 Agreements, Investments, Divestments, Joint Ventures, and Mergers
11 Company Profiles (Page No. - 97)
(Business Overview, Products Offered, Recent Developments, SWOT Analysis & MnM View)*
11.1 BASF
11.2 Aditya Birla Chemicals (Grasim)
11.3 Evonik
11.4 Solvay
11.5 Akzonobel
11.6 Hawkins, Inc.
11.7 Siemer Milling
11.8 Peroxychem
11.9 Supraveni Chemicals
11.10 Spectrum Chemicals
11.11 Engrain
11.12 Gujarat Alkalies and Chemicals
*Details on Business Overview, Products Offered, Recent Developments, SWOT Analysis & MnM View Might Not Be Captured in Case of Unlisted Companies.
12 Appendix (Page No. - 120)
12.1 Discussion Guide
12.2 Knowledge Store: Marketsandmarkets’ Subscription Portal
12.3 Introducing RT: Real-Time Market Intelligence
12.4 Available Customizations
12.5 Related Reports
12.6 Author Details
List of Tables (77 Tables)
Table 1 US Dollar Exchange Rate Considered for the Study, 2015–2017
Table 2 Bleaching Agents Market Size, By Type, 2016–2023 (USD Million)
Table 3 Market Size, By Type, 2016–2023 (KT)
Table 4 Market Size, By Form, 2016–2023 (USD Million)
Table 5 Market Size, By Form, 2016–2023 (KT)
Table 6 Market Size, By Application, 2016–2023 (USD Million)
Table 7 Market Size, By Application, 2016–2023 (KT)
Table 8 Market Size, By Region, 2016–2023 (USD Million)
Table 9 Market Size, By Region, 2016–2023 (KT)
Table 10 Asia Pacific: Bleaching Agents Market Size, By Country, 2016–2023 (USD Million)
Table 11 Asia Pacific: Market Size, By Country, 2016–2023 (KT)
Table 12 Asia Pacific: Market Size, By Type, 2016–2023 (USD Million)
Table 13 Asia Pacific: Market Size, By Type, 2016–2023 (KT)
Table 14 Asia Pacific: Market Size, By Application, 2016–2023 (USD Million)
Table 15 Asia Pacific: Market Size, By Application, 2016–2023 (KT)
Table 16 Asia Pacific: Market Size, By Form, 2016–2023 (USD Million)
Table 17 Asia Pacific: Market Size, By Form, 2016–2023 (KT)
Table 18 China: Bleaching Agent Market Size, By Application, 2016–2023 (USD Million)
Table 19 China: Market Size, By Application, 2016–2023 (KT)
Table 20 Japan: Market for Bleaching Agents By Size, By Application, 2016–2023 (USD Million)
Table 21 Japan: Market Size, By Application, 2016–2023 (KT)
Table 22 India: Market for Bleaching Agents By Size, By Application, 2016–2023 (USD Million)
Table 23 India: Bleaching Agents Market Size, By Application, 2016–2023 (KT)
Table 24 Australia: Bleaching Agents Market Size, By Application, 2016–2023 (USD Million)
Table 25 Australia: Market Size, By Application, 2016–2023 (KT)
Table 26 New Zealand: Bleaching Agents Market Size, By Application, 2016–2023 (USD Million)
Table 27 New Zealand: Market Size, By Application, 2016–2023 (KT)
Table 28 Rest of Asia Pacific: Bleaching Agents Market Size, By Application, 2016–2023 (USD Million)
Table 29 Rest of Asia Pacific: Market Size, By Application, 2016–2023 (KT)
Table 30 North America: Market for for Bleaching Agents By Size, By Country, 2016–2023 (USD Million)
Table 31 North America: Market Size, By Country, 2016–2023 (KT)
Table 32 North America: Bleaching Agents Market Size, By Type, 2016–2023 (USD Million)
Table 33 North America: Market Size, By Type, 2016–2023 (KT)
Table 34 North America: Market Size, By Application, 2016–2023 (USD Million)
Table 35 North America: Market Size, By Application, 2016–2023 (KT)
Table 36 North America: Market Size, By Form, 2016–2023 (USD Million)
Table 37 North America: Market Size, By Form, 2016–2023 (KT)
Table 38 US: Bleaching Agents Market Size, By Application, 2016–2023 (USD Million)
Table 39 US: Market Size, By Application, 2016–2023 (KT)
Table 40 Canada: Bleaching Agents Market Size, By Application, 2016–2023 (USD Million)
Table 41 Canada: Market Size, By Application, 2016–2023 (KT)
Table 42 Mexico: Market Size, By Application, 2016–2023 (USD Million)
Table 43 Mexico: Market Size, By Application, 2016–2023 (KT)
Table 44 Europe: Bleaching Agents Market for Bleaching Agents By Size, By Country, 2016–2023 (USD Million)
Table 45 Europe: Market Size, By Country, 2016–2023 (KT)
Table 46 Europe: Market Size, By Type, 2016–2023 (USD Million)
Table 47 Europe: Market Size, By Type, 2016–2023 (KT)
Table 48 Europe: Market Size, By Application, 2016–2023 (USD Million)
Table 49 Europe: Market Size, By Application, 2016–2023 (KT)
Table 50 Europe: Market Size, By Form, 2016–2023 (USD Million)
Table 51 Europe: Market Size, By Form, 2016–2023 (KT)
Table 52 Germany: Market for Bleaching Agents By Size, By Application, 2016–2023 (USD Million)
Table 53 Germany: Market Size, By Application, 2016–2023 (KT)
Table 54 France: Bleaching Agents Market Size, By Application, 2016–2023 (USD Million)
Table 55 France: Market Size, By Application, 2016–2023 (KT)
Table 56 Spain: Market for Bleaching Agents By Size, By Application, 2016–2023 (USD Million)
Table 57 Spain: Market Size, By Application, 2016–2023 (KT)
Table 58 UK: Bleaching Agents Market Size, By Application, 2016–2023 (USD Million)
Table 59 UK: Market Size, By Application, 2016–2023 (KT)
Table 60 Rest of Europe: Bleaching Agents Market Size, By Application, 2016–2023 (USD Million)
Table 61 Rest of Europe: Market Size, By Application, 2016–2023 (KT)
Table 62 RoW: Bleaching Agents Market Size, By Region, 2016–2023 (USD Million)
Table 63 RoW: Market Size, By Region, 2016–2023 (KT)
Table 64 RoW: Market Size, By Type, 2016–2023 (USD Million)
Table 65 RoW: Market Size, By Type, 2016–2023 (KT)
Table 66 RoW: Market Size, By Application, 2016–2023 (USD Million)
Table 67 RoW: Market Size, By Application, 2016–2023 (KT)
Table 68 RoW: Market Size, By Form, 2016–2023 (USD Million)
Table 69 RoW: Market Size, By Form, 2016–2023 (KT)
Table 70 Middle East & Africa: Bleaching Agents Market Size, By Application, 2016–2023 (USD Million)
Table 71 Middle East & Africa: Market Size, By Application, 2016–2023 (KT)
Table 72 South America: Bleaching Agents Market Size, By Application, 2016–2023 (USD Million)
Table 73 South America: Market Size, By Application, 2016–2023 (KT)
Table 74 Expansions, 2013–2018
Table 75 Acquisitions, 2013–2018
Table 76 New Product Launches, 2013–2018
Table 77 Agreements, Investments, Divestments, Joint Ventures, and Mergers, 2013–2018
List of Figures (35 Figures)
Figure 1 Market Segmentation
Figure 2 Geographic Segmentation
Figure 3 Research Design
Figure 4 Breakdown of Primary Interviews: By Company Type, Designation, and Region
Figure 5 Market Size Estimation Methodology: Bottom-Up Approach
Figure 6 Market Size Estimation Methodology: Top-Down Approach
Figure 7 Data Triangulation
Figure 8 Market for Bleaching Agents Size, By Type, 2018 vs 2023 (USD Million)
Figure 9 Powder Form Segment to Account for the Larger Share Through 2023 in Terms of Value
Figure 10 Bleaching Agent Market Size, By Application, 2018 vs 2023 (USD Million)
Figure 11 Bleaching Agent Market: Regional Snapshot
Figure 12 Increasing Demand for Flours to Drive the Market During the Forecast Period
Figure 13 Flours Segment to Account for the Largest Share Across Regions in Terms of Volume in 2018
Figure 14 Hydrogen Peroxide Segment to Account for the Largest Share in Europe in 2018
Figure 15 Powder Form to Dominate the Market Across All Regions, 2018
Figure 16 US & Canada to Account for Highest Share in Market, 2018
Figure 17 Market for Bleaching Agents Dynamics
Figure 18 Market Size, By Type, 2018 vs 2023 (USD Million)
Figure 19 Market Size, By Form, 2018 vs 2023 (USD Million)
Figure 20 Market Size, By Application, 2018 vs 2023 (USD Million)
Figure 21 India is Projected to Be the Fastest-Growing in the Market in Asia Pacific Between 2018 & 2023
Figure 22 Average Consumption of Bread Per Capita, 2012
Figure 23 Key Developments of the Leading Players in the Market for 2013-2018
Figure 24 Top Five Companies in the Market, 2017
Figure 25 Market Developments, By Growth Strategy, 2013–2018
Figure 26 BASF: Company Snapshot
Figure 27 BASF: SWOT Analysis
Figure 28 Aditya Birla Chemicals (Grasim): Company Snapshot
Figure 29 Aditya Birla Chemicals (Grasim): SWOT Analysis
Figure 30 Evonik: Company Snapshot
Figure 31 Evonik: SWOT Analysis
Figure 32 Solvay: Company Snapshot
Figure 33 Solvay: SWOT Analysis
Figure 34 Akzonobel: Company Snapshot
Figure 35 Akzonobel: SWOT Analysis


Growth opportunities and latent adjacency in Bleaching Agents Market