The study involved four major activities in estimating the current size of the bread improvers market. Exhaustive secondary research was done to collect information on the market, peer, and parent markets. The next step was to validate these findings, assumptions, and sizing with industry experts across the value chain through primary research. Both top-down and bottom-up approaches were employed to estimate the complete market size. After that, market breakdown and data triangulation were used to estimate the market size of segments and subsegments.
Secondary Research
This research study involved the extensive use of secondary sources—directories and databases such as Bloomberg Businessweek and Factiva—to identify and collect information useful for a technical, market-oriented, and commercial study of the bread improvers market.
In the secondary research process, various sources such as annual reports, press releases & investor presentations of companies, white papers, food journals, certified publications, articles from recognized authors, gold & silver standard websites, directories, and databases, were referred to identify and collect information. This research study involved the extensive use of secondary sources—directories and databases such as Bloomberg Businessweek and Factiva—to identify and collect information useful for a technical, market-oriented, and commercial study of the bread improvers market.
Secondary research was mainly used to obtain key information about the industry’s supply chain, the total pool of key players, and market classification and segmentation as per the industry trends to the bottom-most level, regional markets, and key developments from both market- and technology-oriented perspectives.
Primary Research
Extensive primary research was conducted after obtaining information regarding the bread improvers market scenario through secondary research. Several primary interviews were conducted with market experts from both the demand and supply sides across major countries of North America, Europe, Asia Pacific, South America, and the Rest of the World. Primary data was collected through questionnaires, emails, and telephonic interviews. The primary sources from the supply side included various industry experts, such as Chief X Officers (CXOs), Vice Presidents (VPs), Directors, from business development, marketing, research, and development teams, and related key executives from distributors, and key opinion leaders. Primary interviews were conducted to gather insights such as market statistics, data on revenue collected from the products and services, market breakdowns, market size estimations, market forecasting, and data triangulation. Primary research also helped in understanding the various trends related to additives of bread improvers, type, application, form, end users, and region. Stakeholders from the demand side, such as companies who are using bread improvers were interviewed to understand the buyer’s perspective on the suppliers, products, and their current usage of bread improvers and the outlook of their business which will affect the overall market.

To know about the assumptions considered for the study, download the pdf brochure
|
COMPANY NAME
|
DESIGNATION
|
|
Puratos (Belgium)
|
Sales Manager
|
|
Corbion (Netherlands)
|
General Manager
|
|
AB Mauri (US)
|
Manager
|
|
Lesaffre (France)
|
Head of bread improvers solutions
|
|
DSM (Netherlands)
|
Marketing Manager
|
|
International Flavors & Fragrances Inc. IFF (US)
|
Sales Executive
|
|
ADM (US)
|
Head - Research & Development
|
|
Kerry Group plc. (Ireland)
|
Manager
|
|
Bakels Worldwide (Switzerland)
|
R&D, QC, and production Expert
|
|
Oy Karl Fazer Ab. (Finland)
|
Senior Engineering Manager
|
Market Size Estimation
Both the top-down and bottom-up approaches were used to estimate and validate the total size of the bread improvers market. These approaches were also used extensively to determine the size of various subsegments in the market. The research methodology used to estimate the market size includes the following details:
-
The key players in the industry and the overall markets were identified through extensive secondary research.
-
All shares, splits, and breakdowns were determined using secondary sources and verified through primary sources.
-
All possible parameters that affect the market covered in this research study were accounted for, viewed in extensive detail, verified through primary research, and analyzed to obtain final quantitative and qualitative data.
-
The research included the study of reports, reviews, and newsletters of top market players, along with extensive interviews for opinions from leaders, such as CEOs, directors, and marketing executives.
Global Bread improvers Market: Bottom-Up Approach

To know about the assumptions considered for the study, Request for Free Sample Report
Global Bread improvers Market: Top-Down Approach

Data Triangulation
After arriving at the overall market size from the estimation process explained above, the total market was split into several segments and subsegments. Data triangulation and market breakdown procedures were employed to estimate the bread improvers market and arrive at the exact statistics for all segments and subsegments. The data was triangulated by studying numerous factors and trends from the demand and supply sides. The market size was also validated using both the top-down and bottom-up approaches.
Market Definition
According to Lesaffre, “A bread improver is a coherent, balanced combination of baking ingredients chosen from among various manufacturing aids and raw ingredients, mixed together in an appropriate formula.
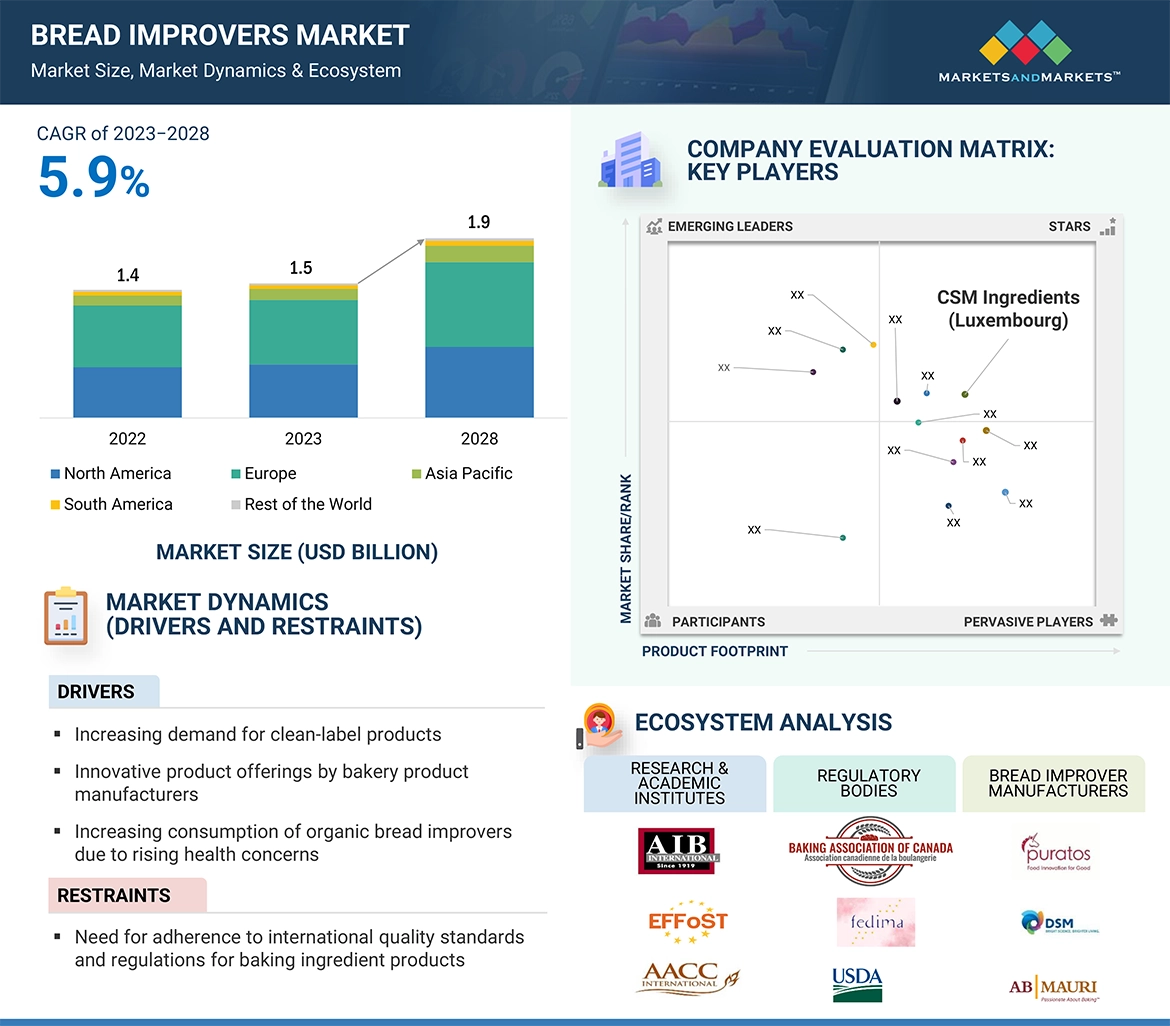
Bread improvers, also known as improving agents or dough conditioners, are additives combined with flour to enhance baking functionality. They accelerate dough rising, improve dough strength and workability, and activate gluten to produce gas for better texture and volume. Used in grain mixes or bread with additional ingredients like fruit or nuts, they result in lighter loaves with improved keeping qualities. These ingredients simplify production, ensure standardized quality, and enhance dough handling and fermentation characteristics for bakery manufacturers.
By improving the bread products quality, texture, and shelf life, bread improvers are essential to the bakery sector. These ingredients are designed to solve a variety of problems that arise when making bread, including volume, consistency, and freshness of the dough. The market is growing for bread improvers that adhere to clean label requirements as customer preferences are moving towards healthier and cleaner products.
Key Stakeholders
-
Bakery ingredient suppliers and manufacturers
-
Bread improver manufacturers and suppliers
-
Bread manufacturers
-
Artisan bakers
-
Food safety agencies
-
Importers and exporters of bakery ingredients
-
Intermediary suppliers, which include traders and distributors of bread improvers
-
Government and research organizations
-
Associations and industry bodies such as:
-
Food and Drug Administration (FDA)
-
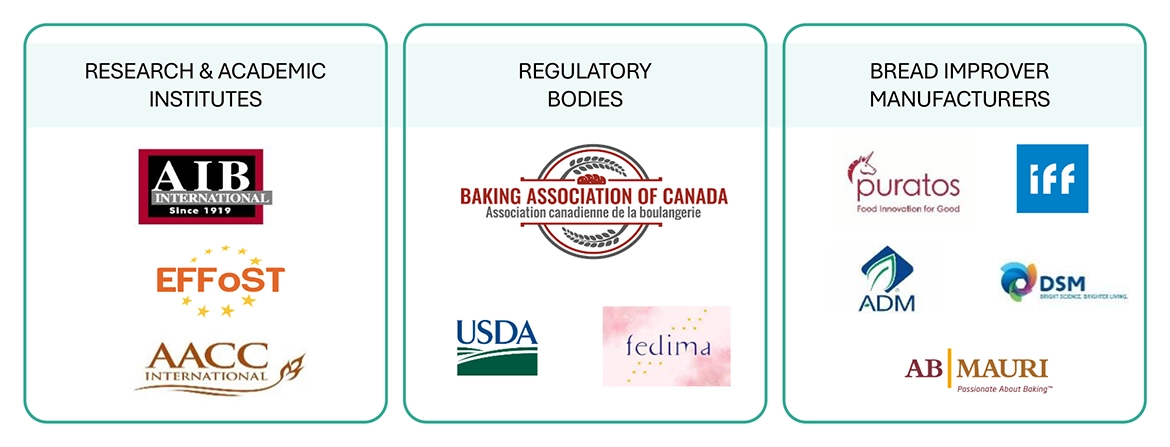
United States Department of Agriculture (USDA)
-
The European Food Information Council (EUFIC)
-
Association of Bakery Ingredient Manufacturers (ABIM)
-
American Bakers Association (ABA)
-
Food Standards Australia New Zealand (FSANZ)
-
Federation of European Manufacturers and Suppliers of Ingredients to the Bakery, Confectionery and Patisserie Industries (FEDIMA)
-
British Society of Baking (BSB)
-
South American Bakers Association (SABA)
-
Canadian Association of Bakers (CAB)
-
The Federation of Bakers and Biscuit Manufacturers of Spain (FEB)
Report Objectives
-
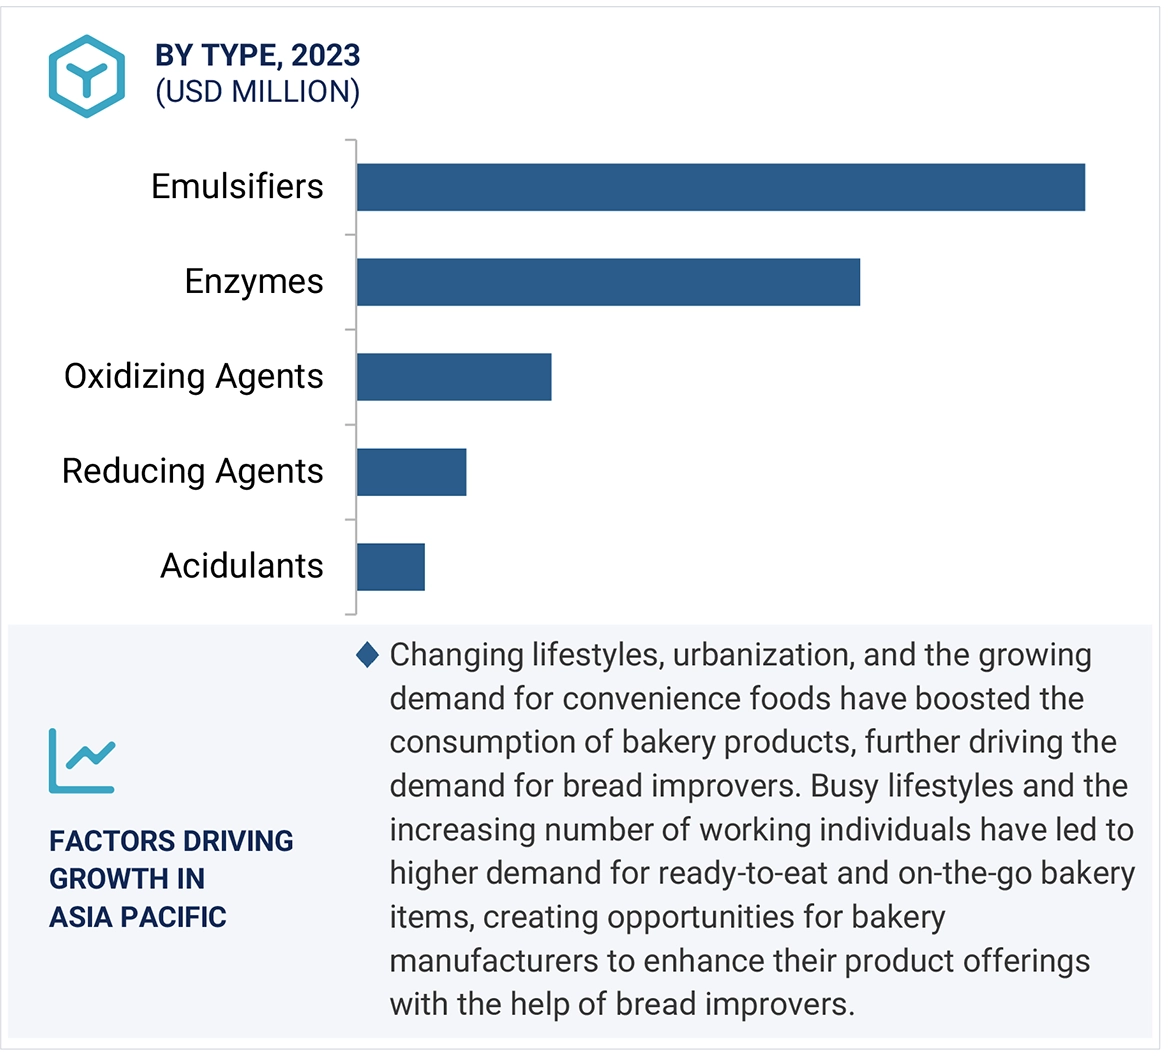
To determine and project the size of the bread improvers market with respect to the type, application, form, end users, and region in terms of value and volume over five years, ranging from 2023 to 2028.
-
To identify the attractive opportunities in the market by determining the largest and fastest-growing segments across regions.
-
To provide detailed information about the key factors influencing market growth (drivers, restraints, opportunities, and challenges).
-
To analyze the opportunities in the market for stakeholders and provide details of the competitive landscape for market leaders.
-
To analyze the micro-markets with respect to individual growth trends, prospects, and their contribution to the total market.
-
To identify and profile the key players in the bread improvers market.
-
To understand the competitive landscape and identify the major growth strategies adopted by players across the key regions.
-
To provide insights on key product innovations and investments in the bread improvers market.
Available Customizations:
With the given market data, MarketsandMarkets offers customizations according to company-specific scientific needs.
The following customization options are available for the report:
Product Analysis
-
Product Matrix, which gives a detailed comparison of the product portfolio of each company.
Geographic Analysis
With the given market data, MarketsandMarkets offers customizations according to company-specific scientific needs.
-
Further breakdown of the Rest of Europe’s market for bread improvers into Denmark, Turkey, Sweden, Belgium, the Netherlands, and other EU & non-EU countries.
-
Further breakdown of the Rest of Asia Pacific market for bread improvers into Vietnam, Indonesia, and Malaysia.
-
Further breakdown of the Rest of South America market for bread improvers into Colombia, Peru, Chile, and other South American countries.
-
Further breakdown of the Rest of the World market for bread improvers into the Middle East (Saudi Arabia, UAE, Turkey, Iran, Qatar, Kuwait, and Bahrain) and Africa (South Africa, Egypt, Kenya, Ethiopia, and Nigeria).
Company Information
-
Detailed analyses and profiling of additional market players (up to five)


User
Jun, 2020
Which countries are covered in the African market? I am looking specifically for the South African region..