Blockchain Interoperability Market by Solution (Cross-chain Bridging, Cross-chain APIs, Federated or Consortium Interoperability), Application (dApps, Digital Assets/NFTs, Cross-chain Trading & Exchange), Vertical and Region - Global Forecast to 2028
Blockchain Interoperability Market Size, Share, Industry Growth, Latest Trends, Analysis, Forecast - 2028
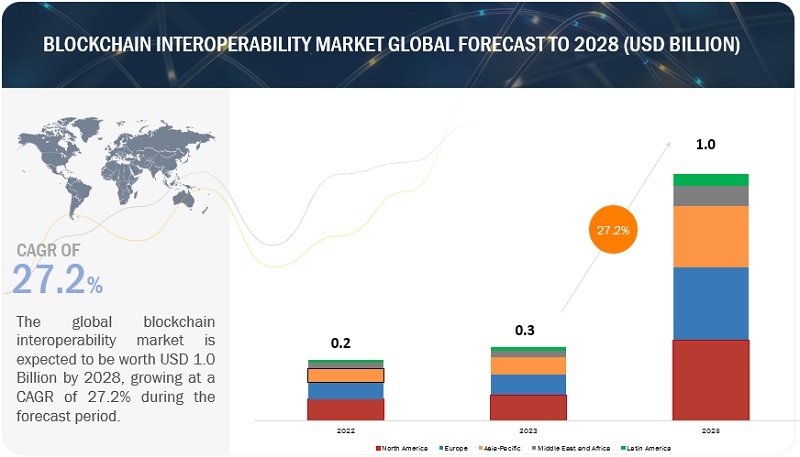
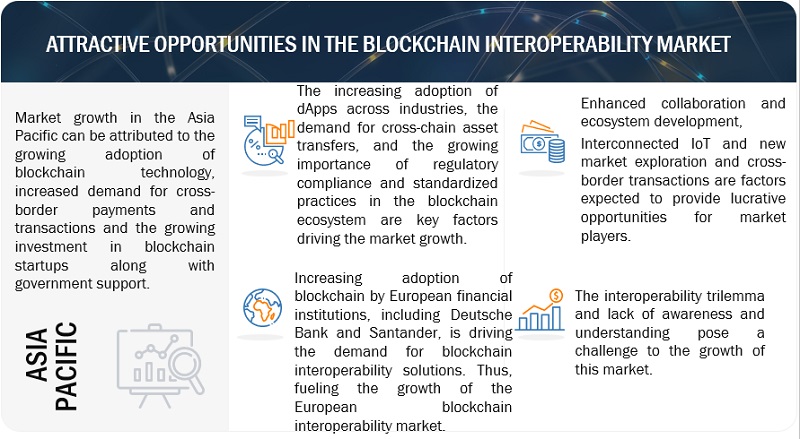
[251 Pages Report] The global blockchain interoperability market size is projected to grow from USD 0.3 billion in 2023 to USD 1.0 billion by 2028 at a Compound Annual Growth Rate (CAGR) of 27.2% during the forecast period. The key drivers for the market growth include the need for seamless communication and data exchange between different blockchain networks, the increasing adoption of dApps across industries, the demand for cross-chain asset transfers, and the growing importance of regulatory compliance and standardized practices in the blockchain ecosystem. In addition to these factors, as mentioned earlier, enhanced collaboration and ecosystem development further drive the demand for blockchain interoperability. As organizations seek to foster partnerships and create interconnected networks, the need for seamless communication and data exchange between blockchains becomes paramount. The growing interconnectedness of the IoT also fuels the demand for blockchain interoperability, as it enables secure and efficient communication between IoT devices across different blockchain networks. Furthermore, exploring new markets and the increasing volume of cross-border transactions further contribute to the rising demand for blockchain interoperability solutions.
To know about the assumptions considered for the study, Request for Free Sample Report
To know about the assumptions considered for the study, download the pdf brochure
The blockchain interoperability market is projected to provide billion-dollar opportunities for solutions and service providers. Recession would also have a substantial impact on the blockchain interoperability market. The effect of a recession on the blockchain interoperability market is likely to be mixed. A recession could lead to reduced investments and budget cuts in technology-related projects, potentially slowing the adoption and implementation of blockchain interoperability solutions. Companies may prioritize cost-cutting measures over exploring new technologies. However, recessions often drive innovation, the search for more efficient solutions, and blockchain interoperability can offer cost-saving benefits and enhanced operational efficiency. Additionally, governments and regulatory bodies may continue to invest in blockchain technology to stimulate economic recovery, which could positively impact the blockchain interoperability market.
COVID-19 Impact
The COVID-19 pandemic has had a mixed impact on the blockchain interoperability market. On the one hand, the pandemic has disrupted global economies, leading to budget constraints and reduced investments in various sectors, including technology. This could slow the adoption and implementation of blockchain interoperability solutions as companies prioritize immediate cost-saving measures. However, the pandemic has also highlighted the importance of digital transformation and the need for secure and efficient data exchange, key drivers for blockchain interoperability. As businesses and organizations adapt to remote work and digital processes, the demand for interoperability solutions to connect disparate systems and facilitate seamless communication has increased. Furthermore, the pandemic has accelerated the adoption of blockchain technology in specific sectors, such as healthcare and supply chain management, where transparency, traceability, and secure data exchange have become crucial. This increased adoption could drive the demand for blockchain interoperability solutions in these industries.
Overall, while the COVID-19 pandemic has presented challenges to the blockchain interoperability market, it has also created opportunities for growth and innovation as organizations recognize the importance of digital resilience and seek efficient solutions for their evolving needs.
Blockchain Interoperability Market Dynamics
Driver: Growing developments in dApps
The rapid development and widespread adoption of dApps across industries like finance, supply chain management, and healthcare drive the blockchain interoperability market. Companies such as VeChain and Waltonchain utilize blockchain interoperability to enhance transparency and efficiency in supply chain management. Projects like Polkadot and Cosmos pioneer cross-chain interoperability solutions in finance, enabling dApps to access diverse functionalities and exchange assets. Interoperability protocols like the IBC protocol bridge isolated blockchains, while collaborations between platforms like Ethereum and Polkadot strengthen the dApp ecosystem. The increasing presence of dApps and the need for seamless cross-network operation fuel the demand for robust blockchain interoperability solutions, driving ongoing advancements in the field.
Restraint: Scalability issues
Scalability issues in blockchain networks stem from the inherent design and consensus mechanisms governing their operation. As participant and transaction numbers increase, the decentralized nature of blockchain necessitates resource-intensive and time-consuming consensus processes, leading to bottlenecks and delays. Public and permissionless blockchains like Bitcoin and Ethereum face notable scalability challenges due to block size limits and congestion issues. Scaling solutions like the Lightning Network and Ethereum 2.0 have been introduced to address these limitations. However, achieving seamless blockchain interoperability requires efficient, high-throughput networks capable of handling large-scale data transfers and interoperable transactions. While progress has been made, scalability remains an ongoing concern for widespread adoption and smooth cross-chain asset and data exchange.
Opportunity: Interconnected IoT
Blockchain interoperability provides a valuable opportunity for the IoT ecosystem by enabling secure and transparent data exchange, authentication, and automation across multiple IoT networks. It allows IoT devices from different manufacturers and platforms to seamlessly communicate and share data, eliminating data silos and fostering a unified ecosystem. With interoperability, IoT devices can leverage blockchain’s distributed ledger technology to securely record and verify transactions and sensor data, enhancing trust and data integrity. Blockchain interoperability enhances security, privacy, and decentralized identity management in IoT deployments. These advancements drive efficiency, cost reduction, and automation, enabling innovative IoT applications in smart cities, supply chain management, healthcare, and energy management. Ultimately, blockchain interoperability empowers the IoT by creating a robust and trusted ecosystem for seamless data exchange and collaborative interactions.
Challenge: Lack of awareness and understanding
A significant obstacle to blockchain interoperability is the limited awareness and understanding of the technology, especially among SMEs. Many companies lack knowledge about blockchain and its potential applications. The dominance of technical experts and a technology-centric approach exacerbate this challenge, hindering investment and stifling innovation. To overcome this hurdle, a more business-focused approach is needed to improve the user experience for non-technical individuals. Organizations should prioritize educational initiatives to enhance understanding of blockchain technology at all levels, making it accessible and understandable to a broader audience. By doing so, the barriers to blockchain interoperability can be gradually overcome, enabling wider adoption and unlocking its full potential.
Blockchain Interoperability Market Ecosystem
The healthcare vertical is forecasted to register the highest CAGR in the blockchain interoperability market
The healthcare sector is witnessing remarkable growth in the blockchain interoperability market, primarily driven by the increasing demand for streamlined data exchange among multiple stakeholders. This includes hospitals, clinics, insurers, and patients who require a secure and standardized means of communication. By leveraging blockchain interoperability, the industry tackles the challenge of fragmented healthcare records, resulting in improved access to comprehensive patient information. One of the notable advantages of blockchain technology in healthcare is its robust security features, which ensure data protection and compliance with regulatory guidelines. Moreover, the implementation of blockchain-enabled innovations in areas such as patient consent management, clinical trials, supply chain transparency, and fraud prevention further propels the expansion of blockchain interoperability in the healthcare industry.
By region, North America accounts for the highest market size during the forecast period.
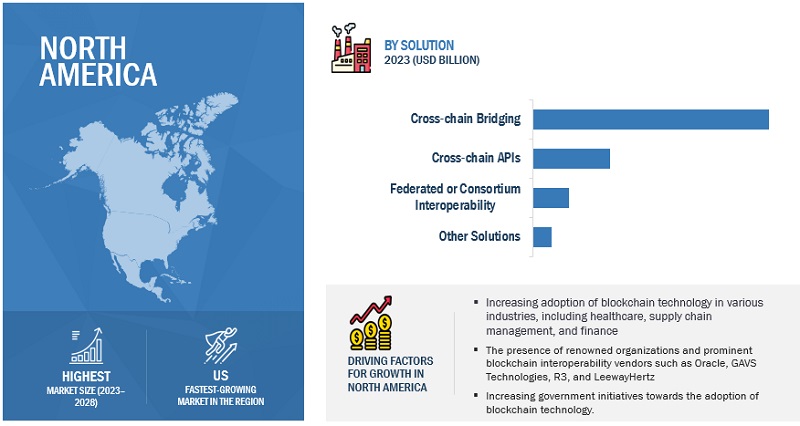
Due to several key factors, the North American region holds the highest market size in the blockchain interoperability market. These include the region’s increasing adoption of blockchain technology in various industries, such as healthcare, supply chain management, and finance. Additionally, well-established vendors originating from North America and government initiatives and investments have contributed to the region’s high market size. With a proactive approach to fostering innovation and collaboration, North America has positioned itself as a leading hub for blockchain interoperability solutions.
List of TOP Blockchain Interoperability Market Companies
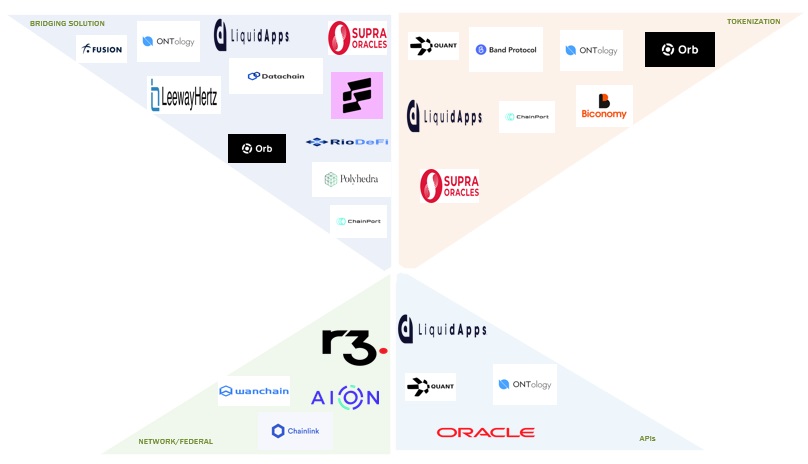
Some of the well-established and key market players in the blockchain interoperability market include Oracle (US), R3 (US), GAVS Technologies (US), LeewayHertz (US), Ontology (Singapore), Inery (Singapore), Fusion Foundation (Singapore), Quant Network (UK), Band Protocol (Thailand), LiquidApps (Israel), LI.FI (Germany), Biconomy (Singapore), Datachain (Japan), RioDeFi (China), Polyhedra Networks (Italy), SupraOracles (US), Orb Labs (US), and ChainPort (Israel).
Scope of the Report
|
Report Metrics |
Details |
|
Market size available for years |
2018-2028 |
|
Base year considered |
2022 |
|
Forecast period |
2023–2028 |
|
Forecast units |
Value (USD Million/Billion) |
|
Segments Covered |
Solutions, Applications, Verticals, and Regions |
|
Geographies covered |
North America, Europe, Asia Pacific, Middle East and Africa, and Latin America |
|
List of Blockchain Interoperability Market Companies |
Major vendors in the global blockchain interoperability market include Oracle (US), R3 (US), GAVS Technologies (US), LeewayHertz (US), Ontology (Singapore), Inery (Singapore), Fusion Foundation (Singapore), Quant Network (UK), Band Protocol (Thailand), LiquidApps (Israel), LI.FI (Germany), Biconomy (Singapore), Datachain (Japan), RioDeFi (China), Polyhedra Networks (Italy), SupraOracles (US), Orb Labs (US), and ChainPort (Israel). |
The study categorizes the blockchain interoperability market by solutions, applications, verticals, and regions.
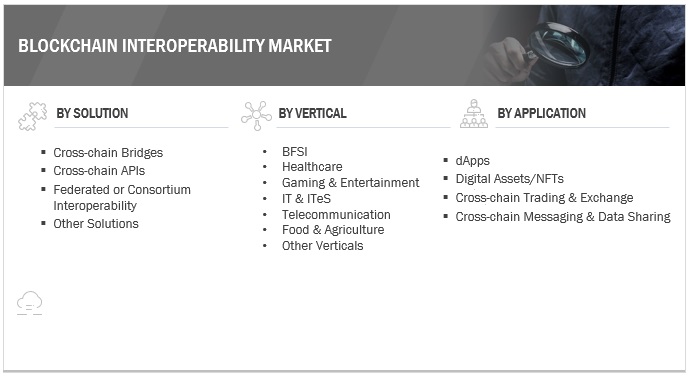
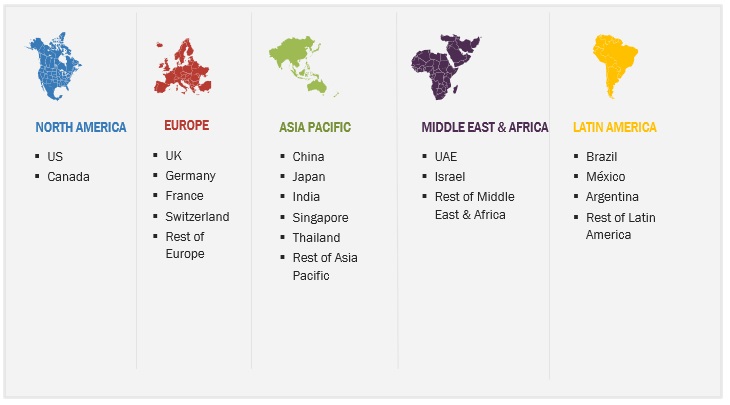
Recent Developments
- In January 2023, Oracle (US) enhanced its Oracle Blockchain Platform, introducing new capabilities to support interoperability and improve blockchain solution development. Its key features include OAuth 2.0 support for secure callback delivery, expanded web3 API support, Ethereum interoperability for atomic transactions, extended tokenization SDKs for advanced tokenization solutions, and TTF-based tokenization support for exchange across different fungible tokens.
- In February 2022, LeewayHertz partnered with XDC Network (US) to advance blockchain solutions for global trade and finance. Their collaboration aims to enhance the XDC Network ecosystem and address scalability and sustainability challenges in the blockchain industry. While the partnership’s primary focus is on developing decentralized and scalable solutions, such as SDKs and upcoming projects like the XDC NFT dApp and XDC Explorer, their joint efforts also hint at the potential for blockchain interoperability.
- In January 2022, Ontology introduced the Ethereum Virtual Machine (EVM), allowing EVM-centric developers to construct decentralized applications on its blockchain platform. The Ontology EVM reduces migration costs, lowers gas fees, and offers faster block production. Developers can leverage the ONTO Wallet and ONT ID for broader adoption.
- In October 2021, R3 (US) acquired Ivno (UK) to enhance blockchain interoperability. Ivno’s platform enables rapid tokenization of assets and compliant, secure transactions. Integrating Ivno’s capabilities strengthens R3’s ability to optimize balance sheet management and explore stablecoin models using blockchain technology.
- In October 2021, Inery (Singapore) enhanced its decentralized storage and database solution, which integrates blockchain technology with distributed database properties, potentially contributing to blockchain interoperability. With a focus on data decentralization, security, and reducing breaches, Inery offers a relevant solution for decentralized data management.
Frequently Asked Questions (FAQ):
What are the opportunities in the global blockchain interoperability market?
The growing demand for Inter-Blockchain Communication (IBC), the rising need for seamless cross-chain asset transfers, the emphasis on regulatory compliance and standardized practices, and advancements in decentralized applications (dApps) are the market opportunities for the global blockchain interoperability market.
What is the definition of the blockchain interoperability market?
Blockchain Interoperability entails the establishment of a communication network that facilitates the sharing and trading of digital assets, data, and messages among different blockchains. The primary objective is to unlock the full potential of blockchain technology across diverse industry verticals. Additionally, essential to this endeavor is the implementation of cross-chain bridging, leveraging smart contracts and tokens to create an interconnected framework for seamless blockchain interactions.
Which region is expected to show the highest market share in the blockchain interoperability market?
North America is expected to account for the largest market share during the forecast period.
What are the major market players covered in the report?
Major vendors, namely, include Oracle (US), R3 (US), GAVS Technologies (US), LeewayHertz (US), Ontology (Singapore), Inery (Singapore), Fusion Foundation (Singapore), Quant Network (UK), Band Protocol (Thailand), LiquidApps (Israel), LI.FI (Germany), Biconomy (Singapore), Datachain (Japan), RioDeFi (China), Polyhedra Networks (Italy), SupraOracles (US), Orb Labs (US), and ChainPort (Israel).
What is the current size of the global blockchain interoperability market?
The global blockchain interoperability market size is projected to grow from USD 0.3 Billion in 2023 to USD 1.0 Billion by 2028 at a Compound Annual Growth Rate (CAGR) of 27.2% during the forecast period.
To speak to our analyst for a discussion on the above findings, click Speak to Analyst


- 5.1 INTRODUCTION
-
5.2 MARKET DYNAMICSDRIVERS- Demand for IBC to enhance growth and efficiency of blockchain technology- Development in dApps- Growing demand for cross-chain asset transfers- Regulatory compliance and standardsRESTRAINTS- Technical challenges- Scalability issuesOPPORTUNITIES- Enhanced collaboration and ecosystem development- Interconnected IoT- New market exploration and cross-border transactionsCHALLENGES- Interoperability trilemma- Lack of awareness and understanding
-
5.3 CASE STUDY ANALYSISBLOCKCHAIN TRANSFORMED SUPPLY CHAINS THROUGH INTEROPERABILITY AND COLLABORATIONROUTER CHAIN FACILITATED CROSS-CHAIN GOVERNANCE AND INTEROPERABILITY IN BLOCKCHAIN NETWORKSINTERCHAIN PROTOCOL’S CROSS-CHAIN INTEROPERABILITY ENABLED SEAMLESS TRADING ACROSS DIFFERENT BLOCKCHAIN NETWORKSCROSS-BORDER SUPPLY CHAIN TRANSPARENCY ENHANCED VISIBILITY AND TRACEABILITY BY LEVERAGING BLOCKCHAIN TECHNOLOGYINTEROPERABLE HEALTHCARE DATA EXCHANGE ENABLED EFFICIENT AND SECURE DATA FLOW
-
5.4 VALUE CHAIN ANALYSISRESEARCH AND DEVELOPMENTINTEROPERABILITY SOLUTION PROVIDERSBLOCKCHAIN NETWORK OPERATORSAPPLICATION SERVICESEDUCATION AND CONSULTATIONINFRASTRUCTURE PROVIDERSREGULATORY BODIESEND USERS AND STAKEHOLDERS
-
5.5 ECOSYSTEM/MARKET MAPECOSYSTEM
-
5.6 PORTER'S FIVE FORCES ANALYSISTHREAT FROM NEW ENTRANTSBARGAINING POWER OF SUPPLIERSBARGAINING POWER OF BUYERSTHREAT OF SUBSTITUTESINTENSITY OF COMPETITIVE RIVALRY
- 5.7 PRICING ANALYSIS
-
5.8 TECHNOLOGY ANALYSISARTIFICIAL INTELLIGENCE/MACHINE LEARNINGINTERNET OF THINGSANALYTICS TECHNOLOGIESCRYPTO TRADING AND BLOCKCHAIN INTEROPERABILITYINTEROPERABILITY PROTOCOLS
- 5.9 BLOCKCHAIN INTEROPERABILITY MECHANISM
-
5.10 BLOCKCHAIN INTEROPERABILITY APPROACHES/METHODSSIDECHAINSNOTARY SCHEMESORACLESBLOCKCHAIN ROUTERSPROTOCOLSHASHED TIMELOCKS
-
5.11 PATENT ANALYSIS
- 5.12 TRENDS AND DISRUPTIONS IMPACTING CUSTOMER BUSINESS
-
5.13 TARIFF AND REGULATORY LANDSCAPEREGULATORY BODIES, GOVERNMENT AGENCIES, AND OTHER ORGANIZATIONS
-
5.14 KEY STAKEHOLDERS AND BUYING CRITERIAKEY STAKEHOLDERS IN BUYING PROCESS
- 5.15 KEY CONFERENCES & EVENTS, 2023–2024
-
6.1 INTRODUCTIONPROTOCOL: MARKET DRIVERS
-
6.2 POLKADOTNEED TO ENABLE SEAMLESS COMMUNICATION BETWEEN DIVERSE BLOCKCHAIN NETWORKS TO DRIVE MARKET
-
6.3 COSMOSDEMAND FOR FRICTIONLESS CROSS-CHAIN ASSET TRANSFER TO DRIVE MARKET
-
6.4 AIONNEED FOR COMPREHENSIVE MULTI-BLOCKCHAIN FRAMEWORK AND ABILITY TO OVERCOME EXISTING BARRIERS TO PROPEL MARKET
-
6.5 WANCHAINRISING USE OF WCC TO BUILD INTEROPERABLE APPLICATIONS TO DRIVE MARKET
-
6.6 ARKSMARTBRIDGES AND DPOS MECHANISMS TO MAKE ARK PROTOCOL FAST, SECURE, AND EASY-TO-USE
-
6.7 ICONNEED FOR EASIER DATA TRANSFER AND CONNECT BLOCKCHAINS TO BOOST DEMAND FOR ICON PROTOCOL
-
6.8 CHAINLINKNEED FOR DECENTRALIZED ORACLE NETWORK FOR BLOCKCHAIN INTEROPERABILITY TO DRIVE MARKET
-
6.9 RENREN PROTOCOL TO BRIDGE BLOCKCHAINS TO TRANSFER ASSETS SEAMLESSLY
-
6.10 FUSIONHIERARCHICAL HYBRID CONSENSUS MECHANISM TO ENABLE DATA AND ASSET EXCHANGE AND CATALYZE BLOCKCHAIN INTEROPERABILITY
-
6.11 BLOCKNETCROSS-CHAIN ATOMIC SWAPS, XBRIDGE TECHNOLOGY, AND DECENTRALIZED GOVERNANCE MECHANISMS TO BOOST DEMAND FOR BLOCKNET PROTOCOL
-
6.12 HARMONYNEED TO ACCESS DAPPS, BUILD SMART CONTRACTS, AND HELP PLAYERS TRADE ASSETS TO BOOST MARKET
-
6.13 INTERLEDGER (RIPPLE)NEED FOR SCALABLE AND SECURE PROTOCOL TO SEND PAYMENTS ACROSS DIFFERENT LEDGERS TO DRIVE MARKET
-
6.14 ALGORANDPURE PROOF-OF-STAKE MECHANISM TO HELP ACHIEVE CONSENSUS
-
6.15 NEAR PROTOCOLWELL-OPERATED AND MAINTAINED NEAR PROTOCOL TO ENSURE DECENTRALIZATION, RESILIENCE, AND SECURITY
-
6.16 QREDONEED TO INCORPORATE TRUSTLESS ATOMIC SWAPS AND DECENTRALIZED CUSTODY SOLUTIONS TO PROPEL MARKET
-
6.17 KYVEDEMAND FOR EFFICIENT AND DECENTRALIZED DATA STORAGE AND INDEXING TO DRIVE MARKET
-
6.18 MULTICHAINNEED TO ESTABLISH STANDARDIZED FRAMEWORK FOR CROSS-CHAIN COMMUNICATION TO DRIVE DEMAND FOR MULTICHAIN PROTOCOL
-
6.19 NAORIS PROTOCOLNEED TO FACILITATE SECURE DATA EXCHANGE TO DRIVE MARKET
-
7.1 INTRODUCTIONSOLUTION: BLOCKCHAIN INTEROPERABILITY MARKET DRIVERS
-
7.2 CROSS-CHAIN BRIDGESCROSS-CHAIN BRIDGES SOLUTION TO FACILITATE SECURE DATA TRANSFER THROUGH VARIOUS MECHANISMS
-
7.3 CROSS-CHAIN APISNEED FOR SEAMLESS TRANSFER OF DIGITAL ASSETS, DATA EXCHANGE, AND TRACKING AND VERIFICATION OF SUPPLY CHAIN DATA TO BOOST MARKET
-
7.4 FEDERATED OR CONSORTIUM BLOCKCHAINSEAMLESS TRANSFER OF ASSETS AND INFORMATION TO DRIVE DEMAND FOR FEDERATED OR CONSORTIUM BLOCKCHAIN SOLUTION
-
7.5 OTHER SOLUTIONSATOMIC SWAPSBLOCKCHAIN ORACLES- Types of blockchain oracle
-
8.1 INTRODUCTIONAPPLICATION: BLOCKCHAIN INTEROPERABILITY MARKET DRIVERS
-
8.2 DIGITAL ASSETS/NFTSBLOCKCHAIN INTEROPERABILITY TO HELP NFT USERS SEAMLESSLY TRANSFER ASSETS ACROSS BLOCKCHAIN NETWORKS
-
8.3 DECENTRALIZED APPLICATIONSBLOCKCHAIN INTEROPERABILITY TO ENABLE DAPPS TO FACILITATE CROSS-CHAIN COMMUNICATION AND ASSET TRANSFER
-
8.4 CROSS-CHAIN TRADING & EXCHANGECROSS-CHAIN TRADING & EXCHANGE TO HELP IMPROVE EXPERIENCE AND REDUCE FEES
-
8.5 CROSS-CHAIN MESSAGING & DATA SHARINGCROSS-CHAIN MESSAGING & DATA SHARING TO FACILITATE TOKENS AND DIGITAL ASSETS TRANSFER
- 9.1 INTRODUCTION
-
9.2 BANKING, FINANCIAL SERVICES, AND INSURANCEDEMAND FOR CROSS-BORDER PAYMENTS, ASSET TOKENIZATION, AND KYC PROCESSES TO DRIVE MARKET
-
9.3 HEALTHCARENEED FOR SEAMLESS DATA EXCHANGE AND STREAMLINED APPROACH TO DRIVE DEMAND FOR BLOCKCHAIN INTEROPERABILITY
-
9.4 GAMING & ENTERTAINMENTNEED TO TRANSCEND DIGITAL ASSETS, FOSTER INNOVATION, AND ENHANCE EXPERIENCES TO BOOST MARKET
-
9.5 IT & ITESSTREAMLINING DATA SHARING AND ENHANCING SUPPLY CHAIN MANAGEMENT TO DRIVE DEMAND FOR BLOCKCHAIN INTEROPERABILITY
-
9.6 TELECOMMUNICATIONSSEAMLESS DATA EXCHANGE, INCREASED EFFICIENCY, AND ENHANCED SECURITY TO BOOST MARKET
-
9.7 FOOD & AGRICULTURENEED TO ACHIEVE TRANSPARENCY AND TRACEABILITY, AS WELL AS ENSURE AUTHENTICITY AND QUALITY TO PROPEL MARKET
-
9.8 OTHER VERTICALSREAL ESTATEMANUFACTURINGRETAIL & ECOMMERCEGOVERNMENT
- 10.1 INTRODUCTION
-
10.2 NORTH AMERICANORTH AMERICA: BLOCKCHAIN INTEROPERABILITY MARKET DRIVERSNORTH AMERICA: RECESSION IMPACTNORTH AMERICA: REGULATORY LANDSCAPEUS- Government initiatives to promote blockchain interoperability solutions to drive demandCANADA- IPFS initiative and investment by government to propel demand for blockchain interoperability solutions
-
10.3 EUROPEEUROPE: BLOCKCHAIN INTEROPERABILITY MARKET DRIVERSEUROPE: RECESSION IMPACTEUROPE: REGULATORY LANDSCAPEUK- Partnership between National Archives and Open Data Institute to leverage adoption of blockchain interoperability solutionsGERMANY- Government initiatives and strategies to deploy blockchain interoperability to drive marketSWITZERLAND- Favorable regulatory environment and robust financial infrastructure to propel blockchain interoperability marketREST OF EUROPE
-
10.4 ASIA PACIFICASIA PACIFIC: BLOCKCHAIN INTEROPERABILITY MARKET DRIVERSASIA PACIFIC: RECESSION IMPACTASIA PACIFIC: REGULATORY LANDSCAPECHINA- Initiatives by People's Bank of China and creation of blockchain-based trade finance platform to drive marketJAPAN- Need to explore ways to break down data silos and enhance collaboration between blockchain networks to drive marketSINGAPORE- Need to enhance air travel operations to fuel demand for blockchain interoperability solutionsINDIA- Government initiatives and demand from healthcare sector to boost marketTHAILAND- Thailand Blockchain Association to promote and provide training for blockchain interoperabilityREST OF ASIA PACIFIC
-
10.5 MIDDLE EAST & AFRICAMIDDLE EAST & AFRICA: BLOCKCHAIN INTEROPERABILITY MARKET DRIVERSMIDDLE EAST & AFRICA: RECESSION IMPACTMIDDLE EAST & AFRICA: REGULATORY LANDSCAPEMIDDLE EAST- UAE- Israel- Rest of Middle EastAFRICA- Collaboration among organizations and researchers to enable seamless communication and data sharing to boost market
-
10.6 LATIN AMERICALATIN AMERICA: BLOCKCHAIN INTEROPERABILITY MARKET DRIVERSLATIN AMERICA: RECESSION IMPACTLATIN AMERICA: REGULATORY LANDSCAPEBRAZIL- Need for secure and transparent transactions and demand for open-source blockchain platforms to drive marketMEXICO- Government initiatives and rising demand for secure and transparent transactions to propel marketARGENTINA- Research and development and collaboration with international organizations to drive demand for blockchain interoperabilityREST OF LATIN AMERICA

- 11.1 OVERVIEW
- 11.2 HISTORICAL REVENUE ANALYSIS
- 11.3 BLOCKCHAIN INTEROPERABILITY MARKET: RANKING OF KEY PLAYERS
- 11.4 MARKET SHARE ANALYSIS
-
11.5 EVALUATION QUADRANT FOR STARTUPS/SMESPROGRESSIVE COMPANIESRESPONSIVE COMPANIESDYNAMIC COMPANIESSTARTING BLOCKS
- 11.6 COMPETITIVE BENCHMARKING FOR STARTUPS/SMES
- 11.7 GLOBAL SNAPSHOT OF KEY MARKET PARTICIPANTS
-
11.8 COMPETITIVE SCENARIOPRODUCT LAUNCHES & ENHANCEMENTSDEALS
-
12.1 KEY PLAYERSORACLE- Business overview- Products/Solutions/Services offered- Recent developments- MnM viewR3- Business overview- Products/Solutions/Services offered- Recent developments- MnM viewGAVS TECHNOLOGIES- Business overview- Products/Solutions/Services offered- Recent developments- MnM viewLEEWAYHERTZ- Business overview- Products/Solutions/Services offered- Recent developments- MnM viewONTOLOGY- Business overview- Products/Solutions/Services offered- Recent developments- MnM viewINERY- Business overview- Products/Solutions/Services offered- Recent developments- MnM view
-
12.2 OTHER PLAYERSFUSION FOUNDATIONQUANT NETWORKBAND PROTOCOLLIQUID APPSLI.FIBICONOMYDATACHAINRIODEFIPOLYHEDRA NETWORKSUPRAORACLESORB LABSCHAINPORT
- 13.1 INTRODUCTION
- 13.2 LIMITATIONS
- 13.3 BLOCKCHAIN MARKET
- 13.4 DECENTRALIZED IDENTITY MARKET
- 14.1 DISCUSSION GUIDE
- 14.2 KNOWLEDGESTORE: MARKETSANDMARKETS’ SUBSCRIPTION PORTAL
- 14.3 AVAILABLE CUSTOMIZATIONS
- 14.4 RELATED REPORTS
- 14.5 AUTHOR DETAILS
- TABLE 1 USD EXCHANGE RATES, 2018–2022
- TABLE 2 FACTOR ANALYSIS
- TABLE 3 ASSUMPTIONS
- TABLE 4 LIMITATIONS
- TABLE 5 BLOCKCHAIN INTEROPERABILITY MARKET: ECOSYSTEM
- TABLE 6 MARKET: PORTER'S FIVE FORCES ANALYSIS
- TABLE 7 PRICING ANALYSIS
- TABLE 8 LIST OF REGULATORY BODIES, GOVERNMENT AGENCIES, AND OTHER ORGANIZATIONS
- TABLE 9 INFLUENCE OF STAKEHOLDERS ON BUYING PROCESS (%)
- TABLE 10 MARKET: KEY CONFERENCES & EVENTS, 2023–2024
- TABLE 11 MARKET, BY REGION, 2018–2022 (USD MILLION)
- TABLE 12 MARKET, BY REGION, 2023–2028 (USD MILLION)
- TABLE 13 MARKET, BY SOLUTION, 2018–2022 (USD MILLION)
- TABLE 14 MARKET, BY SOLUTION, 2023–2028 (USD MILLION)
- TABLE 15 CROSS-CHAIN BRIDGES: MARKET, BY REGION, 2018–2022 (USD MILLION)
- TABLE 16 CROSS-CHAIN BRIDGES: MARKET, BY REGION, 2023–2028 (USD MILLION)
- TABLE 17 CROSS-CHAIN APIS: MARKET, BY REGION, 2018–2022 (USD MILLION)
- TABLE 18 CROSS-CHAIN APIS: MARKET, BY REGION, 2023–2028 (USD MILLION)
- TABLE 19 FEDERATED OR CONSORTIUM BLOCKCHAIN: MARKET, BY REGION, 2018–2022 (USD MILLION)
- TABLE 20 FEDERATED OR CONSORTIUM BLOCKCHAIN: MARKET, BY REGION, 2023–2028 (USD MILLION)
- TABLE 21 MARKET, BY APPLICATION, 2018–2022 (USD MILLION)
- TABLE 22 BLOCKCHAIN INTEROPERABILITY MARKET, BY APPLICATION, 2023–2028 (USD MILLION)
- TABLE 23 DIGITAL ASSETS/NFTS: MARKET, BY REGION, 2018–2022 (USD MILLION)
- TABLE 24 DIGITAL ASSETS/NFTS: MARKET, BY REGION, 2023–2028 (USD MILLION)
- TABLE 25 DECENTRALIZED APPLICATIONS: MARKET, BY REGION, 2018–2022 (USD MILLION)
- TABLE 26 DECENTRALIZED APPLICATIONS: MARKET, BY REGION, 2023–2028 (USD MILLION)
- TABLE 27 CROSS-CHAIN TRADING & EXCHANGE: MARKET, BY REGION, 2018–2022 (USD MILLION)
- TABLE 28 CROSS-CHAIN TRADING & EXCHANGE: MARKET, BY REGION, 2023–2028 (USD MILLION)
- TABLE 29 CROSS-CHAIN MESSAGING & DATA SHARING: MARKET, BY REGION, 2018–2022 (USD MILLION)
- TABLE 30 CROSS-CHAIN MESSAGING & DATA SHARING: MARKET, BY REGION, 2023–2028 (USD MILLION)
- TABLE 31 BLOCKCHAIN INTEROPERABILITY MARKET, BY VERTICAL, 2018–2022 (USD MILLION)
- TABLE 32 MARKET, BY VERTICAL, 2023–2028 (USD MILLION)
- TABLE 33 BANKING, FINANCIAL SERVICES, AND INSURANCE: MARKET, BY REGION, 2018–2022 (USD MILLION)
- TABLE 34 BANKING, FINANCIAL SERVICES, AND INSURANCE: MARKET, BY REGION, 2023–2028 (USD MILLION)
- TABLE 35 HEALTHCARE: MARKET, BY REGION, 2018–2022 (USD MILLION)
- TABLE 36 HEALTHCARE: MARKET, BY REGION, 2023–2028 (USD MILLION)
- TABLE 37 GAMING & ENTERTAINMENT: MARKET, BY REGION, 2018–2022 (USD MILLION)
- TABLE 38 GAMING & ENTERTAINMENT: MARKET, BY REGION, 2023–2028 (USD MILLION)
- TABLE 39 IT & ITES: MARKET, BY REGION, 2018–2022 (USD MILLION)
- TABLE 40 IT & ITES: MARKET, BY REGION, 2023–2028 (USD MILLION)
- TABLE 41 TELECOMMUNICATIONS: MARKET, BY REGION, 2018–2022 (USD MILLION)
- TABLE 42 TELECOMMUNICATIONS: MARKET, BY REGION, 2023–2028 (USD MILLION)
- TABLE 43 FOOD & AGRICULTURE: MARKET, BY REGION, 2018–2022 (USD MILLION)
- TABLE 44 FOOD & AGRICULTURE: MARKET, BY REGION, 2023–2028 (USD MILLION)
- TABLE 45 BLOCKCHAIN INTEROPERABILITY MARKET, BY REGION, 2018–2022 (USD MILLION)
- TABLE 46 BLOCKCHAIN INTEROPERABILITY MARKET, BY REGION, 2023–2028 (USD MILLION)
- TABLE 47 NORTH AMERICA: MARKET, BY SOLUTION, 2018–2022 (USD MILLION)
- TABLE 48 NORTH AMERICA: MARKET, BY SOLUTION, 2023–2028 (USD MILLION)
- TABLE 49 NORTH AMERICA: MARKET, BY APPLICATION, 2018–2022 (USD MILLION)
- TABLE 50 NORTH AMERICA: MARKET, BY APPLICATION, 2023–2028 (USD MILLION)
- TABLE 51 NORTH AMERICA: MARKET, BY VERTICAL, 2018–2022 (USD MILLION)
- TABLE 52 NORTH AMERICA: MARKET, BY VERTICAL, 2023–2028 (USD MILLION)
- TABLE 53 NORTH AMERICA: MARKET, BY COUNTRY, 2018–2022 (USD MILLION)
- TABLE 54 NORTH AMERICA: MARKET, BY COUNTRY, 2023–2028 (USD MILLION)
- TABLE 55 US: MARKET, BY SOLUTION, 2018–2022 (USD MILLION)
- TABLE 56 US: MARKET, BY SOLUTION, 2023–2028 (USD MILLION)
- TABLE 57 US: MARKET, BY APPLICATION, 2018–2022 (USD MILLION)
- TABLE 58 US: MARKET, BY APPLICATION, 2023–2028 (USD MILLION)
- TABLE 59 US: MARKET, BY VERTICAL, 2018–2022 (USD MILLION)
- TABLE 60 US: BLOCKCHAIN INTEROPERABILITY MARKET, BY VERTICAL, 2023–2028 (USD MILLION)
- TABLE 61 CANADA: MARKET, BY SOLUTION, 2018–2022 (USD MILLION)
- TABLE 62 CANADA: MARKET, BY SOLUTION, 2023–2028 (USD MILLION)
- TABLE 63 CANADA: MARKET, BY APPLICATION, 2018–2022 (USD MILLION)
- TABLE 64 CANADA: MARKET, BY APPLICATION, 2023–2028 (USD MILLION)
- TABLE 65 CANADA: MARKET, BY VERTICAL, 2018–2022 (USD MILLION)
- TABLE 66 CANADA: MARKET, BY VERTICAL, 2023–2028 (USD MILLION)
- TABLE 67 EUROPE: MARKET, BY SOLUTION, 2018–2022 (USD MILLION)
- TABLE 68 EUROPE: MARKET, BY SOLUTION, 2023–2028 (USD MILLION)
- TABLE 69 EUROPE: MARKET, BY APPLICATION, 2018–2022 (USD MILLION)
- TABLE 70 EUROPE: MARKET, BY APPLICATION, 2023–2028 (USD MILLION)
- TABLE 71 EUROPE: MARKET, BY VERTICAL, 2018–2022 (USD MILLION)
- TABLE 72 EUROPE: MARKET, BY VERTICAL, 2023–2028 (USD MILLION)
- TABLE 73 EUROPE: MARKET, BY COUNTRY, 2018–2022 (USD MILLION)
- TABLE 74 EUROPE: MARKET, BY COUNTRY, 2023–2028 (USD MILLION)
- TABLE 75 UK: BLOCKCHAIN INTEROPERABILITY MARKET, BY SOLUTION, 2018–2022 (USD MILLION)
- TABLE 76 UK: MARKET, BY SOLUTION, 2023–2028 (USD MILLION)
- TABLE 77 UK: MARKET, BY APPLICATION, 2018–2022 (USD MILLION)
- TABLE 78 UK: MARKET, BY APPLICATION, 2023–2028 (USD MILLION)
- TABLE 79 UK: MARKET, BY VERTICAL, 2018–2022 (USD MILLION)
- TABLE 80 UK: MARKET, BY VERTICAL, 2023–2028 (USD MILLION)
- TABLE 81 GERMANY: MARKET, BY SOLUTION, 2018–2022 (USD MILLION)
- TABLE 82 GERMANY: MARKET, BY SOLUTION, 2023–2028 (USD MILLION)
- TABLE 83 GERMANY: MARKET, BY APPLICATION, 2018–2022 (USD MILLION)
- TABLE 84 GERMANY: MARKET, BY APPLICATION, 2023–2028 (USD MILLION)
- TABLE 85 GERMANY: MARKET, BY VERTICAL, 2018–2022 (USD MILLION)
- TABLE 86 GERMANY: MARKET, BY VERTICAL, 2023–2028 (USD MILLION)
- TABLE 87 SWITZERLAND: BLOCKCHAIN INTEROPERABILITY MARKET, BY SOLUTION, 2018–2022 (USD MILLION)
- TABLE 88 SWITZERLAND: MARKET, BY SOLUTION, 2023–2028 (USD MILLION)
- TABLE 89 SWITZERLAND: MARKET, BY APPLICATION, 2018–2022 (USD MILLION)
- TABLE 90 SWITZERLAND: MARKET, BY APPLICATION, 2023–2028 (USD MILLION)
- TABLE 91 SWITZERLAND: MARKET, BY VERTICAL, 2018–2022 (USD MILLION)
- TABLE 92 SWITZERLAND: MARKET, BY VERTICAL, 2023–2028 (USD MILLION)
- TABLE 93 REST OF EUROPE: MARKET, BY SOLUTION, 2018–2022 (USD MILLION)
- TABLE 94 REST OF EUROPE: MARKET, BY SOLUTION, 2023–2028 (USD MILLION)
- TABLE 95 REST OF EUROPE: MARKET, BY APPLICATION, 2018–2022 (USD MILLION)
- TABLE 96 REST OF EUROPE: MARKET, BY APPLICATION, 2023–2028 (USD MILLION)
- TABLE 97 REST OF EUROPE: MARKET, BY VERTICAL, 2018–2022 (USD MILLION)
- TABLE 98 REST OF EUROPE: MARKET, BY VERTICAL, 2023–2028 (USD MILLION)
- TABLE 99 ASIA PACIFIC: BLOCKCHAIN INTEROPERABILITY MARKET, BY SOLUTION, 2018–2022 (USD MILLION)
- TABLE 100 ASIA PACIFIC: MARKET, BY SOLUTION, 2023–2028 (USD MILLION)
- TABLE 101 ASIA PACIFIC: MARKET, BY APPLICATION, 2018–2022 (USD MILLION)
- TABLE 102 ASIA PACIFIC: MARKET, BY APPLICATION, 2023–2028 (USD MILLION)
- TABLE 103 ASIA PACIFIC: MARKET, BY VERTICAL, 2018–2022 (USD MILLION)
- TABLE 104 ASIA PACIFIC: MARKET, BY VERTICAL, 2023–2028 (USD MILLION)
- TABLE 105 ASIA PACIFIC: MARKET, BY COUNTRY, 2018–2022 (USD MILLION)
- TABLE 106 ASIA PACIFIC: MARKET, BY COUNTRY, 2023–2028 (USD MILLION)
- TABLE 107 CHINA: MARKET, BY SOLUTION, 2018–2022 (USD MILLION)
- TABLE 108 CHINA: MARKET, BY SOLUTION, 2023–2028 (USD MILLION)
- TABLE 109 CHINA: MARKET, BY APPLICATION, 2018–2022 (USD MILLION)
- TABLE 110 CHINA: MARKET, BY APPLICATION, 2023–2028 (USD MILLION)
- TABLE 111 CHINA: MARKET, BY VERTICAL, 2018–2022 (USD MILLION)
- TABLE 112 CHINA: MARKET, BY VERTICAL, 2023–2028 (USD MILLION)
- TABLE 113 JAPAN: MARKET, BY SOLUTION, 2018–2022 (USD MILLION)
- TABLE 114 JAPAN: MARKET, BY SOLUTION, 2023–2028 (USD MILLION)
- TABLE 115 JAPAN: MARKET, BY APPLICATION, 2018–2022 (USD MILLION)
- TABLE 116 JAPAN: MARKET, BY APPLICATION, 2023–2028 (USD MILLION)
- TABLE 117 JAPAN: MARKET, BY VERTICAL, 2018–2022 (USD MILLION)
- TABLE 118 JAPAN: MARKET, BY VERTICAL, 2023–2028 (USD MILLION)
- TABLE 119 SINGAPORE: BLOCKCHAIN INTEROPERABILITY MARKET, BY SOLUTION, 2018–2022 (USD MILLION)
- TABLE 120 SINGAPORE: MARKET, BY SOLUTION, 2023–2028 (USD MILLION)
- TABLE 121 SINGAPORE: MARKET, BY APPLICATION, 2018–2022 (USD MILLION)
- TABLE 122 SINGAPORE: MARKET, BY APPLICATION, 2023–2028 (USD MILLION)
- TABLE 123 SINGAPORE: MARKET, BY VERTICAL, 2018–2022 (USD MILLION)
- TABLE 124 SINGAPORE: MARKET, BY VERTICAL, 2023–2028 (USD MILLION)
- TABLE 125 INDIA: MARKET, BY SOLUTION, 2018–2022 (USD MILLION)
- TABLE 126 INDIA: MARKET, BY SOLUTION, 2023–2028 (USD MILLION)
- TABLE 127 INDIA: MARKET, BY APPLICATION, 2018–2022 (USD MILLION)
- TABLE 128 INDIA: MARKET, BY APPLICATION, 2023–2028 (USD MILLION)
- TABLE 129 INDIA: MARKET, BY VERTICAL, 2018–2022 (USD MILLION)
- TABLE 130 INDIA: MARKET, BY VERTICAL, 2023–2028 (USD MILLION)
- TABLE 131 THAILAND: MARKET, BY SOLUTION, 2018–2022 (USD MILLION)
- TABLE 132 THAILAND: MARKET, BY SOLUTION, 2023–2028 (USD MILLION)
- TABLE 133 THAILAND: MARKET, BY APPLICATION, 2018–2022 (USD MILLION)
- TABLE 134 THAILAND: MARKET, BY APPLICATION, 2023–2028 (USD MILLION)
- TABLE 135 THAILAND: MARKET, BY VERTICAL, 2018–2022 (USD MILLION)
- TABLE 136 THAILAND: MARKET, BY VERTICAL, 2023–2028 (USD MILLION)
- TABLE 137 REST OF ASIA PACIFIC: MARKET, BY SOLUTION, 2018–2022 (USD MILLION)
- TABLE 138 REST OF ASIA PACIFIC: MARKET, BY SOLUTION, 2023–2028 (USD MILLION)
- TABLE 139 REST OF ASIA PACIFIC: MARKET, BY APPLICATION, 2018–2022 (USD MILLION)
- TABLE 140 REST OF ASIA PACIFIC: MARKET, BY APPLICATION, 2023–2028 (USD MILLION)
- TABLE 141 REST OF ASIA PACIFIC: MARKET, BY VERTICAL, 2018–2022 (USD MILLION)
- TABLE 142 REST OF ASIA PACIFIC: MARKET, BY VERTICAL, 2023–2028 (USD MILLION)
- TABLE 143 MIDDLE EAST & AFRICA: MARKET, BY SOLUTION, 2018–2022 (USD MILLION)
- TABLE 144 MIDDLE EAST & AFRICA: MARKET, BY SOLUTION, 2023–2028 (USD MILLION)
- TABLE 145 MIDDLE EAST & AFRICA: MARKET, BY APPLICATION, 2018–2022 (USD MILLION)
- TABLE 146 MIDDLE EAST & AFRICA: MARKET, BY APPLICATION, 2023–2028 (USD MILLION)
- TABLE 147 MIDDLE EAST & AFRICA: MARKET, BY VERTICAL, 2018–2022 (USD MILLION)
- TABLE 148 MIDDLE EAST & AFRICA: MARKET, BY VERTICAL, 2023–2028 (USD MILLION)
- TABLE 149 MIDDLE EAST & AFRICA: MARKET, BY COUNTRY, 2018–2022 (USD MILLION)
- TABLE 150 MIDDLE EAST & AFRICA: MARKET, BY COUNTRY, 2023–2028 (USD MILLION)
- TABLE 151 LATIN AMERICA: BLOCKCHAIN INTEROPERABILITY MARKET, BY SOLUTION, 2018–2022 (USD MILLION)
- TABLE 152 LATIN AMERICA: MARKET, BY SOLUTION, 2023–2028 (USD MILLION)
- TABLE 153 LATIN AMERICA: MARKET, BY APPLICATION, 2018–2022 (USD MILLION)
- TABLE 154 LATIN AMERICA: MARKET, BY APPLICATION, 2023–2028 (USD MILLION)
- TABLE 155 LATIN AMERICA: MARKET, BY VERTICAL, 2018–2022 (USD MILLION)
- TABLE 156 LATIN AMERICA: MARKET, BY VERTICAL, 2023–2028 (USD MILLION)
- TABLE 157 LATIN AMERICA: MARKET, BY COUNTRY, 2018–2022 (USD MILLION)
- TABLE 158 LATIN AMERICA: MARKET, BY COUNTRY, 2023–2028 (USD MILLION)
- TABLE 159 BLOCKCHAIN INTEROPERABILITY MARKET: DEGREE OF COMPETITION
- TABLE 160 LIST OF STARTUPS/SMES AND FUNDING
- TABLE 161 REGIONAL FOOTPRINT OF STARTUPS/SMES
- TABLE 162 MARKET: PRODUCT LAUNCHES & ENHANCEMENTS, JANUARY 2021–MAY 2023
- TABLE 163 MARKET: DEALS, JANUARY 2021–MAY 2023
- TABLE 164 ORACLE: BUSINESS OVERVIEW
- TABLE 165 ORACLE: PRODUCTS/SOLUTIONS/SERVICES OFFERED
- TABLE 166 ORACLE: PRODUCT LAUNCHES
- TABLE 167 ORACLE: DEALS
- TABLE 168 R3: BUSINESS OVERVIEW
- TABLE 169 R3: PRODUCTS/SOLUTIONS/SERVICES OFFERED
- TABLE 170 R3: DEALS
- TABLE 171 GAVS TECHNOLOGIES: BUSINESS OVERVIEW
- TABLE 172 GAVS TECHNOLOGIES: PRODUCTS/SOLUTIONS/SERVICES OFFERED
- TABLE 173 GAVS TECHNOLOGIES: PRODUCT LAUNCHES
- TABLE 174 GAVS TECHNOLOGIES: DEALS
- TABLE 175 LEEWAYHERTZ: BUSINESS OVERVIEW
- TABLE 176 LEEWAYHERTZ: PRODUCTS/SOLUTIONS/SERVICES OFFERED
- TABLE 177 LEEWAYHERTZ: DEALS
- TABLE 178 ONTOLOGY: BUSINESS OVERVIEW
- TABLE 179 ONTOLOGY: PRODUCTS/SOLUTIONS/SERVICES OFFERED
- TABLE 180 ONTOLOGY: PRODUCT LAUNCHES
- TABLE 181 ONTOLOGY: DEALS
- TABLE 182 INERY: BUSINESS OVERVIEW
- TABLE 183 INERY: PRODUCTS/SOLUTIONS/SERVICES OFFERED
- TABLE 184 INERY: PRODUCT LAUNCHES
- TABLE 185 INERY: DEALS
- TABLE 186 ADJACENT MARKETS AND FORECASTS
- TABLE 187 BLOCKCHAIN MARKET, BY COMPONENT, 2018–2021 (USD MILLION)
- TABLE 188 BLOCKCHAIN MARKET, BY COMPONENT, 2022–2027 (USD MILLION)
- TABLE 189 BLOCKCHAIN MARKET, BY SERVICE, 2018–2021 (USD MILLION)
- TABLE 190 BLOCKCHAIN MARKET, BY SERVICE, 2022–2027 (USD MILLION)
- TABLE 191 BLOCKCHAIN MARKET, BY PROVIDER, 2018–2021 (USD MILLION)
- TABLE 192 BLOCKCHAIN MARKET, BY PROVIDER, 2022–2027 (USD MILLION)
- TABLE 193 BLOCKCHAIN MARKET, BY TYPE, 2018–2021 (USD MILLION)
- TABLE 194 BLOCKCHAIN MARKET, BY TYPE, 2022–2027 (USD MILLION)
- TABLE 195 BLOCKCHAIN MARKET, BY ORGANIZATION SIZE, 2018–2021 (USD MILLION)
- TABLE 196 BLOCKCHAIN MARKET, BY ORGANIZATION SIZE, 2022–2027 (USD MILLION)
- TABLE 197 BLOCKCHAIN MARKET, BY APPLICATION, 2018–2021 (USD MILLION)
- TABLE 198 BLOCKCHAIN MARKET, BY APPLICATION, 2022–2027 (USD MILLION)
- TABLE 199 BLOCKCHAIN MARKET, BY REGION, 2018–2021 (USD MILLION)
- TABLE 200 BLOCKCHAIN MARKET, BY REGION, 2022–2027 (USD MILLION)
- TABLE 201 DECENTRALIZED IDENTITY MARKET, BY IDENTITY TYPE, 2019–2027 (USD MILLION)
- TABLE 202 DECENTRALIZED IDENTITY MARKET, BY END-USER, 2019–2027 (USD MILLION)
- TABLE 203 DECENTRALIZED IDENTITY MARKET, BY ORGANIZATION SIZE, 2019–2027 (USD MILLION)
- TABLE 204 DECENTRALIZED IDENTITY MARKET, BY VERTICAL, 2019–2027 (USD MILLION)
- TABLE 205 DECENTRALIZED IDENTITY MARKET, BY REGION, 2019–2027 (USD MILLION)
- FIGURE 1 MARKET: RESEARCH DESIGN
- FIGURE 2 BREAKDOWN OF PRIMARY INTERVIEWS: BY COMPANY TYPE, DESIGNATION, AND REGION
- FIGURE 3 MARKET: DATA TRIANGULATION
- FIGURE 4 APPROACH 1 (SUPPLY-SIDE): REVENUE FROM SOFTWARE/SERVICES OF BLOCKCHAIN INTEROPERABILITY VENDORS
- FIGURE 5 APPROACH 1 (SUPPLY-SIDE) ANALYSIS
- FIGURE 6 MARKET ESTIMATION: RESEARCH FLOW
- FIGURE 7 MARKET SIZE ESTIMATION METHODOLOGY—TOP-DOWN APPROACH (DEMAND SIDE): SHARE OF BLOCKCHAIN INTEROPERABILITY IN OVERALL INFORMATION TECHNOLOGY MARKET
- FIGURE 8 COMPANY EVALUATION QUADRANT (STARTUPS/SMES): CRITERIA WEIGHTAGE
- FIGURE 9 GLOBAL MARKET TO WITNESS SIGNIFICANT GROWTH DURING FORECAST PERIOD
- FIGURE 10 BLOCKCHAIN INTEROPERABILITY MARKET: FASTEST-GROWING SEGMENTS
- FIGURE 11 MARKET: REGIONAL SNAPSHOT
- FIGURE 12 INCREASING ADOPTION OF BLOCKCHAIN NETWORKS FOR COMMUNICATION TO DRIVE MARKET
- FIGURE 13 CROSS-CHAIN BRIDGES SOLUTION SEGMENT TO HOLD LARGEST MARKET SIZE DURING FORECAST PERIOD
- FIGURE 14 DAPPS SEGMENT TO HOLD LARGEST MARKET SIZE DURING FORECAST PERIOD
- FIGURE 15 BANKING, FINANCIAL SERVICES, AND INSURANCE VERTICAL TO HOLD LARGEST MARKET SIZE DURING FORECAST PERIOD
- FIGURE 16 ASIA PACIFIC TO EMERGE AS BEST MARKET FOR INVESTMENTS IN NEXT FIVE YEARS
- FIGURE 17 DRIVERS, RESTRAINTS, OPPORTUNITIES, AND CHALLENGES: MARKET
- FIGURE 18 ADDRESSING SUPPLY CHAIN CHALLENGES WITH BLOCKCHAIN TECHNOLOGY
- FIGURE 19 BLOCKCHAIN INTEROPERABILITY MARKET: VALUE CHAIN ANALYSIS
- FIGURE 20 BLOCKCHAIN INTEROPERABILITY MARKET: MARKET MAP
- FIGURE 21 MARKET: PORTER'S FIVE FORCES ANALYSIS
- FIGURE 22 MARKET: MECHANISMS AND OPERATIONS
- FIGURE 23 MULTI-BLOCKCHAIN INTEGRATION VIA SIDECHAINS
- FIGURE 24 MARKET: PATENT ANALYSIS
- FIGURE 25 MARKET: TRENDS AND DISRUPTIONS IMPACTING CUSTOMER BUSINESS
- FIGURE 26 INFLUENCE OF STAKEHOLDERS ON BUYING PROCESS (%)
- FIGURE 27 BLOCKCHAIN INTEROPERABILITY APIS SOLUTION SEGMENT TO GROW AT HIGHEST CAGR DURING FORECAST PERIOD
- FIGURE 28 DIGITAL ASSETS/NFTS SEGMENT TO GROW AT HIGHEST CAGR DURING FORECAST PERIOD
- FIGURE 29 HEALTHCARE VERTICAL TO GROW AT HIGHEST CAGR DURING FORECAST PERIOD
- FIGURE 30 ASIA PACIFIC TO GROW AT HIGHEST CAGR DURING FORECAST PERIOD
- FIGURE 31 NORTH AMERICA: MARKET SNAPSHOT
- FIGURE 32 ASIA PACIFIC: MARKET SNAPSHOT
- FIGURE 33 HISTORICAL REVENUE ANALYSIS OF KEY BLOCKCHAIN INTEROPERABILITY VENDORS, 2018–2022 (USD MILLION)
- FIGURE 34 MARKET: RANKING OF KEY PLAYERS
- FIGURE 35 MARKET SHARE, 2022
- FIGURE 36 MARKET: SMES/STARTUPS EVALUATION QUADRANT (2022)
- FIGURE 37 BLOCKCHAIN INTEROPERABILITY: GLOBAL SNAPSHOT OF KEY MARKET PARTICIPANTS, 2022
- FIGURE 38 ORACLE: COMPANY SNAPSHOT
The study involved significant activities in estimating the current market size for blockchain interoperability. Intensive secondary research was conducted to collect information about blockchain interoperability and related ecosystems. The industry executives validated these findings, assumptions, and sizing across the value chain using a primary research process as a next step. Top-down and bottom-up market estimation approaches were used to estimate the market size globally, followed by the market breakup and data triangulation procedures to assess the market segment and sub-segments in blockchain interoperability.
Secondary Research Process:
In the secondary research process, various sources were referred to for identifying and collecting information regarding blockchain interoperability. These sources include annual reports, press releases, blockchain interoperability software and service vendor investor presentations, forums, vendor-certified publications, and industry/associations white papers. These secondary sources were utilized to obtain key information about the blockchain interoperability’s solutions and services supply & value chain, a list of 100+ key players and SMEs, market classification, and segmentation per the industry trends and regional markets. The secondary research also gives us insights into the key developments from market and technology perspectives, which primary respondents further validated.
The factors considered for estimating the regional market size include technological initiatives undertaken by governments of different countries, gross domestic product (GDP) growth, ICT spending, recent market developments, and market ranking analysis of primary blockchain interoperability solutions and service vendors.
Primary Research Process:
We have conducted primary research with industry executives from both the supply and demand sides. The primary sources from the supply side include chief executive officers (CEOs), vice presidents (VPs), marketing directors, and technology and innovation executives of key companies operating in the blockchain interoperability market. We have conducted primary interviews with the executives to obtain qualitative and quantitative information for blockchain interoperability.
The top-down and bottom-up approaches and various data triangulation methods were implemented in the market engineering process to estimate and forecast the market segments and subsegments. Post-market engineering process, we conducted primary research to verify and validate the critical numbers we arrived at. The primary research was also undertaken to identify the segmentation types; industry trends; the competitive landscape of the blockchain interoperability market players; and fundamental market dynamics, such as drivers, restraints, opportunities, challenges, industry trends, and key strategies.
Following is the breakup of the primary research:
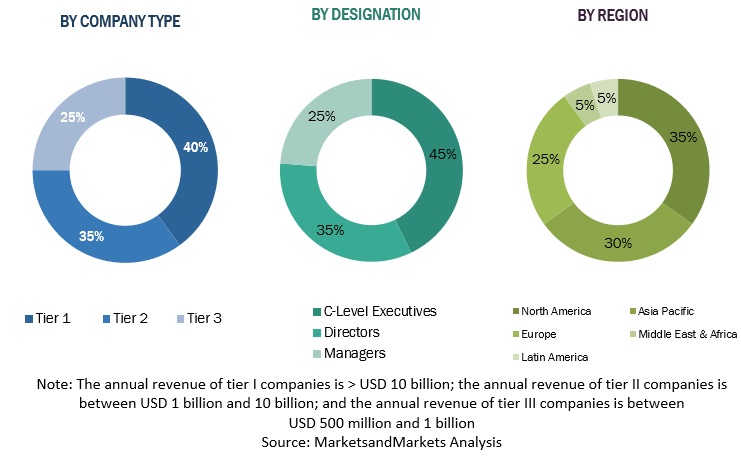
To know about the assumptions considered for the study, download the pdf brochure
Market Size Estimation Process:
For market size estimation, both top-down and bottom-up approaches were implemented to estimate, project, and forecast the size of the global and other dependent sub-segments in the overall market of blockchain interoperability.
The research methodology that has been used to estimate the market size includes these steps:
- The key players, SMEs, and startups were identified through secondary sources. Their revenue contributions in the market were determined through primary and secondary sources.
- Annual and financial reports of the publicly listed market players were considered for the company’s revenue details and,
- Primary interviews were also conducted with industry leaders to collect information about their companies, competitors, and key players in the market.
- All percentage splits and breakups were determined using secondary sources and verified through primary sources.
Top-down and Bottom-up Approach
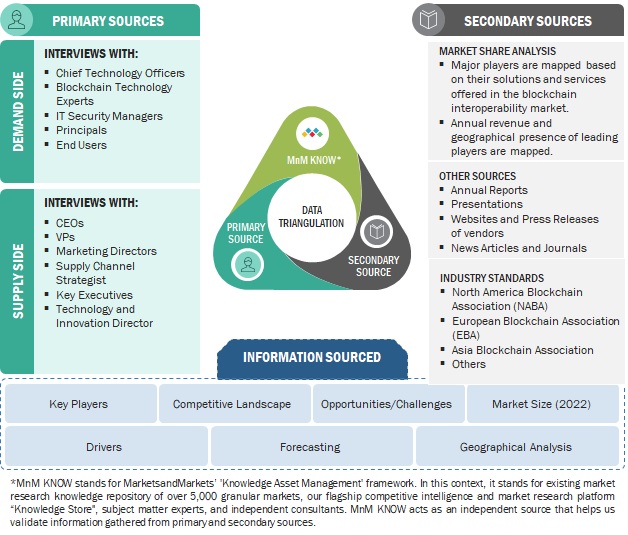
To know about the assumptions considered for the study, Request for Free Sample Report
Data Triangulation
Data triangulation is a crucial step in the market engineering process for blockchain interoperability. It involves utilizing multiple data sources and methodologies to validate and cross-reference findings, thereby enhancing the reliability and accuracy of the market segment and subsegment statistics. To conduct data triangulation, various factors and trends related to the blockchain interoperability market are studied from both the demand and supply sides. This includes analyzing data from diverse sources such as market research reports, industry publications, regulatory bodies, financial institutions, and technology providers. By examining data from different perspectives and sources, data triangulation helps mitigate potential biases and discrepancies. It provides a more comprehensive understanding of the market dynamics, including the size, growth rate, market trends, and customer preferences.
Furthermore, data triangulation aids in identifying any inconsistencies or outliers in the data, enabling researchers to refine their analysis and make informed decisions. It strengthens the credibility of the market engineering process by ensuring that the conclusions drawn are based on robust and corroborated data. Data triangulation is a rigorous and systematic approach that enhances the reliability and validity of market segment and subsegment statistics in blockchain interoperability. It provides a solid foundation for informed decision-making and strategic planning within the industry.
Market Definition
Blockchain interoperability, as defined by MarketsandMarkets, involves the development of a communication network between blockchains. This network enables the exchange and trading of digital data, assets (including NFTs), and messages. The ultimate goal is to enhance the utilization of blockchain technology across different industry sectors. Establishing cross-chain bridging, supported by smart contracts and tokens, is a critical component in creating this interconnected network of blockchains.
Key Stakeholders
- Information Technology (IT) Professionals
- Government Agencies
- Investors and Venture Capitalists
- Small and Medium-Sized Enterprises (SMEs) and Large Enterprises
- Managed and Professional Service Providers
- Blockchain Platform Vendors
- Infrastructure Providers
- Consultants/Consultancies/Advisory Firms
- System Integrators
- Third-Party Providers
- Value-added Resellers (VARs)
- Business Analysts
- Financial Services Firms
Report Objectives
-
To define, describe, and forecast the blockchain interoperability market based on solutions, applications, verticals, and regions:
- To predict and estimate the market size of five main regions: North America, Europe, Asia Pacific, Middle East & Africa, and Latin America
- To analyze the subsegments of the market with respect to individual growth trends, prospects, and contributions to the overall market
- To provide detailed information related to the primary factors (drivers, restraints, opportunities, and challenges) influencing the growth of the blockchain interoperability market
- To analyze opportunities in the market for stakeholders by identifying high-growth segments of the blockchain interoperability market
- To profile the key players of the blockchain interoperability market and comprehensively analyze their market size and core competencies.
- To track and analyze competitive developments, such as new product launches; mergers and acquisitions; and partnerships, agreements, and collaborations in the global blockchain interoperability market.
Customization Options
With the given market data, MarketsandMarkets offers customizations based on company-specific needs. The following customization options are available for the report:
Geographic Analysis
- Further breakup of the Asia Pacific market into countries contributing 75% to the regional market size
- Further breakup of the North American market into countries contributing 75% to the regional market size
- Further breakup of the Latin American market into countries contributing 75% to the regional market size
- Further breakup of the Middle Eastern and African market into countries contributing 75% to the regional market size
- Further breakup of the European market into countries contributing 75% to the regional market size
Company Information
- Detailed analysis and profiling of additional market players (up to 5)


Growth opportunities and latent adjacency in Blockchain Interoperability Market