Blood Group Typing Market by Product (Consumables, Instruments, Services), Test Type (ABO, Antigen, Antibody, HLA), Technique (Assay-based, PCR, Microarray, Massively Parallel Sequencing), End User (Hospital, Blood Banks), Region - Global Forecast to 2028
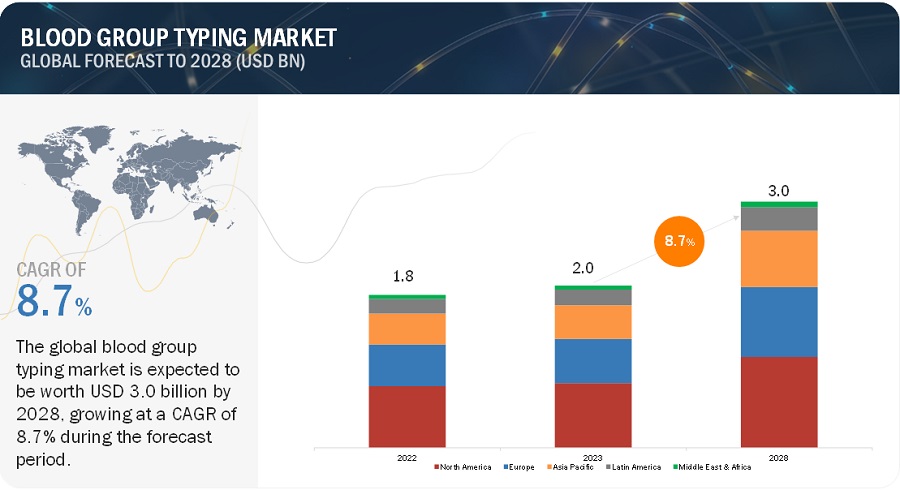
The global blood group typing market, valued at US$1.8billion in 2022, stood at US$2.0 billion in 2023 and is projected to advance at a resilient CAGR of 8.7% from 2023 to 2028, culminating in a forecasted valuation of US$3.0 billion by the end of the period. The new research study consists of an industry trend analysis of the market. The new research study consists of industry trends, pricing analysis, patent analysis, conference and webinar materials, key stakeholders, and buying behaviour in the market. The increasing frequency of road accidents contributes to the expansion of the market. Road accidents and trauma can lead to physical injuries, hemorrhagic shock, and chronic anemia, which can require major surgeries. The urgent need for blood transfusion in patients requiring immediate surgical intervention may affect the performance of testing, resulting in inadequate and incompatible blood transfusion. Compatibility testing is performed before a blood transfusion to check the compatibility of donor and recipient blood to prevent erroneous blood transfusions.
Attractive Opportunities in the Blood Group Typing Market
To know about the assumptions considered for the study, Request for Free Sample Report
Blood Group Typing Market Dynamics
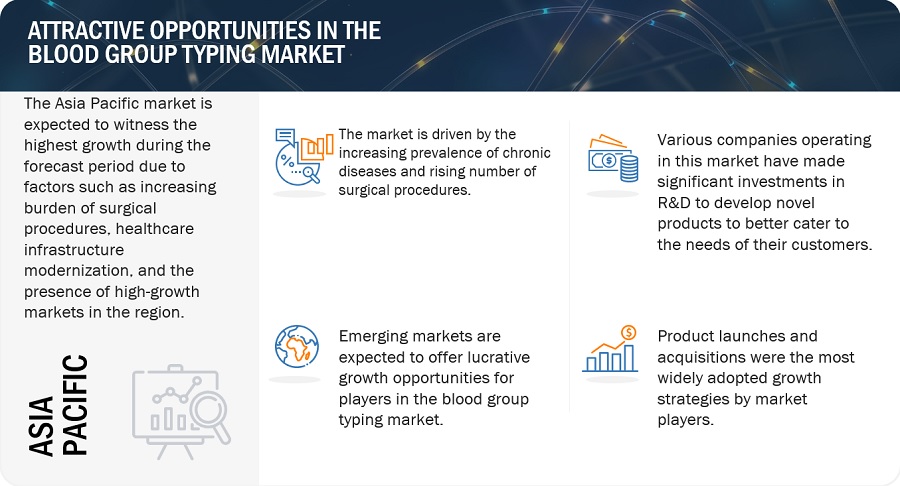
DRIVER: The increasing prevalence of chronic diseases and the rising number of surgical procedures necessitate the need for blood donations
With the growth in the prevalence of chronic diseases and surgical procedures for their treatment, the demand for blood has increased. Patients with chronic conditions often require regular blood transfusions to manage their conditions, while surgical procedures, especially major surgeries, necessitate significant amounts of blood for safe and successful outcomes. Consequently, the healthcare system has seen a steady rise in the need for blood, prompting a corresponding increase in blood donations. This is expected to positively impact the market. According to the American National Red Cross (2023), approximately 29,000 units of red blood cells are needed every day in the US in hospitals and emergency treatment facilities to treat patients suffering from chronic diseases and patients undergoing complex surgical procedures. According to the same source, ~16 million units of blood components are transfused in the US in a year.
RESTRAINT: Emergence of blood alternatives
The search for blood substitutes is not new. There already exists factor concentrates to replace fresh-frozen plasma. Although oxygen carriers in the form of perfluorocarbons have not been successful on a large scale, cultured RBCs & platelets can still replace allogeneic platelets and red cells.
Research has shown proof that red cells can be generated from stem cells. In vitro, the generation of RBCs or cultured RBCs (cRBCs) from pluripotent stem cells remains a distinct possibility. If this happens, the concepts of voluntary blood donation, blood testing, and the use of pathogen inactivation by blood centers will all become redundant. There will be minimal need for grouping, cross-matching, and testing.
OPPORTUNITY: Growth opportunities in emerging economies
Emerging economies such as South Korea, Malaysia, Vietnam, Africa, and Middle Eastern countries like Israel, Saudi Arabia, and the UAE offer significant growth opportunities to major market players operating in the market. This can be attributed to the healthcare infrastructural improvements in these countries, the growing patient population, and the rising healthcare expenditure.
Moreover, the disposable income of populations in developing and emerging countries is on the rise. This increase is another key indicator of expanding access to healthcare. According to the OECD, the purchasing power of the growing middle-class population is expected to increase to 59% by 2020 from 23% in 2009. According to the Ministry of Statistics and Programme Implementation (MOSPI), the total Gross National Disposable Income (GNDI) in India increased to USD 20,769.9 million (INR 1,538,430 million) per capita in 2019–2020. With rising disposable incomes and the increasing medical needs of the middle-class population, blood group typing product manufacturers are compelled to devise new strategies to meet this demand. Currently, emerging markets are underpenetrated by major players, which indicates a huge untapped market potential.
Blood Group Typing Ecosystem/Market Map
Consumables segment accounted for the largest share of the blood group typing industry in 2022, by product & service.
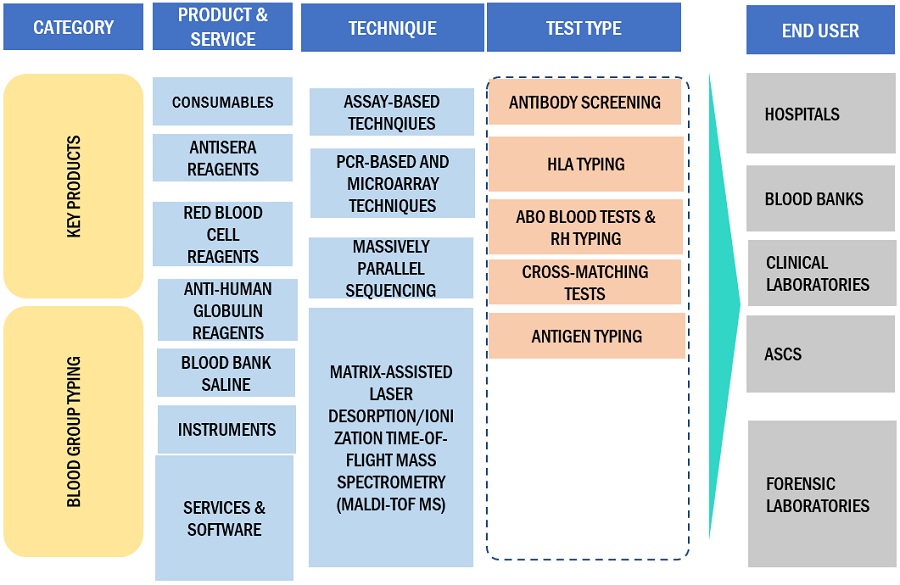
The blood group typing market is categorized into consumables, instruments, and services & software based on product & service. The consumables segment emerged as the dominant force in the market in 2022. The recurring cost associated with the frequent requirement of reagents & kits is a significant factor contributing to the market's growth. Furthermore, technological advancements in the market continuously drive the development of new and improved reagents.
ABO blood tests & Rh typing segment accounted for the largest share in the blood group typing industry in 2022, by test type.
The global blood group typing market is categorized into ABO blood tests & Rh typing, antibody screening, HLA typing, cross-matching tests, and antigen typing based on test type. In 2022, the ABO blood tests & Rh typing segment held the largest share in the global market, categorized by test type. ABO blood tests and Rh typing are often conducted in tandem to provide a comprehensive blood typing profile. While ABO typing categorizes blood into four main groups (A, B, AB, and O), Rh typing determines the presence or absence of the Rh factor (Rh-positive or Rh-negative). This dual approach enhances compatibility assessment, covering major antigens influencing transfusion and transplantation outcomes.
Assay-based techniques segment accounted for the largest share in the blood group typing industry in 2022, by technique.
Based on techniques, the blood group typing market has been segmented into assay-based techniques, PCR-based and microarray techniques, massively parallel sequencing, and other techniques. In 2022, the assay-based techniques segment accounted for the largest share of the global market. While the tube and slide methods have been foundational in blood group typing, the gel column and microplate methods have emerged as the largest and most sophisticated segments in this field. Their automation, increased sensitivity, objectivity in result interpretation, and high-throughput capabilities make them the preferred choice for modern blood banks, hospitals, and clinical laboratory settings.
North America accounted for the largest share of the blood group typing industry in 2022.
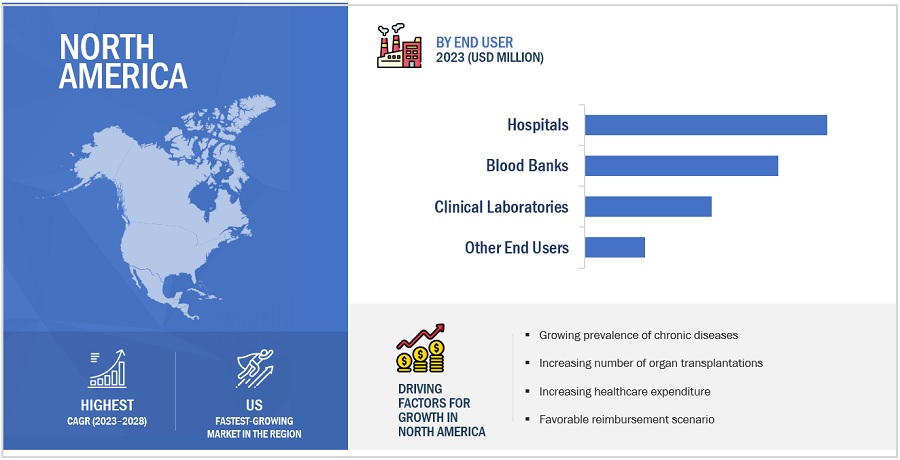
The blood group typing market is segmented into five major regions: North America, Europe, the Asia Pacific, Latin America, and the Middle East & Africa. In 2022, North America emerged as the leading contributor, claiming the largest portion of the market share in the blood group typing industry. The region has a robust infrastructure for R&D, which has led to the rapid adoption of innovative diagnostic techniques and platforms. Also, North America houses several major companies operating in the blood group typing sector. These companies have significant expertise, resources, and established distribution networks, which contribute to the region's market dominance. Also, the high burden of chronic conditions on regional healthcare systems is another major driver for market growth.
To know about the assumptions considered for the study, download the pdf brochure
The major players in this market are Bio-Rad Laboratories, Inc. (US), QuidelOrtho Corporation (US), Grifols, S.A. (Spain), Thermo Fisher Scientific Inc. (US), and Immucor, Inc. (US). The market leadership of these players stems from their comprehensive product portfolios and expansive global footprint. These dominant market players possess several advantages, including strong marketing and distribution networks, substantial research and development budgets, and well-established brand recognition.
Scope of the Blood Group Typing Industry:
|
Report Metric |
Details |
|
Market Revenue in 2023 |
$2.0 billion |
|
Estimated Value by 2028 |
$3.0 billion |
|
Revenue Rate |
Poised to grow at a CAGR of 8.7% |
|
Market Driver |
The increasing prevalence of chronic diseases and the rising number of surgical procedures necessitate the need for blood donations |
|
Market Opportunity |
Growth opportunities in emerging economies |
This report categorizes the blood group typing market to forecast revenue and analyze trends in each of the following submarkets:
By Product & Service
-
Consumables
- Antisera Reagents
- Anti-human Globulin Reagents
- Red Blood Cell Reagents
- Blood Bank Saline
- Instruments
- Services & Software
By Test Type
- ABO Blood Tests & Rh Typing
- Antibody Screening
- HLA Typing
- Cross-matching Tests
- Antigen Typing
By Technique
- Assay-based Techniques
- PCR-based and Microarray Techniques
- Massively Parallel Sequencing
- Other Techniques
By End User
- Hospitals
- Blood Banks
- Clinical Laboratories
- Other End Users
By Region
-
North America
- US
- Canada
-
Europe
- Germany
- UK
- France
- Italy
- Spain
- Rest of Europe
-
Asia Pacific
- China
- Japan
- India
- Rest of Asia Pacific
- Latin America
- Middle East & Africa
Recent Developments of Blood Group Typing Industry:
- In June 2023, Quotient Limited (Switzerland) launched its ALBA products in the Netherlands and Sweden in addition to the following geographies: Austria, France, Germany, Greece, Hungary, Italy, Luxembourg, the Netherlands, Poland, Romania, Slovakia, and Sweden.
- In May 2023, Bio-Rad Laboratories, Inc. (US) launched the IH-500TM NEXT System, a fully automated system for ID cards. The IH-500 NEXT System not only reduces instrument downtime and increases laboratory productivity but also provides the flexibility and freedom to use high-performing Bio-Rad Reagent Red Blood Cells (RBCs), as well as the lab’s own RBCs or third-party Reagent RBCs.
- In March 2022, Quotient Limited (Switzerland) received the Conformité Européenne (CE) Mark for its MosaiQ Extended Immunohematology (IH) Microarray. The expanded array of features of MosaiQ allows for the comprehensive characterization of blood donor samples (blood typing and disease screening) through a single test procedure.
- In June 2023, Quotient Limited (Switzerland) and Transmedic Pte Ltd (Singapore) signed a distribution agreement, which will enable Transmedic to distribute Alba by Quotient and MosaiQ in five countries in Southeast Asia.
- In March 2023, With the acquisition of Immucor, Inc. (US), Werfen (Spain) expanded its presence as a company of reference in the specialized diagnostics market and grew its portfolio of diagnostic solutions for hospitals and clinical laboratories.
Frequently Asked Questions (FAQ):
What is the projected market revenue value of the global blood group typing market?
The global blood group typing market boasts a total revenue value of $3.0 billion by 2028.
What is the estimated growth rate (CAGR) of the global blood group typing market?
The global blood group typing market has an estimated compound annual growth rate (CAGR) of 8.7% and a revenue size in the region of $2.0 billion in 2023.
To speak to our analyst for a discussion on the above findings, click Speak to Analyst


- 5.1 INTRODUCTION
-
5.2 MARKET DYNAMICSDRIVERS- Increasing prevalence of chronic diseases and rising number of surgical procedures necessitating need for blood donations- Growing number of road accidents, emergencies, and trauma cases necessitating blood transfusions- Increasing demand for blood group typing in prenatal testing- High usage of blood group typing in forensic sciences- Extensive R&D in blood typing- Stringent regulatory standards for blood transfusionRESTRAINTS- Emergence of blood alternativesOPPORTUNITIES- Growth opportunities in emerging economies
-
5.3 PRICING ANALYSISINDICATIVE PRICING MODEL ANALYSIS OF MARKET PLAYERSAVERAGE SELLING PRICE OF BLOOD GROUP TYPING PRODUCTS, BY KEY PLAYER
-
5.4 PATENT ANALYSISLIST OF MAJOR PATENTS
- 5.5 VALUE CHAIN ANALYSIS
- 5.6 SUPPLY CHAIN ANALYSIS
-
5.7 ECOSYSTEM ANALYSISBLOOD GROUP TYPING MARKET: ROLE IN ECOSYSTEM
-
5.8 PORTER’S FIVE FORCES ANALYSISTHREAT OF NEW ENTRANTSTHREAT OF SUBSTITUTESBARGAINING POWER OF BUYERSBARGAINING POWER OF SUPPLIERSINTENSITY OF COMPETITIVE RIVALRY
-
5.9 REGULATORY LANDSCAPENORTH AMERICA- US- CanadaEUROPEASIA PACIFIC- China- Japan- IndiaLATIN AMERICA- BrazilMIDDLE EAST
-
5.10 TRADE ANALYSISTRADE ANALYSIS FOR DIAGNOSTIC AND LABORATORY REAGENTS
- 5.11 TECHNOLOGY ANALYSIS
- 5.12 KEY CONFERENCES & EVENTS IN 2023–2024
- 5.13 PESTLE ANALYSIS
-
5.14 TRENDS/DISRUPTIONS IMPACTING CUSTOMERS’ BUSINESSES
-
5.15 KEY STAKEHOLDERS & BUYING CRITERIAKEY STAKEHOLDERS IN BUYING PROCESSBUYING CRITERIACASE STUDY ANALYSIS
- 6.1 INTRODUCTION
-
6.2 CONSUMABLESANTISERA REAGENTS- Increasing demand for cost-effective blood typing solutions to support uptake of antisera reagentsANTI-HUMAN GLOBULIN REAGENTS- Increasing number of organ transplantations to drive uptake of AHG reagentsRED BLOOD CELL REAGENTS- Higher compatibility of red blood cell reagents with variety of blood group typing techniques to support uptakeBLOOD BANK SALINE- Ability of blood bank saline to preserve integrity of RBCs to support market growth
-
6.3 INSTRUMENTSGROWING NEED FOR FASTER & MORE ACCURATE TEST RESULTS TO BOOST DEMAND FOR BLOOD GROUP TYPING INSTRUMENTS
-
6.4 SERVICES & SOFTWAREGROWING UPTAKE OF ADVANCED INSTRUMENTS TO DRIVE GROWTH IN MARKET SEGMENT
- 7.1 INTRODUCTION
-
7.2 ABO BLOOD TESTS & RH TYPINGGROWING AWARENESS OF IMPORTANCE OF BLOOD DONATION TO DRIVE GROWTH
-
7.3 ANTIBODY SCREENINGINCREASING INCIDENCE OF CANCER AND AUTOIMMUNE DISORDERS TO SUPPORT GROWTH
-
7.4 HLA TYPINGINCREASING NUMBER OF ORGAN TRANSPLANTS TO STIMULATE DEMAND FOR HLA TYPING
-
7.5 CROSS-MATCHING TESTSGROWING NEED FOR BLOOD TRANSFUSION TO PROPEL MARKET GROWTH
-
7.6 ANTIGEN TYPINGINCREASING CASES OF INCORRECT BLOOD TRANSFUSION TO FUEL GROWTH
- 8.1 INTRODUCTION
-
8.2 ASSAY-BASED TECHNIQUESAUTOMATION, SENSITIVITY, OBJECTIVITY, AND ADAPTABILITY OF ASSAY-BASED TECHNIQUES TO BOOST ADOPTION
-
8.3 PCR-BASED AND MICROARRAY TECHNIQUESHIGH ACCURACY OF PCR-BASED AND MICROARRAY TECHNIQUES TO SUPPORT GROWTH
-
8.4 MASSIVELY PARALLEL SEQUENCINGABILITY TO DETECT LOW-FREQUENCY ALLELES TO DRIVE DEMAND FOR MPS TECHNIQUES
- 8.5 OTHER TECHNIQUES
- 9.1 INTRODUCTION
-
9.2 PRIMARY NOTESKEY PRIMARY INSIGHTS
-
9.3 HOSPITALSINCREASING NUMBER OF HOSPITALS TO BOOST GROWTH
-
9.4 BLOOD BANKSGROWING NUMBER OF BLOOD DONATIONS TO PROPEL MARKET GROWTH
-
9.5 CLINICAL LABORATORIESGROWING PREVALENCE OF BLOOD DISORDERS TO BOLSTER GROWTH
- 9.6 OTHER END USERS
- 10.1 INTRODUCTION
-
10.2 NORTH AMERICANORTH AMERICA: RECESSION IMPACTUS- Increasing prevalence of chronic conditions to drive market growthCANADA- Increasing incidence of blood cancer to boost market
-
10.3 EUROPEEUROPE: RECESSION IMPACTGERMANY- Increasing healthcare expenditure to drive market growthUK- Growing number of road accidents to propel market growthFRANCE- Rising R&D expenditure in France to drive market growthITALY- Increasing number of blood donors to favor market growthSPAIN- Consolidation of laboratories in Spain to support market growthREST OF EUROPE
-
10.4 ASIA PACIFICASIA PACIFIC: RECESSION IMPACTCHINA- Growing public access to modern healthcare to drive market growthJAPAN- Universal healthcare reimbursement policy to drive market growth in JapanINDIA- Increasing private & public investments in healthcare system to drive market growthREST OF ASIA PACIFIC
-
10.5 LATIN AMERICAIMPLEMENTATION OF UNIVERSAL HEALTH COVERAGE TO SUPPORT MARKET GROWTHLATIN AMERICA: RECESSION IMPACT
-
10.6 MIDDLE EAST & AFRICASTRENGTHENING OF HEALTHCARE INFRASTRUCTURE TO SUPPORT MARKET GROWTH

- 11.1 OVERVIEW
-
11.2 STRATEGIES OF KEY PLAYERSOVERVIEW OF STRATEGIES ADOPTED BY PLAYERS IN BLOOD GROUP TYPING MARKET
- 11.3 REVENUE SHARE ANALYSIS OF TOP MARKET PLAYERS
- 11.4 MARKET SHARE ANALYSIS
-
11.5 COMPANY EVALUATION QUADRANT FOR KEY PLAYERS (2022)LIST OF EVALUATED VENDORSSTARSEMERGING LEADERSPERVASIVE PLAYERSPARTICIPANTS
-
11.6 COMPETITIVE EVALUATION QUADRANT FOR START-UPS/SMES (2022)PROGRESSIVE COMPANIESSTARTING BLOCKSRESPONSIVE COMPANIESDYNAMIC COMPANIESPRODUCT AND GEOGRAPHIC FOOTPRINT ANALYSIS
-
11.7 COMPETITIVE SCENARIOPRODUCT LAUNCHESDEALS
-
12.1 KEY PLAYERSBIO-RAD LABORATORIES, INC.- Business overview- Products offered- Recent developments- MnM viewQUIDELORTHO CORPORATION- Business overview- Products offered- Recent developments- MnM viewGRIFOLS, S.A.- Business overview- Products offered- Recent developments- MnM viewTHERMO FISHER SCIENTIFIC INC.- Business overview- Products offered- Recent developments- MnM viewIMMUCOR, INC.- Business overview- Products offered- Recent developments- MnM viewQUOTIENT LIMITED- Business overview- Products offered- Recent developmentsDANAHER- Business overview- Products offered- Recent developmentsMERCK KGAA- Business overview- Products offeredNOVACYT- Business overview- Products offeredBAG HEALTH CARE GMBH- Business overview- Products offeredRAPID LABS LTD.- Business overview- Products offered
-
12.2 OTHER PLAYERSAGENA BIOSCIENCE, INC.BIOREX DIAGNOSTICSHUMAN GESELLSCHAFT FÜR BIOCHEMICA UND DIAGNOSTICA MBHPRESTIGE DIAGNOSTICSDIALAB GMBHLORNE LABORATORIES LIMITEDATLAS MEDICAL GMBHTORAX BIOSCIENCES LIMITEDFORTRESS DIAGNOSTICSAXO SCIENCEMAXWIN HEALTH CARE PVT. LTD.ANAMOL LABORATORIES PVT. LTD.J. MITRA & CO. PVT. LTD.MEDSOURCE OZONE BIOMEDICALS PVT. LTD.
- 13.1 DISCUSSION GUIDE
- 13.2 KNOWLEDGESTORE: MARKETSANDMARKETS’ SUBSCRIPTION PORTAL
- 13.3 CUSTOMIZATION OPTIONS
- 13.4 RELATED REPORTS
- 13.5 AUTHOR DETAILS
- TABLE 1 LIST OF PRODUCTS CBER REGULATES
- TABLE 2 INDICATIVE PRICING FOR BLOOD GROUP TYPING PRODUCTS
- TABLE 3 AVERAGE SELLING PRICE OF BLOOD GROUP TYPING PRODUCTS
- TABLE 4 BLOOD GROUP TYPING MARKET: PORTER’S FIVE FORCES ANALYSIS
- TABLE 5 NORTH AMERICA: REGULATORY BODIES, GOVERNMENT AGENCIES, AND OTHER ORGANIZATIONS
- TABLE 6 ASIA PACIFIC: REGULATORY BODIES, GOVERNMENT AGENCIES, AND OTHER ORGANIZATIONS
- TABLE 7 LATIN AMERICA: REGULATORY BODIES, GOVERNMENT AGENCIES, AND OTHER ORGANIZATIONS
- TABLE 8 REST OF THE WORLD: REGULATORY BODIES, GOVERNMENT AGENCIES, AND OTHER ORGANIZATIONS
- TABLE 9 EUROPE: CLASSIFICATION OF DEVICES
- TABLE 10 JAPAN: TIME, COST, AND COMPLEXITY OF REGISTRATION PROCESS
- TABLE 11 IMPORT DATA FOR DIAGNOSTIC AND LABORATORY REAGENTS, BY COUNTRY, 2018–2022 (USD MILLION)
- TABLE 12 EXPORT DATA FOR DIAGNOSTIC AND LABORATORY REAGENTS, BY COUNTRY, 2018–2022 (USD MILLION)
- TABLE 13 BLOOD GROUP TYPING MARKET: DETAILED LIST OF CONFERENCES & EVENTS
- TABLE 14 INFLUENCE OF STAKEHOLDERS IN BUYING PROCESS OF BLOOD GROUP TYPING PRODUCTS (%)
- TABLE 15 KEY BUYING CRITERIA FOR BLOOD GROUP TYPING PRODUCTS
- TABLE 16 BLOOD GROUP TYPING MARKET, BY PRODUCT & SERVICE, 2021–2028 (USD MILLION)
- TABLE 17 KEY CONSUMABLES AVAILABLE IN MARKET
- TABLE 18 BLOOD GROUP TYPING CONSUMABLES MARKET, BY REGION, 2021–2028 (USD MILLION)
- TABLE 19 BLOOD GROUP TYPING CONSUMABLES MARKET, BY TYPE, 2021–2028 (USD MILLION)
- TABLE 20 ANTISERA REAGENTS MARKET, BY REGION, 2021–2028 (USD MILLION)
- TABLE 21 ANTI-HUMAN GLOBULIN REAGENTS MARKET, BY REGION, 2021–2028 (USD MILLION)
- TABLE 22 RED BLOOD CELL REAGENTS MARKET, BY REGION, 2021–2028 (USD MILLION)
- TABLE 23 BLOOD BANK SALINE MARKET, BY REGION, 2021–2028 (USD MILLION)
- TABLE 24 KEY INSTRUMENTS AVAILABLE IN MARKET
- TABLE 25 BLOOD GROUP TYPING INSTRUMENTS MARKET, BY REGION, 2021–2028 (USD MILLION)
- TABLE 26 BLOOD GROUP TYPING SERVICES & SOFTWARE MARKET, BY REGION, 2021–2028 (USD MILLION)
- TABLE 27 BLOOD GROUP TYPING MARKET, BY TEST TYPE, 2021–2028 (USD MILLION)
- TABLE 28 BLOOD GROUP TYPING MARKET FOR ABO BLOOD TESTS & RH TYPING, BY REGION, 2021–2028 (USD MILLION)
- TABLE 29 BLOOD GROUP TYPING MARKET FOR ANTIBODY SCREENING, BY REGION, 2021–2028 (USD MILLION)
- TABLE 30 BLOOD GROUP TYPING MARKET FOR HLA TYPING, BY REGION, 2021–2028 (USD MILLION)
- TABLE 31 BLOOD GROUP TYPING MARKET FOR CROSS-MATCHING TESTS, BY REGION, 2021–2028 (USD MILLION)
- TABLE 32 BLOOD GROUP TYPING MARKET FOR ANTIGEN TYPING, BY REGION, 2021–2028 (USD MILLION)
- TABLE 33 BLOOD GROUP TYPING MARKET, BY TECHNIQUE, 2021–2028 (USD MILLION)
- TABLE 34 BLOOD GROUP TYPING MARKET FOR ASSAY-BASED TECHNIQUES, BY REGION, 2021–2028 (USD MILLION)
- TABLE 35 BLOOD GROUP TYPING MARKET FOR PCR-BASED AND MICROARRAY TECHNIQUES, BY REGION, 2021–2028 (USD MILLION)
- TABLE 36 BLOOD GROUP TYPING MARKET FOR MASSIVELY PARALLEL SEQUENCING, BY REGION, 2021–2028 (USD MILLION)
- TABLE 37 BLOOD GROUP TYPING MARKET FOR OTHER TECHNIQUES, BY REGION, 2021–2028 (USD MILLION)
- TABLE 38 BLOOD GROUP TYPING MARKET, BY END USER, 2021–2028 (USD MILLION)
- TABLE 39 BLOOD GROUP TYPING MARKET FOR HOSPITALS, BY REGION, 2021–2028 (USD MILLION)
- TABLE 40 BLOOD GROUP TYPING MARKET FOR BLOOD BANKS, BY REGION, 2021–2028 (USD MILLION)
- TABLE 41 BLOOD GROUP TYPING MARKET FOR CLINICAL LABORATORIES, BY REGION, 2021–2028 (USD MILLION)
- TABLE 42 BLOOD GROUP TYPING MARKET FOR OTHER END USERS, BY REGION, 2021–2028 (USD MILLION)
- TABLE 43 BLOOD GROUP TYPING MARKET, BY REGION, 2021–2028 (USD MILLION)
- TABLE 44 NORTH AMERICA: BLOOD GROUP TYPING MARKET, BY COUNTRY, 2021–2028 (USD MILLION)
- TABLE 45 NORTH AMERICA: BLOOD GROUP TYPING MARKET, BY PRODUCT & SERVICE, 2021–2028 (USD MILLION)
- TABLE 46 NORTH AMERICA: BLOOD GROUP TYPING MARKET, BY TEST TYPE, 2021–2028 (USD MILLION)
- TABLE 47 NORTH AMERICA: BLOOD GROUP TYPING MARKET, BY TECHNIQUE, 2021–2028 (USD MILLION)
- TABLE 48 NORTH AMERICA: BLOOD GROUP TYPING MARKET, BY END USER, 2021–2028 (USD MILLION)
- TABLE 49 ESTIMATED NUMBER OF SINGLE ORGAN TRANSPLANTS PERFORMED IN US
- TABLE 50 US: BLOOD GROUP TYPING MARKET, BY PRODUCT & SERVICE, 2021–2028 (USD MILLION)
- TABLE 51 US: BLOOD GROUP TYPING MARKET, BY TEST TYPE, 2021–2028 (USD MILLION)
- TABLE 52 US: BLOOD GROUP TYPING MARKET, BY TECHNIQUE, 2021–2028 (USD MILLION)
- TABLE 53 US: BLOOD GROUP TYPING MARKET, BY END USER, 2021–2028 (USD MILLION)
- TABLE 54 CANADA: BLOOD GROUP TYPING MARKET, BY PRODUCT & SERVICE, 2021–2028 (USD MILLION)
- TABLE 55 CANADA: BLOOD GROUP TYPING MARKET, BY TEST TYPE, 2021–2028 (USD MILLION)
- TABLE 56 CANADA: BLOOD GROUP TYPING MARKET, BY TECHNIQUE, 2021–2028 (USD MILLION)
- TABLE 57 CANADA: BLOOD GROUP TYPING MARKET, BY END USER, 2021–2028 (USD MILLION)
- TABLE 58 EUROPE: BLOOD GROUP TYPING MARKET, BY COUNTRY, 2021–2028 (USD MILLION)
- TABLE 59 EUROPE: BLOOD GROUP TYPING MARKET, BY PRODUCT & SERVICE, 2021–2028 (USD MILLION)
- TABLE 60 EUROPE: BLOOD GROUP TYPING MARKET, BY TEST TYPE, 2021–2028 (USD MILLION)
- TABLE 61 EUROPE: BLOOD GROUP TYPING MARKET, BY TECHNIQUE, 2021–2028 (USD MILLION)
- TABLE 62 EUROPE: BLOOD GROUP TYPING MARKET, BY END USER, 2021–2028 (USD MILLION)
- TABLE 63 GERMANY: CANCER INCIDENCE, BY TYPE, 2020
- TABLE 64 GERMANY: BLOOD GROUP TYPING MARKET, BY PRODUCT & SERVICE, 2021–2028 (USD MILLION)
- TABLE 65 GERMANY: BLOOD GROUP TYPING MARKET, BY TEST TYPE, 2021–2028 (USD MILLION)
- TABLE 66 GERMANY: BLOOD GROUP TYPING MARKET, BY TECHNIQUE, 2021–2028 (USD MILLION)
- TABLE 67 GERMANY: BLOOD GROUP TYPING MARKET, BY END USER, 2021–2028 (USD MILLION)
- TABLE 68 UK: BLOOD GROUP TYPING MARKET, BY PRODUCT & SERVICE, 2021–2028 (USD MILLION)
- TABLE 69 UK: BLOOD GROUP TYPING MARKET, BY TEST TYPE, 2021–2028 (USD MILLION)
- TABLE 70 UK: BLOOD GROUP TYPING MARKET, BY TECHNIQUE, 2021–2028 (USD MILLION)
- TABLE 71 UK: BLOOD GROUP TYPING MARKET, BY END USER, 2021–2028 (USD MILLION)
- TABLE 72 FRANCE: BLOOD GROUP TYPING MARKET, BY PRODUCT & SERVICE, 2021–2028 (USD MILLION)
- TABLE 73 FRANCE: BLOOD GROUP TYPING MARKET, BY TEST TYPE, 2021–2028 (USD MILLION)
- TABLE 74 FRANCE: BLOOD GROUP TYPING MARKET, BY TECHNIQUE, 2021–2028 (USD MILLION)
- TABLE 75 FRANCE: BLOOD GROUP TYPING MARKET, BY END USER, 2021–2028 (USD MILLION)
- TABLE 76 ITALY: BLOOD GROUP TYPING MARKET, BY PRODUCT & SERVICE, 2021–2028 (USD MILLION)
- TABLE 77 ITALY: BLOOD GROUP TYPING MARKET, BY TEST TYPE, 2021–2028 (USD MILLION)
- TABLE 78 ITALY: BLOOD GROUP TYPING MARKET, BY TECHNIQUE, 2021–2028 (USD MILLION)
- TABLE 79 ITALY: BLOOD GROUP TYPING MARKET, BY END USER, 2021–2028 (USD MILLION)
- TABLE 80 SPAIN: BLOOD GROUP TYPING MARKET, BY PRODUCT & SERVICE, 2021–2028 (USD MILLION)
- TABLE 81 SPAIN: BLOOD GROUP TYPING MARKET, BY TEST TYPE, 2021–2028 (USD MILLION)
- TABLE 82 SPAIN: BLOOD GROUP TYPING MARKET, BY TECHNIQUE, 2021–2028 (USD MILLION)
- TABLE 83 SPAIN: BLOOD GROUP TYPING MARKET, BY END USER, 2021–2028 (USD MILLION)
- TABLE 84 REST OF EUROPE: PERCENTAGE OF GDP ON HEALTHCARE EXPENDITURE, BY COUNTRY
- TABLE 85 REST OF EUROPE: BLOOD GROUP TYPING MARKET, BY PRODUCT & SERVICE, 2021–2028 (USD MILLION)
- TABLE 86 REST OF EUROPE: BLOOD GROUP TYPING MARKET, BY TEST TYPE, 2021–2028 (USD MILLION)
- TABLE 87 REST OF EUROPE: BLOOD GROUP TYPING MARKET, BY TECHNIQUE, 2021–2028 (USD MILLION)
- TABLE 88 REST OF EUROPE: BLOOD GROUP TYPING MARKET, BY END USER, 2021–2028 (USD MILLION)
- TABLE 89 ASIA PACIFIC: BLOOD GROUP TYPING MARKET, BY COUNTRY, 2021–2028 (USD MILLION)
- TABLE 90 ASIA PACIFIC: BLOOD GROUP TYPING MARKET, BY PRODUCT & SERVICE, 2021–2028 (USD MILLION)
- TABLE 91 ASIA PACIFIC: BLOOD GROUP TYPING MARKET, BY TEST TYPE, 2021–2028 (USD MILLION)
- TABLE 92 ASIA PACIFIC: BLOOD GROUP TYPING MARKET, BY TECHNIQUE, 2021–2028 (USD MILLION)
- TABLE 93 ASIA PACIFIC: BLOOD GROUP TYPING MARKET, BY END USER, 2021–2028 (USD MILLION)
- TABLE 94 CHINA: HEMATOLOGY CANCER INCIDENCE, BY TYPE, 2020
- TABLE 95 CHINA: BLOOD GROUP TYPING MARKET, BY PRODUCT & SERVICE, 2021–2028 (USD MILLION)
- TABLE 96 CHINA: BLOOD GROUP TYPING MARKET, BY TEST TYPE, 2021–2028 (USD MILLION)
- TABLE 97 CHINA: BLOOD GROUP TYPING MARKET, BY TECHNIQUE, 2021–2028 (USD MILLION)
- TABLE 98 CHINA: BLOOD GROUP TYPING MARKET, BY END USER, 2021–2028 (USD MILLION)
- TABLE 99 JAPAN: BLOOD GROUP TYPING MARKET, BY PRODUCT & SERVICE, 2021–2028 (USD MILLION)
- TABLE 100 JAPAN: BLOOD GROUP TYPING MARKET, BY TEST TYPE, 2021–2028 (USD MILLION)
- TABLE 101 JAPAN: BLOOD GROUP TYPING MARKET, BY TECHNIQUE, 2021–2028 (USD MILLION)
- TABLE 102 JAPAN: BLOOD GROUP TYPING MARKET, BY END USER, 2021–2028 (USD MILLION)
- TABLE 103 INDIA: BLOOD GROUP TYPING MARKET, BY PRODUCT & SERVICE, 2021–2028 (USD MILLION)
- TABLE 104 INDIA: BLOOD GROUP TYPING MARKET, BY TEST TYPE, 2021–2028 (USD MILLION)
- TABLE 105 INDIA: BLOOD GROUP TYPING MARKET, BY TECHNIQUE, 2021–2028 (USD MILLION)
- TABLE 106 INDIA: BLOOD GROUP TYPING MARKET, BY END USER, 2021–2028 (USD MILLION)
- TABLE 107 REST OF ASIA PACIFIC: BLOOD GROUP TYPING MARKET, BY PRODUCT & SERVICE, 2021–2028 (USD MILLION)
- TABLE 108 REST OF ASIA PACIFIC: BLOOD GROUP TYPING MARKET, BY TEST TYPE, 2021–2028 (USD MILLION)
- TABLE 109 REST OF ASIA PACIFIC: BLOOD GROUP TYPING MARKET, BY TECHNIQUE, 2021–2028 (USD MILLION)
- TABLE 110 REST OF ASIA PACIFIC: BLOOD GROUP TYPING MARKET, BY END USER, 2021–2028 (USD MILLION)
- TABLE 111 BRAZIL: HEMATOLOGY CANCER INCIDENCE, BY TYPE, 2020
- TABLE 112 LATIN AMERICA: BLOOD GROUP TYPING MARKET, BY PRODUCT & SERVICE, 2021–2028 (USD MILLION)
- TABLE 113 LATIN AMERICA: BLOOD GROUP TYPING MARKET, BY TEST TYPE, 2021–2028 (USD MILLION)
- TABLE 114 LATIN AMERICA: BLOOD GROUP TYPING MARKET, BY TECHNIQUE, 2021–2028 (USD MILLION)
- TABLE 115 LATIN AMERICA: BLOOD GROUP TYPING MARKET, BY END USER, 2021–2028 (USD MILLION)
- TABLE 116 MIDDLE EAST & AFRICA: BLOOD GROUP TYPING MARKET, BY PRODUCT & SERVICE, 2021–2028 (USD MILLION)
- TABLE 117 MIDDLE EAST & AFRICA: BLOOD GROUP TYPING MARKET, BY TEST TYPE, 2021–2028 (USD MILLION)
- TABLE 118 MIDDLE EAST & AFRICA: BLOOD GROUP TYPING MARKET, BY TECHNIQUE, 2021–2028 (USD MILLION)
- TABLE 119 MIDDLE EAST & AFRICA: BLOOD GROUP TYPING MARKET, BY END USER, 2021–2028 (USD MILLION)
- TABLE 120 OVERVIEW OF STRATEGIES DEPLOYED BY KEY BLOOD GROUP TYPING MANUFACTURING COMPANIES
- TABLE 121 BLOOD GROUP TYPING MARKET: DEGREE OF COMPETITION
- TABLE 122 BLOOD GROUP TYPING MARKET: COMPETITIVE BENCHMARKING OF KEY PLAYERS
- TABLE 123 COMPANY PRODUCT & SERVICE FOOTPRINT
- TABLE 124 COMPANY REGIONAL FOOTPRINT
- TABLE 125 BLOOD GROUP TYPING MARKET: DETAILED LIST OF KEY START-UPS/SMES
- TABLE 126 KEY PRODUCT LAUNCHES & APPROVALS (JANUARY 2020–AUGUST 2023)
- TABLE 127 KEY DEALS (JANUARY 2020–AUGUST 2023)
- TABLE 128 BIO-RAD LABORATORIES, INC.: BUSINESS OVERVIEW
- TABLE 129 QUIDELORTHO CORPORATION: BUSINESS OVERVIEW
- TABLE 130 GRIFOLS, S.A.: BUSINESS OVERVIEW
- TABLE 131 THERMO FISHER SCIENTIFIC INC.: BUSINESS OVERVIEW
- TABLE 132 IMMUCOR, INC.: BUSINESS OVERVIEW
- TABLE 133 QUOTIENT LIMITED: BUSINESS OVERVIEW
- TABLE 134 DANAHER: BUSINESS OVERVIEW
- TABLE 135 MERCK KGAA: BUSINESS OVERVIEW
- TABLE 136 NOVACYT: BUSINESS OVERVIEW
- TABLE 137 BAG HEALTH CARE GMBH: BUSINESS OVERVIEW
- TABLE 138 RAPID LABS LTD.: BUSINESS OVERVIEW
- TABLE 139 AGENA BIOSCIENCE, INC.: COMPANY OVERVIEW
- TABLE 140 BIOREX DIAGNOSTICS: COMPANY OVERVIEW
- TABLE 141 HUMAN GESELLSCHAFT FÜR BIOCHEMICA UND DIAGNOSTICA MBH: COMPANY OVERVIEW
- TABLE 142 PRESTIGE DIAGNOSTICS: COMPANY OVERVIEW
- TABLE 143 DIALAB GMBH: COMPANY OVERVIEW
- TABLE 144 LORNE LABORATORIES LIMITED: COMPANY OVERVIEW
- TABLE 145 ATLAS MEDICAL GMBH: COMPANY OVERVIEW
- TABLE 146 TORAX BIOSCIENCES LIMITED: COMPANY OVERVIEW
- TABLE 147 FORTRESS DIAGNOSTICS: COMPANY OVERVIEW
- TABLE 148 AXO SCIENCE: COMPANY OVERVIEW
- TABLE 149 MAXWIN HEALTH CARE PVT. LTD.: COMPANY OVERVIEW
- TABLE 150 ANAMOL LABORATORIES PVT. LTD.: COMPANY OVERVIEW
- TABLE 151 J. MITRA & CO. PVT. LTD.: COMPANY OVERVIEW
- TABLE 152 MEDSOURCE OZONE BIOMEDICALS PVT. LTD.: COMPANY OVERVIEW
- FIGURE 1 BLOOD GROUP TYPING MARKET: RESEARCH DESIGN METHODOLOGY
- FIGURE 2 BREAKDOWN OF PRIMARY INTERVIEWS: SUPPLY-SIDE AND DEMAND-SIDE PARTICIPANTS
- FIGURE 3 BREAKDOWN OF PRIMARY INTERVIEWS: BY COMPANY TYPE, DESIGNATION, AND REGION
- FIGURE 4 BOTTOM-UP APPROACH: COMPANY REVENUE ESTIMATION APPROACH
- FIGURE 5 CAGR PROJECTIONS: SUPPLY-SIDE ANALYSIS
- FIGURE 6 BLOOD GROUP TYPING MARKET: TOP-DOWN APPROACH
- FIGURE 7 DATA TRIANGULATION METHODOLOGY
- FIGURE 8 BLOOD GROUP TYPING MARKET, BY PRODUCT & SERVICE, 2023 VS. 2028 (USD MILLION)
- FIGURE 9 BLOOD GROUP TYPING MARKET, BY TEST TYPE, 2023 VS. 2028 (USD MILLION)
- FIGURE 10 BLOOD GROUP TYPING MARKET, BY TECHNIQUE, 2023 VS. 2028 (USD MILLION)
- FIGURE 11 BLOOD GROUP TYPING MARKET, BY END USER, 2023 VS. 2028 (USD MILLION)
- FIGURE 12 BLOOD GROUP TYPING MARKET, BY REGION, 2023 VS. 2028 (USD MILLION)
- FIGURE 13 INCREASING PREVALENCE OF CHRONIC CONDITIONS TO SUPPORT MARKET GROWTH DURING FORECAST PERIOD
- FIGURE 14 CONSUMABLES SEGMENT TO CONTINUE TO DOMINATE MARKET IN 2028
- FIGURE 15 ABO BLOOD TESTS & RH TYPING SEGMENT TO DOMINATE MARKET IN 2028
- FIGURE 16 ASSAY-BASED TECHNIQUES SEGMENT TO ACCOUNT FOR LARGEST SHARE OF MARKET DURING FORECAST PERIOD
- FIGURE 17 HOSPITALS SEGMENT TO CONTINUE TO DOMINATE MARKET IN 2028
- FIGURE 18 ASIA PACIFIC TO REGISTER HIGHEST GROWTH RATE IN BLOOD GROUP TYPING MARKET DURING FORECAST PERIOD
- FIGURE 19 BLOOD GROUP TYPING MARKET: DRIVERS, RESTRAINTS, AND OPPORTUNITIES
- FIGURE 20 NUMBER OF PEOPLE WITH CHRONIC CONDITIONS IN US, 2015–2030 (MILLION INDIVIDUALS)
- FIGURE 21 PATENT ANALYSIS FOR BLOOD GROUP TYPING REAGENTS (JANUARY 2013–DECEMBER 2022)
- FIGURE 22 VALUE CHAIN ANALYSIS OF BLOOD GROUP TYPING MARKET: MAJOR VALUE ADDED DURING MANUFACTURING AND ASSEMBLY PHASES
- FIGURE 23 BLOOD GROUP TYPING MARKET: SUPPLY CHAIN ANALYSIS
- FIGURE 24 BLOOD GROUP TYPING MARKET: ECOSYSTEM ANALYSIS
- FIGURE 25 REVENUE SHIFT IN BLOOD GROUP TYPING MARKET
- FIGURE 26 INFLUENCE OF STAKEHOLDERS ON BUYING PROCESS OF BLOOD GROUP TYPING PRODUCTS
- FIGURE 27 KEY BUYING CRITERIA FOR BLOOD GROUP TYPING PRODUCTS
- FIGURE 28 NORTH AMERICA: BLOOD GROUP TYPING MARKET SNAPSHOT
- FIGURE 29 ASIA PACIFIC: BLOOD GROUP TYPING MARKET SNAPSHOT
- FIGURE 30 REVENUE SHARE ANALYSIS OF TOP PLAYERS IN BLOOD GROUP TYPING MARKET
- FIGURE 31 BLOOD GROUP TYPING MARKET SHARE, BY KEY PLAYER (2022)
- FIGURE 32 BLOOD GROUP TYPING MARKET: COMPANY EVALUATION QUADRANT, 2022
- FIGURE 33 BLOOD GROUP TYPING MARKET: COMPANY EVALUATION QUADRANT FOR START-UPS/SMES, 2022
- FIGURE 34 PRODUCT AND GEOGRAPHIC FOOTPRINT ANALYSIS OF TOP PLAYERS IN BLOOD GROUP TYPING MARKET
- FIGURE 35 BIO-RAD LABORATORIES, INC.: COMPANY SNAPSHOT (2022)
- FIGURE 36 QUIDELORTHO CORPORATION: COMPANY SNAPSHOT (2022)
- FIGURE 37 GRIFOLS, S.A.: COMPANY SNAPSHOT (2022)
- FIGURE 38 THERMO FISHER SCIENTIFIC INC.: COMPANY SNAPSHOT (2022)
- FIGURE 39 QUOTIENT LIMITED: COMPANY SNAPSHOT (2021)
- FIGURE 40 DANAHER: COMPANY SNAPSHOT (2022)
- FIGURE 41 MERCK KGAA: COMPANY SNAPSHOT (2022)
- FIGURE 42 NOVACYT: COMPANY SNAPSHOT (2022)
The objective of the study is to analyze the key market dynamics, such as drivers, opportunities, restraints, and key player strategies. To track company developments such as acquisitions, product launches, expansions, agreements, and partnerships of the leading players, the competitive landscape of the blood group typing market to analyze market players on various parameters within the broad categories of business and product strategy. Top-down and bottom-up approaches were used to estimate the market size. To estimate the market size of segments and subsegments, the market breakdown and data triangulation were used.
The four steps involved in estimating the market size are
Secondary Research
In the secondary research process, various secondary sources such as annual reports, press releases & investor presentations of companies, white papers, certified publications, articles by recognized authors, gold-standard & silver-standard websites, regulatory bodies, and databases (such as D&B Hoovers, Bloomberg Business, and Factiva) were referred to identify and collect information for this study.
Primary Research
In the primary research process, various sources from both the supply and demand sides were interviewed to obtain qualitative and quantitative information for this report. Primary sources were mainly industry experts from the core and related industries and preferred suppliers, manufacturers, distributors, service providers, technology developers, researchers, and organizations related to all segments of this industry’s value chain. In-depth interviews were conducted with various primary respondents, including key industry participants, subject-matter experts, C-level executives of key market players, and industry consultants, to obtain and verify critical qualitative and quantitative information as well as assess prospects.
The following is a breakdown of the primary respondents:
BREAKDOWN OF PRIMARY PARTICIPANTS:
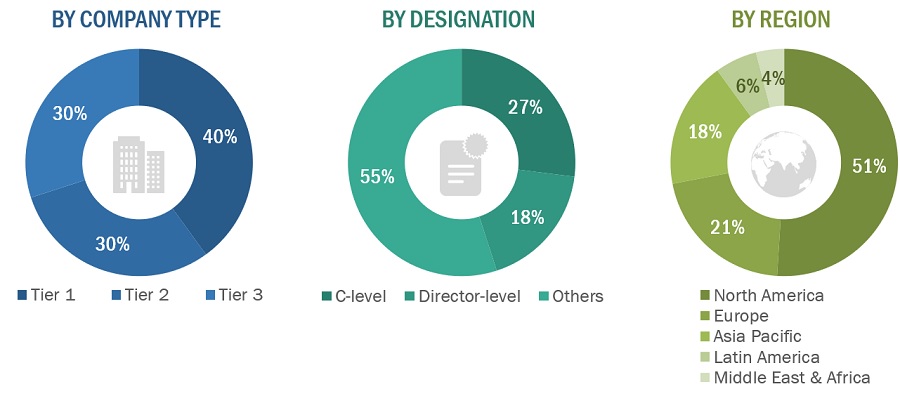
Note 1: Others include sales managers, marketing managers, and product managers.
Note 2: Companies are classified into tiers based on their total revenues. As of 2022, Tier 1 = >USD 100 million, Tier 2 = USD 10 million to USD 100 million, and Tier 3 = <USD 10 million.
To know about the assumptions considered for the study, download the pdf brochure
|
COMPANY NAME |
DESIGNATION |
|
Bio-rad Laboratories, Inc. |
Senior Product Manager |
|
Lorne Laboratories Limited |
Quality Control Manager |
|
Danaher |
Marketing Manager |
Market Size Estimation
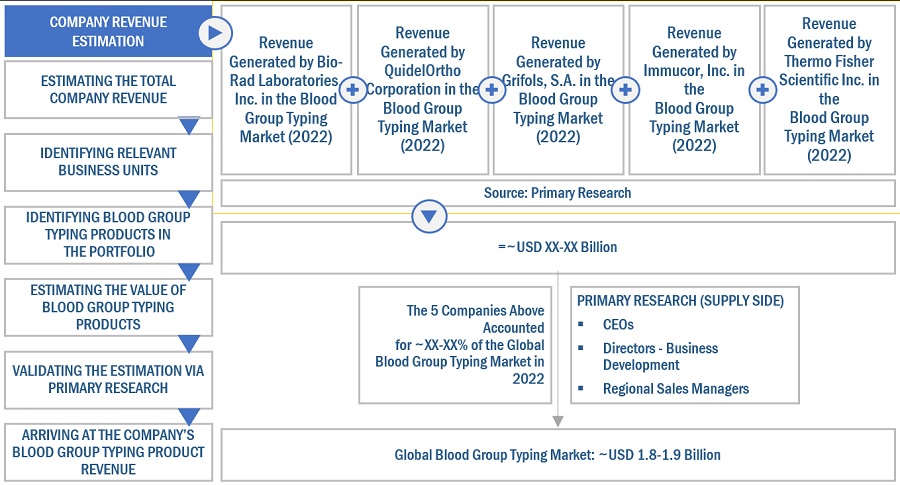
Both top-down and bottom-up approaches were used to estimate and validate the blood group typing market's total size. These methods were also used extensively to estimate the size of various subsegments in the market. The research methodology used to estimate the market size includes the following:
- The key players in the industry have been identified through extensive secondary research
- The revenues generated by leading players operating in the blood group typing market have been determined through primary and secondary research.
- All percentage shares, splits, and breakdowns have been determined using secondary sources and verified through primary sources.
Global Blood Group Typing Market Size: Bottom Up Approach
To know about the assumptions considered for the study, Request for Free Sample Report
Global Blood Group Typing Market Size: Top-Down Approach

Data Triangulation
After arriving at the overall market size by applying the process mentioned above, the total market was split into several segments and subsegments. To complete the overall market engineering process and arrive at the exact statistics for all segments and subsegments, data triangulation and market breakdown procedures were employed, wherever applicable. The data was triangulated by studying various factors and trends from both the demand and supply sides.
Market Definition
Blood group typing is a classification system that depends on the presence of A or B antigens in red blood cells. The blood group is specifically determined by the type of antigens inherited from parents. These antigens are inherited traits that determine a person's blood group, which can be categorized into different blood types, such as A, B, AB, or O, along with the Rh factor (positive or negative). This information is vital for safe medical procedures involving blood or blood products and helps healthcare professionals ensure compatibility and minimize the risk of adverse reactions.
Key Stakeholders
- Senior Management
- End User
- Finance/Procurement Department
- R&D Department
Report Objectives
- To define, describe, segment, and forecast the global blood group typing market by product & service, test type, technique, end user, and region
- To provide detailed information regarding the major factors influencing the market growth (such as drivers, restraints, and opportunities)
- To analyze the micromarkets1 with respect to individual growth trends, prospects, and contributions to the overall blood group typing market
- To analyze market opportunities for stakeholders and provide details of the competitive landscape for key players
- To forecast the size of the market segments with respect to five regions: North America, Europe, the Asia Pacific, Latin America, and the Middle East & Africa
- To profile the key players and comprehensively analyze their product portfolios, market positions, and core competencies
- To track and analyze company developments such as product launches & approvals, partnerships, acquisitions, agreements, and other developments
- To benchmark players within the market using the proprietary Company Evaluation Matrix framework, which analyzes market players on various parameters within the broad categories of business and product excellence
Available Customizations
MarketsandMarkets offers the following customizations for this market report.
Country Information
- Additional country-level analysis of the blood group typing market
Company profiles
- Additional five company profiles of players operating in the blood group typing market.
Product Analysis
- Product matrix, which provides a detailed comparison of the product portfolio of each company in the blood group typing market


 Generating Response ...


Growth opportunities and latent adjacency in Blood Group Typing Market