Wire and Cable Management Market by Cable Type (Power Cables, Communication Wires & Cables), Material (Metallic, Non-metallic), Installation (Overhead, Underground, Submarine), End User (Industrial End User, Commercial End User, Residential End User), Product, and Region - Global Forecast to 2030

icon1
USD 39.55 BN
MARKET SIZE, 2030
icon2
CAGR 8.4%
(2025-2030)
icon3
330
REPORT PAGES
icon4
410
MARKET TABLES

OVERVIEW

Source: Secondary Research, Interviews with Experts, MarketsandMarkets Analysis

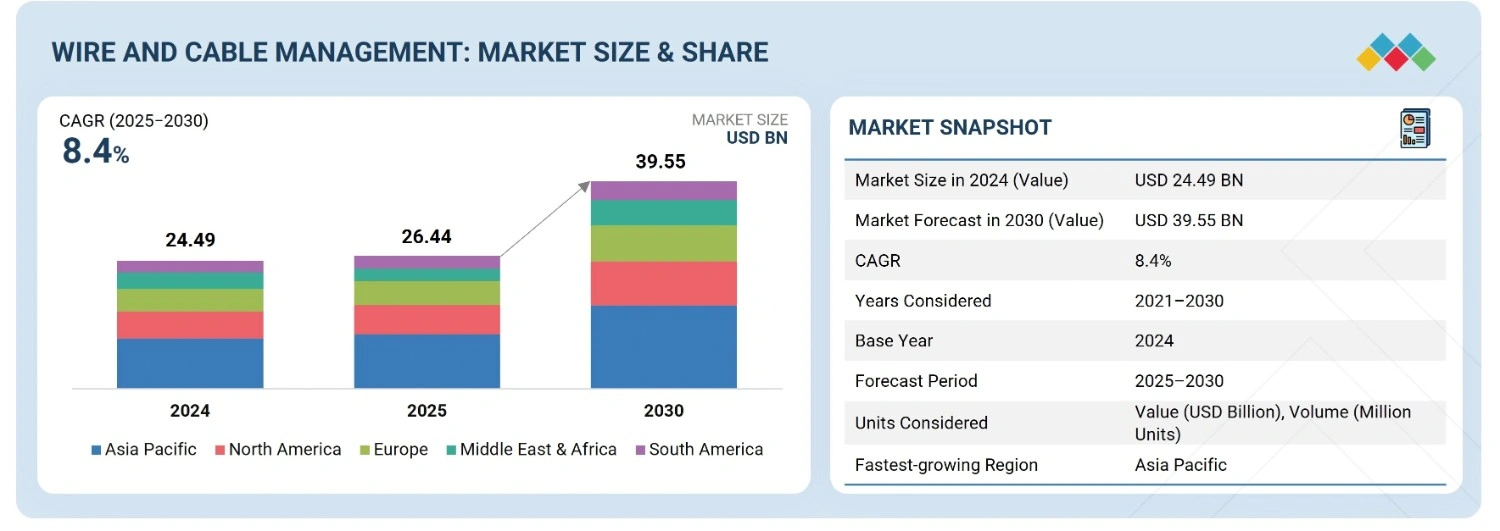
The wire and cable management market is expected to reach USD 39.55 billion by 2030, up from USD 26.44 billion in 2025, with a CAGR of 8.4% from 2025 to 2030. The market is growing rapidly, mainly due to large infrastructure investments, the growth of smart buildings, and the rising use of digital technologies across various sectors. Upgrading electrical networks and adopting renewable energy systems are making the market more complex and driving innovation in cable management solutions, from sustainable materials to advanced systems designed for safety and environmental friendliness. New safety and environmental regulations are encouraging companies to collaborate across the supply chain to offer integrated, cost-effective, and reliable solutions. The outlook for the industry remains positive, with ongoing adaptation and strategic partnerships seen as essential to reaching its full potential.

KEY TAKEAWAYS

  • BY END USER
    The end-user segments include industrial, commercial, and residential. The industrial segment is driven by automation, infrastructure development, and the need for reliable power and data transmission.
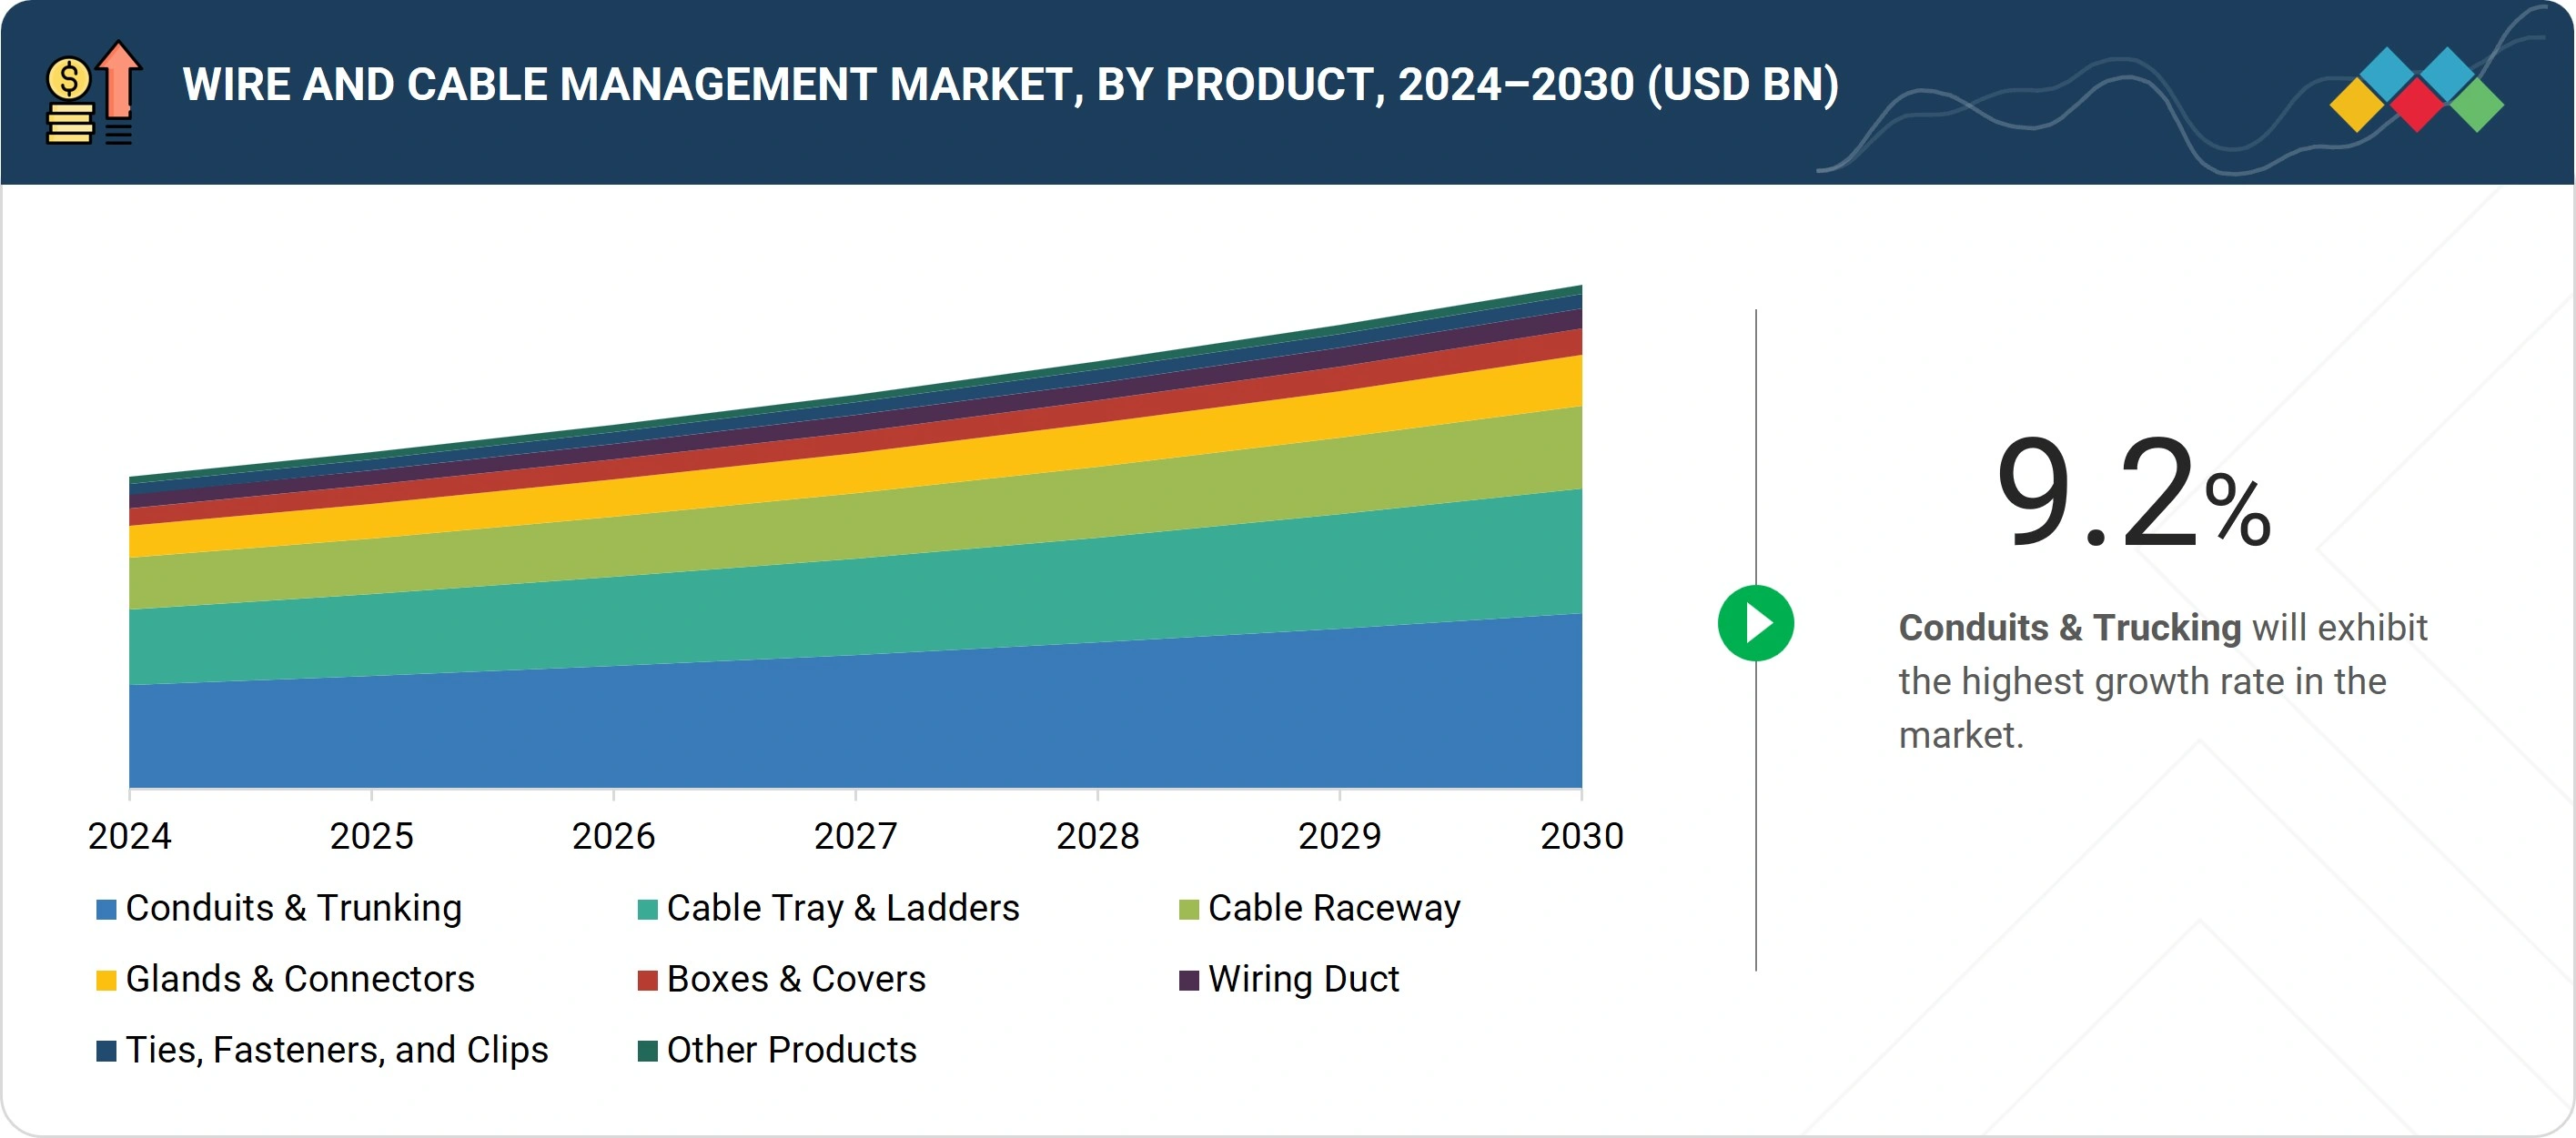
  • BY PRODUCT
    The product segment includes conduits & trunking, cable trays & ladders, cable raceways, glands & connectors, boxes & covers, wiring ducts, ties, fasteners & clips, and other products. The conduits & trunking segment is driven by increasing construction activities, modernization of existing wiring infrastructure, and stricter regulatory mandates ensuring cable safety and maintainability.
  • BY CABLE TYPE
    The cable type segment consists of power cables and communication wires and cables. The rising adoption of power cables in renewable energy projects, grid modernization, and infrastructure development is accelerating the demand for advanced cable management solutions in this segment.
  • BY MATERIAL
    The material segment includes metallic and non-metallic materials. Metallic materials are widely used owing to their high strength and durability.
  • BY INSTALLATION
    By installation, the market includes overhead, underground, and submarine. Overhead installation dominates due to its cost-effectiveness and ease of installation, driving its widespread use in power distribution networks.
  • BY REGION
    The regions considered are North America, Europe, the Asia Pacific, South America, and the Middle East & Africa. The Asia Pacific leads due to rapid urbanization, large-scale grid expansion, and aggressive electrification efforts.
  • COMPETITIVE LANDSCAPE
    Major market players use organic and inorganic strategies, such as partnerships and investments, to drive growth in wire and cable management applications. Companies such as Eaton, Atkore, and nVent have entered various collaborations, partnerships, and acquisitions and enhanced product innovation to meet the increasing demand for wire and cable management in innovative uses.

Growth in the wire and cable management market is propelled by the drive for more secure, organized, and efficient electrical networks, spurred by industrial and government efforts to modernize infrastructure and improve energy reliability. Increasing digitalization, stricter safety regulations, and the expansion of renewable energy systems require advanced cable routing and protection solutions. Demand is further fueled by the construction boom, urbanization, and the need for safe, scalable systems in manufacturing and commercial environments. Industry players prioritize integrated, adaptable cable management products to help clients meet evolving standards for safety, performance, and long-term sustainability.

TRENDS & DISRUPTIONS IMPACTING CUSTOMERS' CUSTOMERS

The wire and cable management market is projected to grow at a CAGR of 8.4% during the forecast period by value. Rising sustainability goals and increasing demand for operational efficiency are driving market expansion. Global infrastructural developments promoting the adoption of wire and cable management are expected to offer significant growth opportunities for market players.

Source: Secondary Research, Interviews with Experts, MarketsandMarkets Analysis

MARKET DYNAMICS

Drivers
Impact
Level
  • Surging investments in clean energy
  • Emphasis on infrastructure modernization
RESTRAINTS
Impact
Level
  • Susceptibility of raw materials to fluctuations
  • Extensive documentation, training, and quality control measures
OPPORTUNITIES
Impact
Level
  • Substantial investments in submarine cable infrastructure
  • Growing emphasis on clean cable and cybersecurity initiatives
CHALLENGES
Impact
Level
  • Issues related to counterfeit products and quality assurance

Source: Secondary Research, Interviews with Experts, MarketsandMarkets Analysis

Driver: Emphasis on infrastructure modernization

Rising investments in power grids boost wire and cable management demand. Government programs like India's RDSS and GEC fund infrastructure upgrades, expanding networks with high- and low–voltage feeders, substations, and cable handling—necessitating complex cable management tools for efficiency and reliability. Growing underground cables and electrification further increase the need for safe, well-designed cable solutions for system maintenance. Internationally, the IEA emphasizes ongoing investments in transmission and distribution to meet rising electricity needs and integrate renewables. Upgrading grids with modern, resilient technology requires extensive wiring and cable management, supporting digital control and monitoring systems. This global trend aims to reduce losses, enhance grid reliability, and improve cable management efficiency.

Restraint: Susceptibility of raw materials to fluctuations

The main challenge in the wire and cable management market is raw material price volatility, especially for commodities like copper, aluminium, and polymers. This volatility exposes the industry to geopolitical risks, supply chain issues, and fluctuating demand, increasing costs and squeezing profit margins. The inability to pass higher costs to customers, particularly in competitive or fixed government contracts, hampers profitability and complicates long-term planning and investment. Price fluctuations also disrupt supply, cause delays, and raise operational costs, making manufacturers less reliable. Companies try to mitigate these risks through supplier diversification, alternative materials, and cost management, but price volatility remains a key obstacle to growth and profit.

Opportunity: Growing emphasis on clean cable and cybersecurity initiatives

The popularity of clean cable initiatives and strict cybersecurity programs offers significant growth opportunities in the cable management industry. Governments and organizations prioritize securing critical infrastructure, like submarine cables, essential for connectivity and financial stability. Regulatory policies limiting untrusted vendors push manufacturers to adopt more sophisticated management systems, creating demand for secure, tamper-proof cables and advanced systems that meet compliance standards and enhance infrastructure resilience. The market expands further with cybersecurity initiatives integrating intelligent technologies, such as real-time monitoring and intrusion detection, to counter physical and cyber threats proactively. These smart systems require high-level management solutions for sensor protection and network reliability. As digital infrastructure investment grows in developing cyber-resilient solutions, the wiring and cable management market is set to benefit from rising demand for secure, durable, and tech-enabled cable systems..

Challenge: Issues related to counterfeit products and quality assurance

Issues affecting the wire cable management market include counterfeits and quality assurance. Fake cables are often poor quality, unsafe, and non-compliant, risking safety, performance, and system failures. They erode customer trust and lower market prices at the expense of reliability. High standards require investment in testing, certification, and traceability. Counterfeits complicate supply chains, increasing costs and delaying market entry. Quality assurance relies on skilled labor and advanced tech, but gaps in expertise, especially in automation and sustainable engineering, create hurdles. Lack of trained manpower and environmental regulations further raise compliance costs. Ensuring product authenticity and quality remains a key challenge, impacting profits and growth.

Wire and Cable Management Market: COMMERCIAL USE CASES ACROSS INDUSTRIES

COMPANY USE CASE DESCRIPTION BENEFITS
Simplified cable management for 500 temperature controllers using Panduit’s Cable Entry System for efficient, organized cable transition and environmental protection Saved enclosure space and installation time, maintained IP66/NEMA 4X protection
Improved cable management by deploying Ratchet P-Clamps for fast, reliable, and tool-free installation of secure cable runs across varying environments Reduced labor time by 75%, enhanced cable reliability and consistency, supported compliance and efficient project execution
Affordable Wire Management (AWM) optimized cable routing and reduced costs through proprietary ampacity optimization, allowing smaller cables to be strategically placed to improve design, reduce materials, and drive cost savings in the Hickory Solar Park Lower project design costs, improved cable placement accuracy, and overall cost savings

Logos and trademarks shown above are the property of their respective owners. Their use here is for informational and illustrative purposes only.

MARKET ECOSYSTEM

The market map provides a quick snapshot of the key stakeholders involved in the wire and cable management market, from wire and cable management manufacturers, component providers, distributors, and end users. This list is not exhaustive and is meant to give an idea of the key market players.

Logos and trademarks shown above are the property of their respective owners. Their use here is for informational and illustrative purposes only.

MARKET SEGMENTS

Source: Secondary Research, Interviews with Experts, MarketsandMarkets Analysis

Wire and Cable Management Market, By End User

The highest CAGR of the wire and cable management market is likely to be experienced by the industrial segment of the market, owing to the soaring industrialization and automation witnessed in the manufacturing, energy, and infrastructure sectors. Advanced cable management systems, which allow efficient and reliable distribution of power and data connections, are of growing demand due to increasing growth in smart factories, electrification projects, and expanding implementation of the Industry 4.0 technologies. Also, the increasing trend in using renewable power sources, along with the growing industrial power infrastructures, calls upon advanced cable systems to produce power safely, scale to fit industrial demands, and simultaneously provide efficient operations. All these contribute to improving market growth in this segment.

Wire and Cable Management Market, By Cable Type

The communication wires & cables segment is set to expand as the demand for civilized, secure, and efficient cable management systems increases in residential, commercial, and industrial markets. The surge is driven by the rapid proliferation of digital infrastructure, including 5G networks, smart cities, and data centers, which require advanced communication cables to support high-bandwidth applications. These systems protect cables from physical damage, environmental conditions, and fire hazards, ensuring compliance with stringent safety and performance standards. The increasing adoption of IoT devices and the expansion of telecommunications networks further underscore the need for structured cable management, fostering innovation in durable, high-performance products that enhance connectivity and longevity.

Wire and Cable Management Market, By Material

The quickest expanding section of material within wire and cable management is non-metallic. The non-metallic segment in cable management is rapidly growing due to its affordability, resistance to corrosion, and suitability for telecom, underground, and eco-friendly applications, making it a strong substitute for metal alternatives. With a rising focus on sustainability, there is an increasing demand for recyclable materials such as PVC and HDPE. These materials help lower installation and production expenses, making them attractive for large-scale and urban projects. Their resistance to rust and chemicals ensures reliability in demanding environments like coastal or underground areas. This segment is anticipated to maintain steady growth, supported by a global movement toward sustainable, economical solutions and ongoing advances in hybrid materials and safety features, which mitigate previous drawbacks and reinforce its importance in telecom and green infrastructure initiatives.

Wire and Cable Management Market, By Product

The faster-growing product segment is conduits & trunking. Conduits and trunking are vital solutions for protecting, organizing, and managing electrical cabling in residential, commercial, and industrial settings. They come in both rigid and flexible versions, made from metal, PVC, fiber, and clay, delivering strong defense against physical damage, moisture, and chemicals. Trunking typically features modular enclosures with removable covers, simplifying installation, allowing for easy cable separation, and enabling future adjustments. With its lightweight nature, plastic trunking suits indoor environments such as offices and residences, while steel variants offer greater durability in industrial use. These products help ensure workplace safety by managing cables across different installations and play an important role in meeting ever-stricter electrical safety regulations. Rising construction activity and the need to upgrade existing wiring systems and regulatory requirements are key factors driving growth in this segment.

Wire and Cable Management Market, By Installation

The submarine segment is the fastest-growing installation category in the Wire and Cable Management market. The submarine installation category is experiencing the fastest growth in the wire and cable management market due to the surging need for robust global telecommunications networks and the rapid expansion of offshore renewable energy infrastructure. Submarine cables are essential for transmitting vast amounts of internet traffic across continents and play a key role in connecting renewable offshore energy projects, such as wind farms, to onshore grids. High-profile investments, like large contracts for Dutch offshore wind initiatives and the completion of major cross-sea cable systems, are accelerating demand for advanced submarine cable solutions. Furthermore, the proliferation of 5G, cloud services, and increased data transfer requirements has intensified the demand for high-capacity, low-latency cabling under the sea. Ongoing technological innovations in optical repeaters and HVDC cables enable longer distances and greater data efficiency, further propelling this segment’s growth. Additionally, the challenging nature of subsea environments drives continuous investment in research and development, ensuring that submarine cable management remains the industry’s fastest-developing installation area.

REGION

Asia Pacific to be the fastest-growing region in the global Wire and Cable Management market during the forecast period

The Asia Pacific region is currently the fastest-growing in the wire and cable management market, driven by large infrastructure investments, rapid digitalization, and strong industrial growth in countries like China, India, and Japan. China leads with major projects in telecommunications, green energy, electric vehicles, and eco-friendly urban development, all supported by significant government incentives and a push for Industry 4.0 adoption. This creates steady demand for innovative, sustainable cable management solutions. Meanwhile, India's market is growing quickly due to increased investment in power and transit infrastructure, digital rollouts, and major government initiatives such as the Smart Cities Mission and Power for All. Faster internet deployment, expanded electrification into rural areas, and substantial real estate development make the Asia Pacific the most dynamic and rapidly expanding region for advanced wire and cable management solutions today.

Wire and Cable Management Market: COMPANY EVALUATION MATRIX

Eaton (Star) leads with a strong market presence and a wide product portfolio, driving large-scale adoption across end users. HellermanTyton (Emerging Leader) is gaining traction with a higher product coverage among multiple end users. While Eaton dominates with scale, HellermanTyton shows strong growth potential to advance toward the leaders' quadrant.

Source: Secondary Research, Interviews with Experts, MarketsandMarkets Analysis

KEY MARKET PLAYERS

MARKET SCOPE

REPORT METRIC DETAILS
Market Size in 2024 (Value) USD 24.49 Billion
Market Forecast in 2030 (Value) USD 39.55 Billion
Growth Rate CAGR 8.4% from 2025-2030
Years Considered 2021-2030
Base Year 2024
Forecast Period 2030
Units Considered Value (USD Million), Volume (Million Units)
Report Coverage Revenue forecast, company ranking, competitive landscape, growth factors, and trends
Segments Covered By Product: Conduits & Trunking, Cable Trays & Ladders, Cable Raceways, Glands & Connectors, Boxes & Covers, Wiring Ducts, Ties, Fasteners, & Clips, Other Products By Cable Type: Power Cables, Communication Wires & Cables By Material: Metallic, Non-Metallic By Installation: Overhead, Underground, Submarine By End User: Residential, Commercial, Industrial
Regions Covered North America, Europe, Asia Pacific, South America, and the Middle East & Africa

WHAT IS IN IT FOR YOU: Wire and Cable Management Market REPORT CONTENT GUIDE

DELIVERED CUSTOMIZATIONS

We have successfully delivered the following deep-dive customizations:

CLIENT REQUEST CUSTOMIZATION DELIVERED VALUE ADDS
End User & Application Segmentation Comprehensive list of customers with segmentation by end user & cable type Benchmarking of adoption rates across utilities, industrial, and commercial. Analysis of barriers for customers Insights on revenue shifts towards emerging end users Pinpoint cross-industry substitution risks and opportunities Enable targeting of high-margin products

RECENT DEVELOPMENTS

  • March 2025 : ABB (Switzerland) completed the acquisition of Siemens’ Wiring Accessories business in China, enhancing its smart building portfolio and expanding market reach. Generating over USD 150 million in 2024 revenue, the business brings a broad product range—including wiring accessories, smart home systems, and door locks—plus distribution across 230 cities and 350 skilled employees.
  • December 2024 : ABB (Switzerland) acquired Solutions Industry & Building (SIB) in 2024, expanding its premium cable protection and electrification solutions portfolio. This acquisition strengthens ABB's presence in specialized markets like rail, industrial, and hazardous environments with advanced cable gland and protection products.
  • November 2024 : Legrand (France) UK & Ireland expanded its Cablofil range with the launch of Cablobend, a flexible and configurable solution that improves the steel wire cable tray installation process.
  • August 2023 : Eaton (Ireland) expanded their B-line series KwikSplice cable channel to include solid bottom, slotted tray, and pass-through tray.
  • April 2023 : TE Connectivity (Ireland) launched an EVSW, a flame-retardant tubing that enables fast identification. It is designed to work with the cable and component sizes used in electric vehicles' power trains. It is made from a modified Polyolefin material, which means it is semi-flexible and easy to install using already available tooling.


Table of Contents

Exclusive indicates content/data unique to MarketsandMarkets and not available with any competitors.

TITLE
PAGE NO
1
INTRODUCTION


32
2
RESEARCH METHODOLOGY


39
3
EXECUTIVE SUMMARY


52
4
PREMIUM INSIGHTS


57
5
MARKET OVERVIEW
Clean energy investments and tech innovations drive growth in wire and cable management markets.


62
 
5.1
INTRODUCTION


5.2
MARKET DYNAMICS


5.2.1
DRIVERS


5.2.1.1
Surging investments in clean energy


5.2.1.2
Emphasis on infrastructure modernization


5.2.1.3
Housing construction and renovations


5.2.2
RESTRAINTS


5.2.2.1
Susceptibility of raw materials to fluctuations


5.2.2.2
Extensive documentation, training, and quality control measures


5.2.3
OPPORTUNITIES


5.2.3.1
Substantial investments in submarine cable infrastructure


5.2.3.2
Growing emphasis on clean cable and cybersecurity initiatives


5.2.4
CHALLENGES


5.2.4.1
Issues related to counterfeit products and quality assurance
 
 
5.3
TRENDS/DISRUPTIONS IMPACTING CUSTOMER BUSINESS


5.4
PRICING ANALYSIS


5.4.1
AVERAGE SELLING PRICE TREND OF WIRE AND CABLE MANAGEMENT, BY PRODUCT, 2021–2024


5.4.2
AVERAGE SELLING PRICE TREND OF WIRE AND CABLE MANAGEMENT, BY REGION, 2021–2024


5.5
VALUE CHAIN ANALYSIS


5.6
ECOSYSTEM ANALYSIS


5.7
TECHNOLOGY ANALYSIS


5.7.1
KEY TECHNOLOGIES


5.7.1.1
Polyphenylene ether in cable accessories


5.7.1.2
Self-adhesive and flexible mounting clips


5.7.2
COMPLIMENTARY TECHNOLOGIES


5.7.2.1
Slip-on and cold-shrink


5.7.2.2
AI-driven cable management


5.7.3
ADJACENT TECHNOLOGIES


5.7.3.1
Hollow-core fiber optic cable


5.7.3.2
Science monitoring and reliable telecommunications (SMART) cables
 
 
5.8
PATENT ANALYSIS


5.9
TRADE ANALYSIS


5.9.1
IMPORT DATA (HS CODE 8547)


5.9.2
EXPORT DATA (HS CODE 8547)


5.10
TARIFF AND REGULATORY LANDSCAPE


5.10.1
TARIFF ANALYSIS


5.10.2
REGULATORY BODIES, GOVERNMENT AGENCIES, AND OTHER ORGANIZATIONS


5.11
KEY CONFERENCES AND EVENTS, 2025–2026


5.12
PORTER'S FIVE FORCES ANALYSIS


5.12.1
THREAT OF NEW ENTRANTS


5.12.2
BARGAINING POWER OF BUYERS


5.12.3
BARGAINING POWER OF SUPPLIERS


5.12.4
THREAT OF SUBSTITUTES


5.12.5
INTENSITY OF COMPETITIVE RIVALRY


5.13
KEY STAKEHOLDERS AND BUYING CRITERIA


5.13.1
KEY STAKEHOLDERS IN BUYING PROCESS


5.13.2
BUYING CRITERIA


5.14
INVESTMENT AND FUNDING SCENARIO


5.15
CASE STUDY ANALYSIS


5.15.1
AFFORDABLE WIRE MANAGEMENT OPTIMIZES CABLE ROUTING AND REDUCES COSTS FOR MIDWEST SOLAR FARMS


5.15.2
ONESTOP CONTROLS AND PANDUIT SIMPLIFY CABLE MANAGEMENT AND ENHANCE ENCLOSURE PROTECTION FOR TEMPERATURE CONTROLLERS


5.15.3
EGAN COMPANY AND HELLERMANNTYTON CUT LABOR COSTS AND IMPROVE CABLE MANAGEMENT WITH RATCHET P-CLAMPS


5.16
IMPACT OF GEN AI/AI ON WIRE AND CABLE MANAGEMENT MARKET


5.16.1
ADOPTION OF GEN AI/AI IN WIRE AND CABLE MANAGEMENT MARKET


5.16.2
IMPACT OF GEN AI/AI ON WIRE AND CABLE MANAGEMENT MARKET, BY REGION


5.17
MACROECONOMIC OUTLOOK FOR WIRE AND CABLE MANAGEMENT MARKET


5.18
IMPACT OF 2025 US TARIFF – OVERVIEW


5.18.1
INTRODUCTION


5.18.2
KEY TARIFF RATES


5.18.3
PRICE IMPACT ANALYSIS


5.18.4
IMPACT ON COUNTRIES/REGIONS


5.18.4.1
North America


5.18.4.2
Europe


5.18.4.3
Asia Pacific


5.18.4.4
South America


5.18.4.5
Middle East & Africa


5.18.5
IMPACT ON END USERS
 
 
6
WIRE AND CABLE MANAGEMENT MARKET, BY PRODUCT
Market Size & Growth Rate Forecast Analysis to 2030 in USD Million and Units | 36 Data Tables


100
 
6.1
INTRODUCTION


6.2
CONDUITS & TRUNKING


6.2.1
EMPHASIS ON MODERNIZING EXISTING WIRING INFRASTRUCTURE TO DRIVE MARKET


6.3
CABLE TRAYS & LADDERS


6.3.1
NEED TO COMPLY WITH SAFETY STANDARDS TO BOOST DEMAND


6.4
CABLE RACEWAYS


6.4.1
EASE OF INSTALLATION TO SUPPORT MARKET GROWTH


6.5
GLANDS & CONNECTORS


6.5.1
GROWING TECHNICAL COMPLEXITIES OF ELECTRONIC SYSTEMS TO DRIVE MARKET


6.6
BOXES & COVERS


6.6.1
REGULATORY EMPHASIS ON ACCIDENT PREVENTION AND WORKSPACE TIDINESS TO DRIVE MARKET


6.7
WIRING DUCTS


6.7.1
ORGANIZED CABLE ROUTING TO SUPPORT COMPLEX CONTROL SYSTEMS AND PANELS TO PROPEL MARKET GROWTH


6.8
TIES, FASTENERS, & CLIPS


6.8.1
EXPANDING TELECOMMUNICATION NETWORKS AND DIGITALIZATION ACROSS INDUSTRIES TO FUEL SEGMENTAL GROWTH


6.9
OTHER PRODUCTS


7
WIRE AND CABLE MANAGEMENT MARKET, BY CABLE TYPE
Market Size & Growth Rate Forecast Analysis to 2030 in USD Million | 6 Data Tables


117
 
7.1
INTRODUCTION


7.2
POWER CABLES


7.2.1
RAPID URBANIZATION AND INFRASTRUCTURE MODERNIZATION TO DRIVE MARKET


7.3
COMMUNICATION WIRES & CABLES


7.3.1
EVOLVING DIGITAL ECOSYSTEM TO OFFER LUCRATIVE GROWTH OPPORTUNITIES
 
 
8
WIRE AND CABLE MANAGEMENT MARKET, BY MATERIAL
Market Size & Growth Rate Forecast Analysis to 2030 in USD Million | 6 Data Tables


121
 
8.1
INTRODUCTION


8.2
METALLIC


8.2.1
ONGOING ADVANCEMENTS IN ALLOY TECHNOLOGY TO OFFER LUCRATIVE GROWTH OPPORTUNITIES


8.3
NON-METALLIC


8.3.1
GROWING EMPHASIS ON SUSTAINABILITY AND RECYCLABLE MATERIALS TO DRIVE MARKET
 
 
9
WIRE AND CABLE MANAGEMENT MARKET, BY INSTALLATION
Market Size & Growth Rate Forecast Analysis to 2030 in USD Million | 8 Data Tables


125
 
9.1
INTRODUCTION


9.2
OVERHEAD


9.2.1
DEPLOYMENT IN REGIONS PRONE TO NATURAL DISASTERS TO FUEL SEGMENTAL GROWTH


9.3
UNDERGROUND


9.3.1
ABILITY TO WITHSTAND HARSH WEATHER CONDITIONS TO DRIVE MARKET


9.4
SUBMARINE


9.4.1
EXPANDING OFFSHORE ENERGY INFRASTRUCTURE TO FUEL MARKET GROWTH
 
 
10
WIRE AND CABLE MANAGEMENT MARKET, BY END USER
Market Size & Growth Rate Forecast Analysis to 2030 in USD Million | 32 Data Tables


131
 
10.1
INTRODUCTION


10.2
RESIDENTIAL


10.2.1
GROWING APPLICATION OF IOT DEVICES AND HOME AUTOMATION SYSTEMS TO FUEL MARKET GROWTH


10.3
COMMERCIAL


10.3.1
OFFICES


10.3.1.1
Increasing adoption of hybrid work models and smart office technologies to foster market growth


10.3.2
RETAIL STORES AND MALLS


10.3.2.1
Rising popularity of interactive kiosks and LED lighting to support market growth


10.3.3
OTHER COMMERCIAL END USERS


10.4
INDUSTRIAL


10.4.1
IT & TELECOMMUNICATIONS


10.4.1.1
Adoption of Industry 4.0 and smart manufacturing technologies to drive market


10.4.2
ENERGY & UTILITIES


10.4.2.1
Global shift toward renewable energy and grid modernization to boost demand


10.4.3
MANUFACTURING


10.4.3.1
Rise of automated production lines and robotic systems to fuel market growth


10.4.4
OIL & GAS


10.4.4.1
Global need to maintain energy production and enhance operational safety to drive market


10.4.5
METALS & MINING


10.4.5.1
Increasing demand for metals critical to renewable energy and electrification to support market growth


10.4.6
WAREHOUSING & LOGISTICS


10.4.6.1
Expanding e-commerce and automation in logistics to boost demand


10.4.7
OTHER INDUSTRIAL END USERS
 
 
11
WIRE AND CABLE MANAGEMENT MARKET, BY REGION
Market Size & Growth Rate Forecast Analysis to 2030 in USD Million and Units | 246 Data Tables


148
 
11.1
INTRODUCTION


11.2
ASIA PACIFIC


11.2.1
CHINA


11.2.1.1
Growing investments in power grids to boost demand


11.2.2
INDIA


11.2.2.1
Expanding digital economy and telecom services to fuel market growth


11.2.3
JAPAN


11.2.3.1
Increasing focus on bridging urban-rural digital gap to support market growth


11.2.4
AUSTRALIA


11.2.4.1
Rise in natural gas production to drive market


11.2.5
SOUTH KOREA


11.2.5.1
Growing shift toward Industry 4.0 and smart factories to offer lucrative growth opportunities


11.2.6
REST OF ASIA PACIFIC


11.3
NORTH AMERICA


11.3.1
US


11.3.1.1
Rising investments in energy infrastructure, renewable projects, and grid modernization to boost demand


11.3.2
CANADA


11.3.2.1
Rapid modernization of electricity grids and expansion of renewable energy capacity to drive market


11.3.3
MEXICO


11.3.3.1
Robust investments in grid modernization and renewable energy capacity to boost demand
 
 
11.4
EUROPE


11.4.1
GERMANY


11.4.1.1
Rising emphasis on Industry 4.0 to fuel market growth


11.4.2
UK


11.4.2.1
Growing investments in electricity infrastructure to drive market


11.4.3
ITALY


11.4.3.1
Expansion of grid infrastructure to fuel market growth


11.4.4
FRANCE


11.4.4.1
Government-led initiatives to boost EV charging infrastructure to support market growth


11.4.5
SPAIN


11.4.5.1
Increasing demand for structured cable trays, conduits, and junction boxes to foster market growth


11.4.6
REST OF EUROPE


11.5
MIDDLE EAST & AFRICA


11.5.1
GCC


11.5.1.1
Saudi Arabia


11.5.1.2
UAE


11.5.1.3
REST OF GCC


11.5.2
SOUTH AFRICA


11.5.2.1
Expanding power network to drive market


11.5.3
REST OF MIDDLE EAST & AFRICA


11.6
SOUTH AMERICA


11.6.1
BRAZIL


11.6.1.1
Rising focus on strengthening data centers to support market growth


11.6.2
ARGENTINA


11.6.2.1
Increasing emphasis on enhancing fiber backbone infrastructure to fuel market growth


11.6.3
COLOMBIA


11.6.3.1
Growing data center investments and enhanced fiber connectivity to support market growth


11.6.4
REST OF SOUTH AMERICA
 
 
12
COMPETITIVE LANDSCAPE
Gain insights into key players' strategies and market dominance through 2024 competitive analysis.


244
 
12.1
OVERVIEW


12.2
KEY PLAYER STRATEGIES/RIGHT TO WIN, 2021–2025


12.3
MARKET SHARE ANALYSIS, 2024


12.4
REVENUE ANALYSIS, 2020–2024


12.5
COMPANY VALUATION AND FINANCIAL METRICS


12.6
BRAND/PRODUCT COMPARISON


12.7
COMPANY EVALUATION MATRIX: KEY PLAYERS, 2024


12.7.1
STARS


12.7.2
EMERGING LEADERS


12.7.3
PERVASIVE PLAYERS


12.7.4
PARTICIPANTS


12.7.5
COMPANY FOOTPRINT: KEY PLAYERS, 2024


12.7.5.1
Company footprint


12.7.5.2
Region footprint


12.7.5.3
Product footprint


12.7.5.4
Material footprint


12.7.5.5
Cable type footprint
 
 
12.8
COMPANY EVALUATION MATRIX: STARTUPS/SMES, 2024


12.8.1
PROGRESSIVE COMPANIES


12.8.2
RESPONSIVE COMPANIES


12.8.3
DYNAMIC COMPANIES


12.8.4
STARTING BLOCKS


12.8.5
COMPETITIVE BENCHMARKING: STARTUPS/SMES, 2024


12.8.5.1
Detailed list of key startups/SMEs


12.8.5.2
Competitive benchmarking of key startups/SMEs
 
 
12.9
COMPETITIVE SCENARIO


12.9.1
PRODUCT LAUNCHES


12.9.2
DEALS


12.9.3
EXPANSIONS
 
 
13
COMPANY PROFILES
In-depth Company Profiles of Leading Market Players with detailed Business Overview, Product and Service Portfolio, Recent Developments, and Unique Analyst Perspective (MnM View)


267
 
13.1
KEY PLAYERS


13.1.1
ABB


13.1.1.1
Business overview


13.1.1.2
Products/Solutions/Services offered


13.1.1.3
Recent developments


13.1.1.4
MnM view


13.1.2
LEGRAND


13.1.3
ATKORE


13.1.4
EATON


13.1.5
NVENT


13.1.6
PANDUIT CORP.


13.1.7
BELDEN INC.


13.1.8
SCHNEIDER ELECTRIC


13.1.9
HUBBELL


13.1.10
HILTI


13.1.11
TE CONNECTIVITY


13.1.12
SALZER


13.1.13
3M


13.1.14
ILLINOIS TOOL WORKS INC.


13.1.15
NOVOFLEX


13.2
OTHER PLAYERS


13.2.1
OBO BETTERMANN HOLDING GMBH & CO.KG


13.2.2
FISCHER GROUP


13.2.3
HELLERMANNTYTON


13.2.4
NIEDAX GROUP


13.2.5
CELO


13.2.6
LAPP GROUP


13.2.7
HELUKABEL


13.2.8
MOLEX


13.2.9
ICOTEK GMBH & CO. KG


13.2.10
PACER GROUP
 
 
14
APPENDIX


321
 
14.1
INSIGHTS FROM INDUSTRY EXPERTS


14.2
DISCUSSION GUIDE


14.3
KNOWLEDGESTORE: MARKETSANDMARKETS’ SUBSCRIPTION PORTAL


14.4
AVAILABLE CUSTOMIZATIONS


14.5
RELATED REPORTS


14.6
AUTHOR DETAILS


LIST OF TABLES


TABLE 1
INCLUSIONS AND EXCLUSIONS, BY PRODUCT


TABLE 2
INCLUSIONS AND EXCLUSIONS, BY CABLE TYPE


TABLE 3
INCLUSIONS AND EXCLUSIONS, BY MATERIAL


TABLE 4
INCLUSIONS AND EXCLUSIONS, BY INSTALLATION


TABLE 5
INCLUSIONS AND EXCLUSIONS, BY END USER


TABLE 6
WIRE AND CABLE MANAGEMENT MARKET SIZE ESTIMATION METHODOLOGY (DEMAND SIDE)


TABLE 7
WIRE AND CABLE MANAGEMENT MARKET: RISK ANALYSIS


TABLE 8
WIRE AND CABLE MANAGEMENT MARKET SNAPSHOT


TABLE 9
ESTIMATED CUMULATIVE INVESTMENT NEEDS BY INFRASTRUCTURE SEGMENT


TABLE 10
US CONSTRUCTION EXPENDITURE DATA, 2024–2025


TABLE 11
AVERAGE SELLING PRICE TREND OF WIRE AND CABLE MANAGEMENT, BY PRODUCT, 2021–2024, (USD/UNIT)


TABLE 12
AVERAGE SELLING PRICE TREND OF WIRE AND CABLE MANAGEMENT, BY REGION, 2021–2024 (USD/UNIT)


TABLE 13
ROLE OF COMPANIES IN WIRE AND CABLE MANAGEMENT ECOSYSTEM


TABLE 14
LIST OF MAJOR PATENTS PERTAINING TO WIRE AND CABLE MANAGEMENT MARKET, 2020–2025


TABLE 15
IMPORT DATA FOR HS CODE 8547- (INSULATING FITTINGS FOR ELECTRICAL MACHINES), 2022–2024 (USD THOUSAND)


TABLE 16
EXPORT DATA FOR HS CODE 8547- (INSULATING FITTINGS FOR ELECTRICAL MACHINES), 2022–2024 (USD THOUSAND)


TABLE 17
IMPORT TARIFF FOR HS CODE 8547- (INSULATING FITTINGS FOR ELECTRICAL MACHINES), 2024


TABLE 18
NORTH AMERICA: LIST OF REGULATORY BODIES, GOVERNMENT AGENCIES, AND OTHER ORGANIZATIONS


TABLE 19
EUROPE: LIST OF REGULATORY BODIES, GOVERNMENT AGENCIES, AND OTHER ORGANIZATIONS


TABLE 20
ASIA PACIFIC: LIST OF REGULATORY BODIES, GOVERNMENT AGENCIES, AND OTHER ORGANIZATIONS


TABLE 21
SOUTH AMERICA: LIST OF REGULATORY BODIES, GOVERNMENT AGENCIES, AND OTHER ORGANIZATIONS


TABLE 22
MIDDLE EAST & AFRICA: LIST OF REGULATORY BODIES, GOVERNMENT AGENCIES, AND OTHER ORGANIZATIONS


TABLE 23
WIRE & CABLE MANAGEMENT MARKET: DETAILED LIST OF CONFERENCES AND EVENTS, 2025–2026


TABLE 24
WIRE AND CABLE MANAGEMENT MARKET: IMPACT OF PORTER'S FIVE FORCES


TABLE 25
INFLUENCE OF KEY STAKEHOLDERS ON BUYING PROCESS FOR TOP THREE INDUSTRIAL END USERS (%)


TABLE 26
KEY BUYING CRITERIA FOR TOP THREE INDUSTRIAL END USERS


TABLE 27
US-ADJUSTED RECIPROCAL TARIFF RATES, 2024


TABLE 28
ANTICIPATED CHANGES IN PRICES AND POTENTIAL IMPACT ON END USERS DUE TO TARIFF


TABLE 29
WIRE AND CABLE MANAGEMENT MARKET, BY CABLE TYPE, 2021–2024 (USD MILLION)


TABLE 30
WIRE AND CABLE MANAGEMENT MARKET, BY CABLE TYPE, 2025–2030 (USD MILLION)


TABLE 31
POWER CABLES: WIRE AND CABLE MANAGEMENT MARKET, BY REGION, 2021–2024 (USD MILLION)


TABLE 32
POWER CABLES: WIRE AND CABLE MANAGEMENT MARKET, BY REGION, 2025–2030 (USD MILLION)


TABLE 33
COMMUNICATION WIRES & CABLES: WIRE AND CABLE MANAGEMENT MARKET, BY REGION, 2021–2024 (USD MILLION)


TABLE 34
COMMUNICATION WIRES & CABLES: WIRE AND CABLE MANAGEMENT MARKET, BY REGION, 2025–2030 (USD MILLION)


TABLE 35
WIRE AND CABLE MANAGEMENT MARKET, BY END USER, 2021–2024 (USD MILLION)


TABLE 36
WIRE AND CABLE MANAGEMENT MARKET, BY END USER, 2025–2030 (USD MILLION)


TABLE 37
WIRE AND CABLE MANAGEMENT MARKET, BY COMMERCIAL END USER, 2021–2024 (USD MILLION)


TABLE 38
WIRE AND CABLE MANAGEMENT MARKET, BY COMMERCIAL END USER, 2025–2030 (USD MILLION)


TABLE 39
WIRE AND CABLE MANAGEMENT MARKET, BY INDUSTRIAL END USER, 2021–2024 (USD MILLION)


TABLE 40
WIRE AND CABLE MANAGEMENT MARKET, BY INDUSTRIAL END USER, 2025–2030 (USD MILLION)


TABLE 41
RESIDENTIAL: WIRE AND CABLE MANAGEMENT MARKET, BY REGION, 2021–2024 (USD MILLION)


TABLE 42
RESIDENTIAL: WIRE AND CABLE MANAGEMENT MARKET, BY REGION, 2025–2030 (USD MILLION)


TABLE 43
COMMERCIAL: WIRE AND CABLE MANAGEMENT MARKET, BY REGION, 2021–2024 (USD MILLION)


TABLE 44
COMMERCIAL: WIRE AND CABLE MANAGEMENT MARKET, BY REGION, 2025–2030 (USD MILLION)


TABLE 45
OFFICES: WIRE AND CABLE MANAGEMENT MARKET, BY REGION, 2021–2024 (USD MILLION)


TABLE 46
OFFICES: WIRE AND CABLE MANAGEMENT MARKET, BY REGION, 2025–2030 (USD MILLION)


TABLE 47
RETAIL STORES AND MALLS: WIRE AND CABLE MANAGEMENT MARKET, BY REGION, 2021–2024 (USD MILLION)


TABLE 48
RETAIL STORES AND MALLS: WIRE AND CABLE MANAGEMENT MARKET, BY REGION, 2025–2030 (USD MILLION)


TABLE 49
OTHER COMMERCIAL END USERS: WIRE AND CABLE MANAGEMENT MARKET, BY REGION, 2021–2024 (USD MILLION)


TABLE 50
OTHER COMMERCIAL END USERS: WIRE AND CABLE MANAGEMENT MARKET, BY REGION, 2025–2030 (USD MILLION)


TABLE 51
INDUSTRIAL: WIRE AND CABLE MANAGEMENT MARKET, BY REGION, 2021–2024 (USD MILLION)


TABLE 52
INDUSTRIAL: WIRE AND CABLE MANAGEMENT MARKET, BY REGION, 2025–2030 (USD MILLION)


TABLE 53
IT & TELECOMMUNICATIONS: WIRE AND CABLE MANAGEMENT MARKET, BY REGION, 2021–2024 (USD MILLION)


TABLE 54
IT & TELECOMMUNICATIONS: WIRE AND CABLE MANAGEMENT MARKET, BY REGION, 2025–2030 (USD MILLION)


TABLE 55
ENERGY & UTILITIES: WIRE AND CABLE MANAGEMENT MARKET, BY REGION, 2021–2024 (USD MILLION)


TABLE 56
ENERGY & UTILITIES: WIRE AND CABLE MANAGEMENT MARKET, BY REGION, 2025–2030 (USD MILLION)


TABLE 57
MANUFACTURING: WIRE AND CABLE MANAGEMENT MARKET, BY REGION, 2021–2024 (USD MILLION)


TABLE 58
MANUFACTURING: WIRE AND CABLE MANAGEMENT MARKET, BY REGION, 2025–2030 (USD MILLION)


TABLE 59
OIL & GAS: WIRE AND CABLE MANAGEMENT MARKET, BY REGION, 2021–2024 (USD MILLION)


TABLE 60
OIL & GAS: WIRE AND CABLE MANAGEMENT MARKET, BY REGION, 2025–2030 (USD MILLION)


TABLE 61
METALS & MINING: WIRE AND CABLE MANAGEMENT MARKET, BY REGION, 2021–2024 (USD MILLION)


TABLE 62
METALS & MINING: WIRE AND CABLE MANAGEMENT MARKET, BY REGION, 2025–2030 (USD MILLION)


TABLE 63
WAREHOUSING & LOGISTICS: WIRE AND CABLE MANAGEMENT MARKET, BY REGION, 2021–2024 (USD MILLION)


TABLE 64
WAREHOUSING & LOGISTICS: WIRE AND CABLE MANAGEMENT MARKET, BY REGION, 2025–2030 (USD MILLION)


TABLE 65
OTHER INDUSTRIAL END USERS: WIRE AND CABLE MANAGEMENT MARKET, BY REGION, 2021–2024 (USD MILLION)


TABLE 66
OTHER INDUSTRIAL END USERS: WIRE AND CABLE MANAGEMENT MARKET, BY REGION, 2025–2030 (USD MILLION)


TABLE 67
WIRE AND CABLE MANAGEMENT MARKET, BY INSTALLATION, 2021–2024 (USD MILLION)


TABLE 68
WIRE AND CABLE MANAGEMENT MARKET, BY INSTALLATION, 2025–2030 (USD MILLION)


TABLE 69
OVERHEAD: WIRE AND CABLE MANAGEMENT MARKET, BY REGION, 2021–2024 (USD MILLION)


TABLE 70
OVERHEAD: WIRE AND CABLE MANAGEMENT MARKET, BY REGION, 2025–2030 (USD MILLION)


TABLE 71
UNDERGROUND: WIRE AND CABLE MANAGEMENT MARKET, BY REGION, 2021–2024 (USD MILLION)


TABLE 72
UNDERGROUND: WIRE AND CABLE MANAGEMENT MARKET, BY REGION, 2025–2030 (USD MILLION)


TABLE 73
SUBMARINE: WIRE AND CABLE MANAGEMENT MARKET, BY REGION, 2021–2024 (USD MILLION)


TABLE 74
SUBMARINE: WIRE AND CABLE MANAGEMENT MARKET, BY REGION, 2025–2030 (USD MILLION)


TABLE 75
WIRE AND CABLE MANAGEMENT MARKET, BY MATERICAL TYPE, 2021–2024 (USD MILLION)


TABLE 76
WIRE AND CABLE MANAGEMENT MARKET, BY MATERIAL TYPE, 2025–2030 (USD MILLION)


TABLE 77
METALLIC: WIRE AND CABLE MANAGEMENT MARKET, BY REGION, 2021–2024 (USD MILLION)


TABLE 78
METALLIC: WIRE AND CABLE MANAGEMENT MARKET, BY REGION, 2025–2030 (USD MILLION)


TABLE 79
NON-METALLIC: WIRE AND CABLE MANAGEMENT MARKET, BY REGION, 2021–2024 (USD MILLION)


TABLE 80
NON-METALLIC: WIRE AND CABLE MANAGEMENT MARKET, BY REGION, 2025–2030 (USD MILLION)


TABLE 81
WIRE AND CABLE MANAGEMENT MARKET, BY PRODUCT, 2021–2024 (USD MILLION)


TABLE 82
WIRE AND CABLE MANAGEMENT MARKET, BY PRODUCT, 2025–2030 (USD MILLION)


TABLE 83
WIRE AND CABLE MANAGEMENT MARKET VOLUME, BY PRODUCT, 2021–2024 (MILLION UNITS)


TABLE 84
WIRE AND CABLE MANAGEMENT MARKET VOLUME, BY PRODUCT, 2025–2030 (MILLION UNITS)


TABLE 85
CONDUITS & TRUNKING: WIRE AND CABLE MANAGEMENT MARKET, BY REGION, 2021–2024 (USD MILLION)


TABLE 86
CONDUITS & TRUNKING: WIRE AND CABLE MANAGEMENT MARKET, BY REGION, 2025–2030 (USD MILLION)


TABLE 87
CONDUITS & TRUNKING: WIRE AND CABLE MANAGEMENT MARKET VOLUME, BY REGION, 2021–2024 (MILLION UNITS)


TABLE 88
CONDUITS & TRUNKING: WIRE AND CABLE MANAGEMENT MARKET VOLUME, BY REGION, 2025–2030 (MILLION UNITS)


TABLE 89
CABLE TRAYS & LADDERS: WIRE AND CABLE MANAGEMENT MARKET, BY REGION, 2021–2024 (USD MILLION)


TABLE 90
CABLE TRAYS & LADDERS: WIRE AND CABLE MANAGEMENT MARKET, BY REGION, 2025–2030 (USD MILLION)


TABLE 91
CABLE TRAYS & LADDERS: WIRE AND CABLE MANAGEMENT MARKET VOLUME, BY REGION, 2021–2024 (MILLION UNITS)


TABLE 92
CABLE TRAYS & LADDERS: WIRE AND CABLE MANAGEMENT MARKET VOLUME, BY REGION, 2025–2030 (MILLION UNITS)


TABLE 93
CABLE RACEWAYS: WIRE AND CABLE MANAGEMENT MARKET, BY REGION, 2021–2024 (USD MILLION)


TABLE 94
CABLE RACEWAYS: WIRE AND CABLE MANAGEMENT MARKET, BY REGION, 2025–2030 (USD MILLION)


TABLE 95
CABLE RACEWAYS: WIRE AND CABLE MANAGEMENT MARKET VOLUME, BY REGION, 2021–2024 (MILLION UNITS)


TABLE 96
CABLE RACEWAYS: WIRE AND CABLE MANAGEMENT MARKET VOLUME, BY REGION, 2025–2030 (MILLION UNITS)


TABLE 97
GLANDS & CONNECTORS: WIRE AND CABLE MANAGEMENT MARKET, BY REGION, 2021–2024 (USD MILLION)


TABLE 98
GLANDS & CONNECTORS: WIRE AND CABLE MANAGEMENT MARKET, BY REGION, 2025–2030 (USD MILLION)


TABLE 99
GLANDS & CONNECTORS: WIRE AND CABLE MANAGEMENT MARKET VOLUME, BY REGION, 2021–2024 (MILLION UNITS)


TABLE 100
GLANDS & CONNECTORS: WIRE AND CABLE MANAGEMENT MARKET VOLUME, BY REGION, 2025–2030 (MILLION UNITS)


TABLE 101
BOXES & COVERS: WIRE AND CABLE MANAGEMENT MARKET, BY REGION, 2021–2024 (USD MILLION)


TABLE 102
BOXES & COVERS: WIRE AND CABLE MANAGEMENT MARKET, BY REGION, 2025–2030 (USD MILLION)


TABLE 103
BOXES & COVERS: WIRE AND CABLE MANAGEMENT MARKET VOLUME, BY REGION, 2021–2024 (MILLION UNITS)


TABLE 104
BOXES & COVERS: WIRE AND CABLE MANAGEMENT MARKET VOLUME, BY REGION, 2025–2030 (MILLION UNITS)


TABLE 105
WIRING DUCTS: WIRE AND CABLE MANAGEMENT MARKET, BY REGION, 2021–2024 (USD MILLION)


TABLE 106
WIRING DUCTS: WIRE AND CABLE MANAGEMENT MARKET, BY REGION, 2025–2030 (USD MILLION)


TABLE 107
WIRING DUCTS: WIRE AND CABLE MANAGEMENT MARKET VOLUME, BY REGION, 2021–2024 (MILLION UNITS)


TABLE 108
WIRING DUCTS: WIRE AND CABLE MANAGEMENT MARKET VOLUME, BY REGION, 2025–2030 (MILLION UNITS)


TABLE 109
TIES, FASTENERS, & CLIPS: WIRE AND CABLE MANAGEMENT MARKET, BY REGION, 2021–2024 (USD MILLION)


TABLE 110
TIES, FASTENERS, & CLIPS: WIRE AND CABLE MANAGEMENT MARKET, BY REGION, 2025–2030 (USD MILLION)


TABLE 111
TIES, FASTENERS, & CLIPS: WIRE AND CABLE MANAGEMENT MARKET VOLUME, BY REGION, 2021–2024 (MILLION UNITS)


TABLE 112
TIES, FASTENERS, & CLIPS: WIRE AND CABLE MANAGEMENT MARKET VOLUME, BY REGION, 2025–2030 (MILLION UNITS)


TABLE 113
OTHER PRODUCTS: WIRE AND CABLE MANAGEMENT MARKET, BY REGION, 2021–2024 (USD MILLION)


TABLE 114
OTHER PRODUCTS: WIRE AND CABLE MANAGEMENT MARKET, BY REGION, 2025–2030 (USD MILLION)


TABLE 115
OTHER PRODUCTS: WIRE AND CABLE MANAGEMENT MARKET VOLUME, BY REGION, 2021–2024 (MILLION UNITS)


TABLE 116
OTHER PRODUCTS: WIRE AND CABLE MANAGEMENT MARKET VOLUME, BY REGION, 2025–2030 (MILLION UNITS)


TABLE 117
WIRE AND CABLE MANAGEMENT MARKET, BY REGION, 2021–2024 (USD MILLION)


TABLE 118
WIRE AND CABLE MANAGEMENT MARKET, BY REGION, 2025–2030 (USD MILLION)


TABLE 119
WIRE AND CABLE MANAGEMENT MARKET VOLUME, BY REGION, 2021–2024 (MILLION UNITS)


TABLE 120
WIRE AND CABLE MANAGEMENT MARKET VOLUME, BY REGION, 2025–2030 (MILLION UNITS)


TABLE 121
ASIA PACIFIC: WIRE AND CABLE MANAGEMENT MARKET, BY PRODUCT, 2021–2024 (USD MILLION)


TABLE 122
ASIA PACIFIC: WIRE AND CABLE MANAGEMENT MARKET, BY PRODUCT, 2025–2030 (USD MILLION)


TABLE 123
ASIA PACIFIC: WIRE AND CABLE MANAGEMENT MARKET VOLUME, BY PRODUCT, 2021–2024 (MILLION UNITS)


TABLE 124
ASIA PACIFIC: WIRE AND CABLE MANAGEMENT MARKET VOLUME, BY PRODUCT, 2025–2030 (MILLION UNITS)


TABLE 125
ASIA PACIFIC: WIRE AND CABLE MANAGEMENT MARKET, BY CABLE TYPE, 2021–2024 (USD MILLION)


TABLE 126
ASIA PACIFIC: WIRE AND CABLE MANAGEMENT MARKET, BY CABLE TYPE, 2025–2030 (USD MILLION)


TABLE 127
ASIA PACIFIC: WIRE AND CABLE MANAGEMENT MARKET, BY MATERIAL, 2021–2024 (USD MILLION)


TABLE 128
ASIA PACIFIC: WIRE AND CABLE MANAGEMENT MARKET, BY MATERIAL, 2025–2030 (USD MILLION)


TABLE 129
ASIA PACIFIC: WIRE AND CABLE MANAGEMENT MARKET, BY INSTALLATION, 2021–2024 (USD MILLION)


TABLE 130
ASIA PACIFIC: WIRE AND CABLE MANAGEMENT MARKET, BY INSTALLATION, 2025–2030 (USD MILLION)


TABLE 131
ASIA PACIFIC: WIRE AND CABLE MANAGEMENT MARKET, BY END USER, 2021–2024 (USD MILLION)


TABLE 132
ASIA PACIFIC: WIRE AND CABLE MANAGEMENT MARKET, BY END USER, 2025–2030 (USD MILLION)


TABLE 133
ASIA PACIFIC: WIRE AND CABLE MANAGEMENT MARKET, BY COMMERCIAL END USER, 2021–2024 (USD MILLION)


TABLE 134
ASIA PACIFIC: WIRE AND CABLE MANAGEMENT MARKET, BY COMMERCIAL END USER, 2025–2030 (USD MILLION)


TABLE 135
ASIA PACIFIC: WIRE AND CABLE MANAGEMENT MARKET, BY INDUSTRIAL END USER, 2021–2024 (USD MILLION)


TABLE 136
ASIA PACIFIC: WIRE AND CABLE MANAGEMENT MARKET, BY INDUSTRIAL END USER, 2025–2030 (USD MILLION)


TABLE 137
ASIA PACIFIC: WIRE AND CABLE MANAGEMENT MARKET, BY COUNTRY, 2021–2024 (USD MILLION)


TABLE 138
ASIA PACIFIC: WIRE AND CABLE MANAGEMENT MARKET, BY COUNTRY, 2025–2030 (USD MILLION)


TABLE 139
CHINA: WIRE AND CABLE MANAGEMENT MARKET, BY END USER, 2021–2024 (USD MILLION)


TABLE 140
CHINA: WIRE AND CABLE MANAGEMENT MARKET, BY END USER, 2025–2030 (USD MILLION)


TABLE 141
CHINA: WIRE AND CABLE MANAGEMENT MARKET, BY COMMERCIAL END USER, 2021–2024 (USD MILLION)


TABLE 142
CHINA: WIRE AND CABLE MANAGEMENT MARKET, BY COMMERCIAL END USER, 2025–2030 (USD MILLION)


TABLE 143
CHINA: WIRE AND CABLE MANAGEMENT MARKET, BY INDUSTRIAL END USER, 2021–2024 (USD MILLION)


TABLE 144
CHINA: WIRE AND CABLE MANAGEMENT MARKET, BY INDUSTRIAL END USER, 2025–2030 (USD MILLION)


TABLE 145
INDIA: WIRE AND CABLE MANAGEMENT MARKET, BY END USER, 2021–2024 (USD MILLION)


TABLE 146
INDIA: WIRE AND CABLE MANAGEMENT MARKET, BY END USER, 2025–2030 (USD MILLION)


TABLE 147
INDIA: WIRE AND CABLE MANAGEMENT MARKET, BY COMMERCIAL END USER, 2021–2024 (USD MILLION)


TABLE 148
INDIA: WIRE AND CABLE MANAGEMENT MARKET, BY COMMERCIAL END USER, 2025–2030 (USD MILLION)


TABLE 149
INDIA: WIRE AND CABLE MANAGEMENT MARKET, BY INDUSTRIAL END USER, 2021–2024 (USD MILLION)


TABLE 150
INDIA: WIRE AND CABLE MANAGEMENT MARKET, BY INDUSTRIAL END USER, 2025–2030 (USD MILLION)


TABLE 151
JAPAN: WIRE AND CABLE MANAGEMENT MARKET, BY END USER, 2021–2024 (USD MILLION)


TABLE 152
JAPAN: WIRE AND CABLE MANAGEMENT MARKET, BY END USER, 2025–2030 (USD MILLION)


TABLE 153
JAPAN: WIRE AND CABLE MANAGEMENT MARKET, BY COMMERCIAL END USER, 2021–2024 (USD MILLION)


TABLE 154
JAPAN: WIRE AND CABLE MANAGEMENT MARKET, BY COMMERCIAL END USER, 2025–2030 (USD MILLION)


TABLE 155
JAPAN: WIRE AND CABLE MANAGEMENT MARKET, BY INDUSTRIAL END USER, 2021–2024 (USD MILLION)


TABLE 156
JAPAN: WIRE AND CABLE MANAGEMENT MARKET, BY INDUSTRIAL END USER, 2025–2030 (USD MILLION)


TABLE 157
AUSTRALIA: WIRE AND CABLE MANAGEMENT MARKET, BY END USER, 2021–2024 (USD MILLION)


TABLE 158
AUSTRALIA: WIRE AND CABLE MANAGEMENT MARKET, BY END USER, 2025–2030 (USD MILLION)


TABLE 159
AUSTRALIA: WIRE AND CABLE MANAGEMENT MARKET, BY COMMERCIAL END USER, 2021–2024 (USD MILLION)


TABLE 160
AUSTRALIA: WIRE AND CABLE MANAGEMENT MARKET, BY COMMERCIAL END USER, 2025–2030 (USD MILLION)


TABLE 161
AUSTRALIA: WIRE AND CABLE MANAGEMENT MARKET, BY INDUSTRIAL END USER, 2021–2024 (USD MILLION)


TABLE 162
AUSTRALIA: WIRE AND CABLE MANAGEMENT MARKET, BY INDUSTRIAL END USER, 2025–2030 (USD MILLION)


TABLE 163
SOUTH KOREA: WIRE AND CABLE MANAGEMENT MARKET, BY END USER, 2021–2024 (USD MILLION)


TABLE 164
SOUTH KOREA: WIRE AND CABLE MANAGEMENT MARKET, BY END USER, 2025–2030 (USD MILLION)


TABLE 165
SOUTH KOREA: WIRE AND CABLE MANAGEMENT MARKET, BY COMMERCIAL END USER, 2021–2024 (USD MILLION)


TABLE 166
SOUTH KOREA: WIRE AND CABLE MANAGEMENT MARKET, BY COMMERCIAL END USER, 2025–2030 (USD MILLION)


TABLE 167
SOUTH KOREA: WIRE AND CABLE MANAGEMENT MARKET, BY INDUSTRIAL END USER, 2021–2024 (USD MILLION)


TABLE 168
SOUTH KOREA: WIRE AND CABLE MANAGEMENT MARKET, BY INDUSTRIAL END USER, 2025–2030 (USD MILLION)


TABLE 169
REST OF ASIA PACIFIC: WIRE AND CABLE MANAGEMENT MARKET, BY END USER, 2021–2024 (USD MILLION)


TABLE 170
REST OF ASIA PACIFIC: WIRE AND CABLE MANAGEMENT MARKET, BY END USER, 2025–2030 (USD MILLION)


TABLE 171
REST OF ASIA PACIFIC: WIRE AND CABLE MANAGEMENT MARKET, BY COMMERCIAL END USER, 2021–2024 (USD MILLION)


TABLE 172
REST OF ASIA PACIFIC: WIRE AND CABLE MANAGEMENT MARKET, BY COMMERCIAL END USER, 2025–2030 (USD MILLION)


TABLE 173
REST OF ASIA PACIFIC: WIRE AND CABLE MANAGEMENT MARKET, BY INDUSTRIAL END USER, 2021–2024 (USD MILLION)


TABLE 174
REST OF ASIA PACIFIC: WIRE AND CABLE MANAGEMENT MARKET, BY INDUSTRIAL END USER, 2025–2030 (USD MILLION)


TABLE 175
NORTH AMERICA: WIRE AND CABLE MANAGEMENT MARKET, BY PRODUCT, 2021–2024 (USD MILLION)


TABLE 176
NORTH AMERICA: WIRE AND CABLE MANAGEMENT MARKET, BY PRODUCT, 2025–2030 (USD MILLION)


TABLE 177
NORTH AMERICA: WIRE AND CABLE MANAGEMENT MARKET VOLUME, BY PRODUCT, 2021–2024 (MILLION UNITS)


TABLE 178
NORTH AMERICA: WIRE AND CABLE MANAGEMENT MARKET VOLUME, BY PRODUCT, 2025–2030 (MILLION UNITS)


TABLE 179
NORTH AMERICA: WIRE AND CABLE MANAGEMENT MARKET, BY CABLE TYPE, 2021–2024 (USD MILLION)


TABLE 180
NORTH AMERICA: WIRE AND CABLE MANAGEMENT MARKET, BY CABLE TYPE, 2025–2030 (USD MILLION)


TABLE 181
NORTH AMERICA: WIRE AND CABLE MANAGEMENT MARKET, BY MATERIAL, 2021–2024 (USD MILLION)


TABLE 182
NORTH AMERICA: WIRE AND CABLE MANAGEMENT MARKET, BY MATERIAL, 2025–2030 (USD MILLION)


TABLE 183
NORTH AMERICA: WIRE AND CABLE MANAGEMENT MARKET, BY INSTALLATION, 2021–2024 (USD MILLION)


TABLE 184
NORTH AMERICA: WIRE AND CABLE MANAGEMENT MARKET, BY INSTALLATION, 2025–2030 (USD MILLION)


TABLE 185
NORTH AMERICA: WIRE AND CABLE MANAGEMENT MARKET, BY END USER, 2021–2024 (USD MILLION)


TABLE 186
NORTH AMERICA: WIRE AND CABLE MANAGEMENT MARKET, BY END USER, 2025–2030 (USD MILLION)


TABLE 187
NORTH AMERICA: WIRE AND CABLE MANAGEMENT MARKET, BY COMMERCIAL END USER, 2021–2024 (USD MILLION)


TABLE 188
NORTH AMERICA: WIRE AND CABLE MANAGEMENT MARKET, BY COMMERCIAL END USER, 2025–2030 (USD MILLION)


TABLE 189
NORTH AMERICA: WIRE AND CABLE MANAGEMENT MARKET, BY INDUSTRIAL END USER, 2021–2024 (USD MILLION)


TABLE 190
NORTH AMERICA: WIRE AND CABLE MANAGEMENT MARKET, BY INDUSTRIAL END USER, 2025–2030 (USD MILLION)


TABLE 191
US: WIRE AND CABLE MANAGEMENT MARKET, BY COUNTRY, 2021–2024 (USD MILLION)


TABLE 192
US: WIRE AND CABLE MANAGEMENT MARKET, BY COUNTRY, 2025–2030 (USD MILLION)


TABLE 193
US: WIRE AND CABLE MANAGEMENT MARKET, BY END USER, 2021–2024 (USD MILLION)


TABLE 194
US: WIRE AND CABLE MANAGEMENT MARKET, BY END USER, 2025–2030 (USD MILLION)


TABLE 195
US: WIRE AND CABLE MANAGEMENT MARKET, BY COMMERCIAL END USER, 2021–2024 (USD MILLION)


TABLE 196
US: WIRE AND CABLE MANAGEMENT MARKET, BY COMMERCIAL END USER, 2025–2030 (USD MILLION)


TABLE 197
US: WIRE AND CABLE MANAGEMENT MARKET, BY INDUSTRIAL END USER, 2021–2024 (USD MILLION)


TABLE 198
US: WIRE AND CABLE MANAGEMENT MARKET, BY INDUSTRIAL END USER, 2025–2030 (USD MILLION)


TABLE 199
CANADA: WIRE AND CABLE MANAGEMENT MARKET, BY END USER, 2021–2024 (USD MILLION)


TABLE 200
CANADA: WIRE AND CABLE MANAGEMENT MARKET, BY END USER, 2025–2030 (USD MILLION)


TABLE 201
CANADA: WIRE AND CABLE MANAGEMENT MARKET, BY COMMERCIAL END USER, 2021–2024 (USD MILLION)


TABLE 202
CANADA: WIRE AND CABLE MANAGEMENT MARKET, BY COMMERCIAL END USER, 2025–2030 (USD MILLION)


TABLE 203
CANADA: WIRE AND CABLE MANAGEMENT MARKET, BY INDUSTRIAL END USER, 2021–2024 (USD MILLION)


TABLE 204
CANADA: WIRE AND CABLE MANAGEMENT MARKET, BY INDUSTRIAL END USER, 2025–2030 (USD MILLION)


TABLE 205
MEXICO: WIRE AND CABLE MANAGEMENT MARKET, BY END USER, 2021–2024 (USD MILLION)


TABLE 206
MEXICO: WIRE AND CABLE MANAGEMENT MARKET, BY END USER, 2025–2030 (USD MILLION)


TABLE 207
MEXICO: WIRE AND CABLE MANAGEMENT MARKET, BY COMMERCIAL END USER, 2021–2024 (USD MILLION)


TABLE 208
MEXICO: WIRE AND CABLE MANAGEMENT MARKET, BY COMMERCIAL END USER, 2025–2030 (USD MILLION)


TABLE 209
MEXICO: WIRE AND CABLE MANAGEMENT MARKET, BY INDUSTRIAL END USER, 2021–2024 (USD MILLION)


TABLE 210
MEXICO: WIRE AND CABLE MANAGEMENT MARKET, BY INDUSTRIAL END USER, 2025–2030 (USD MILLION)


TABLE 211
SOUTH AMERICA: WIRE AND CABLE MANAGEMENT MARKET, BY CABLE TYPE, 2021–2024 (USD MILLION)


TABLE 212
SOUTH AMERICA: WIRE AND CABLE MANAGEMENT MARKET, BY CABLE TYPE, 2025–2030 (USD MILLION)


TABLE 213
SOUTH AMERICA: WIRE AND CABLE MANAGEMENT MARKET, BY PRODUCT, 2021–2024 (USD MILLION)


TABLE 214
SOUTH AMERICA: WIRE AND CABLE MANAGEMENT MARKET, BY PRODUCT, 2025–2030 (USD MILLION)


TABLE 215
SOUTH AMERICA: WIRE AND CABLE MANAGEMENT MARKET VOLUME, BY PRODUCT, 2021–2024 (MILLION UNITS)


TABLE 216
SOUTH AMERICA: WIRE AND CABLE MANAGEMENT MARKET VOLUME, BY PRODUCT, 2025–2030 (MILLION UNITS)


TABLE 217
SOUTH AMERICA: WIRE AND CABLE MANAGEMENT MARKET, BY MATERIAL, 2021–2024


TABLE 218
SOUTH AMERICA: WIRE AND CABLE MANAGEMENT MARKET, BY MATERIAL, 2025–2030


TABLE 219
SOUTH AMERICA: WIRE AND CABLE MANAGEMENT MARKET, BY INSTALLATION, 2021–2024 (USD MILLION)


TABLE 220
SOUTH AMERICA: WIRE AND CABLE MANAGEMENT MARKET, BY INSTALLATION, 2025–2030 (USD MILLION)


TABLE 221
SOUTH AMERICA: WIRE AND CABLE MANAGEMENT MARKET, BY END USER, 2021–2024 (USD MILLION)


TABLE 222
SOUTH AMERICA: WIRE AND CABLE MANAGEMENT MARKET, BY END USER, 2025–2030 (USD MILLION)


TABLE 223
SOUTH AMERICA: WIRE AND CABLE MANAGEMENT MARKET, BY COMMERCIAL END USER, 2021–2024 (USD MILLION)


TABLE 224
SOUTH AMERICA: WIRE AND CABLE MANAGEMENT MARKET, BY COMMERCIAL END USER, 2025–2030 (USD MILLION)


TABLE 225
SOUTH AMERICA: WIRE AND CABLE MANAGEMENT MARKET, BY INDUSTRIAL END USER, 2021–2024 (USD MILLION)


TABLE 226
SOUTH AMERICA: WIRE AND CABLE MANAGEMENT MARKET, BY INDUSTRIAL END USER, 2025–2030 (USD MILLION)


TABLE 227
SOUTH AMERICA: WIRE AND CABLE MANAGEMENT MARKET, BY COUNTRY, 2021–2024 (USD MILLION)


TABLE 228
SOUTH AMERICA: WIRE AND CABLE MANAGEMENT MARKET, BY COUNTRY, 2025–2030 (USD MILLION)


TABLE 229
BRAZIL: WIRE AND CABLE MANAGEMENT MARKET, BY END USER, 2021–2024 (USD MILLION)


TABLE 230
BRAZIL: WIRE AND CABLE MANAGEMENT MARKET, BY END USER, 2025–2030 (USD MILLION)


TABLE 231
BRAZIL: WIRE AND CABLE MANAGEMENT MARKET, BY COMMERCIAL END USER, 2021–2024 (USD MILLION)


TABLE 232
BRAZIL: WIRE AND CABLE MANAGEMENT MARKET, BY COMMERCIAL END USER, 2025–2030 (USD MILLION)


TABLE 233
BRAZIL: WIRE AND CABLE MANAGEMENT MARKET, BY INDUSTRIAL END USER, 2021–2024 (USD MILLION)


TABLE 234
BRAZIL: WIRE AND CABLE MANAGEMENT MARKET, BY INDUSTRIAL END USER, 2025–2030 (USD MILLION)


TABLE 235
ARGENTINA: WIRE AND CABLE MANAGEMENT MARKET, BY END USER, 2021–2024 (USD MILLION)


TABLE 236
ARGENTINA: WIRE AND CABLE MANAGEMENT MARKET, BY END USER, 2025–2030 (USD MILLION)


TABLE 237
ARGENTINA: WIRE AND CABLE MANAGEMENT MARKET, BY COMMERCIAL END USER, 2021–2024 (USD MILLION)


TABLE 238
ARGENTINA: WIRE AND CABLE MANAGEMENT MARKET, BY COMMERCIAL END USER, 2025–2030 (USD MILLION)


TABLE 239
ARGENTINA: WIRE AND CABLE MANAGEMENT MARKET, BY INDUSTRIAL END USER, 2021–2024 (USD MILLION)


TABLE 240
ARGENTINA: WIRE AND CABLE MANAGEMENT MARKET, BY INDUSTRIAL END USER, 2025–2030 (USD MILLION)


TABLE 241
COLOMBIA: WIRE AND CABLE MANAGEMENT MARKET, BY END USER, 2021–2024 (USD MILLION)


TABLE 242
COLOMBIA: WIRE AND CABLE MANAGEMENT MARKET, BY END USER, 2025–2030 (USD MILLION)


TABLE 243
COLOMBIA: WIRE AND CABLE MANAGEMENT MARKET, BY COMMERCIAL END USER, 2021–2024 (USD MILLION)


TABLE 244
COLOMBIA: WIRE AND CABLE MANAGEMENT MARKET, BY COMMERCIAL END USER, 2025–2030 (USD MILLION)


TABLE 245
COLOMBIA: WIRE AND CABLE MANAGEMENT MARKET, BY INDUSTRIAL END USER, 2021–2024 (USD MILLION)


TABLE 246
COLOMBIA: WIRE AND CABLE MANAGEMENT MARKET, BY INDUSTRIAL END USER, 2025–2030 (USD MILLION)


TABLE 247
REST OF SOUTH AMERICA: WIRE AND CABLE MANAGEMENT MARKET, BY END USER, 2021–2024 (USD MILLION)


TABLE 248
REST OF SOUTH AMERICA: WIRE AND CABLE MANAGEMENT MARKET, BY END USER, 2025–2030 (USD MILLION)


TABLE 249
REST OF SOUTH AMERICA: WIRE AND CABLE MANAGEMENT MARKET, BY COMMERCIAL END USER, 2021–2024 (USD MILLION)


TABLE 250
REST OF SOUTH AMERICA: WIRE AND CABLE MANAGEMENT MARKET, BY COMMERCIAL END USER, 2025–2030 (USD MILLION)


TABLE 251
REST OF SOUTH AMERICA: WIRE AND CABLE MANAGEMENT MARKET, BY INDUSTRIAL END USER, 2021–2024 (USD MILLION)


TABLE 252
REST OF SOUTH AMERICA: WIRE AND CABLE MANAGEMENT MARKET, BY INDUSTRIAL END USER, 2025–2030 (USD MILLION)


TABLE 253
EUROPE: WIRE AND CABLE MANAGEMENT MARKET, BY CABLE TYPE, 2021–2024 (USD MILLION)


TABLE 254
EUROPE: WIRE AND CABLE MANAGEMENT MARKET, BY CABLE TYPE, 2025–2030 (USD MILLION)


TABLE 255
EUROPE: WIRE AND CABLE MANAGEMENT MARKET, BY PRODUCT, 2021–2024 (USD MILLION)


TABLE 256
EUROPE: WIRE AND CABLE MANAGEMENT MARKET, BY PRODUCT, 2025–2030 (USD MILLION)


TABLE 257
EUROPE: WIRE AND CABLE MANAGEMENT MARKET VOLUME, BY PRODUCT, 2021–2024 (MILLION UNITS)


TABLE 258
EUROPE: WIRE AND CABLE MANAGEMENT MARKET VOLUME, BY PRODUCT, 2025–2030 (MILLION UNITS)


TABLE 259
EUROPE: WIRE AND CABLE MANAGEMENT MARKET, BY MATERIAL, 2021–2024


TABLE 260
EUROPE: WIRE AND CABLE MANAGEMENT MARKET, BY MATERIAL, 2025–2030


TABLE 261
EUROPE: WIRE AND CABLE MANAGEMENT MARKET, BY INSTALLATION, 2021–2024 (USD MILLION)


TABLE 262
EUROPE: WIRE AND CABLE MANAGEMENT MARKET, BY INSTALLATION, 2025–2030 (USD MILLION)


TABLE 263
EUROPE: WIRE AND CABLE MANAGEMENT MARKET, BY END USER, 2021–2024 (USD MILLION)


TABLE 264
EUROPE: WIRE AND CABLE MANAGEMENT MARKET, BY END USER, 2025–2030 (USD MILLION)


TABLE 265
EUROPE: WIRE AND CABLE MANAGEMENT MARKET, BY COMMERCIAL END USER, 2021–2024 (USD MILLION)


TABLE 266
EUROPE: WIRE AND CABLE MANAGEMENT MARKET, BY COMMERCIAL END USER, 2025–2030 (USD MILLION)


TABLE 267
EUROPE: WIRE AND CABLE MANAGEMENT MARKET, BY INDUSTRIAL END USER, 2021–2024 (USD MILLION)


TABLE 268
EUROPE: WIRE AND CABLE MANAGEMENT MARKET, BY INDUSTRIAL END USER, 2025–2030 (USD MILLION)


TABLE 269
EUROPE: WIRE AND CABLE MANAGEMENT MARKET, BY COUNTRY, 2021–2024 (USD MILLION)


TABLE 270
EUROPE: WIRE AND CABLE MANAGEMENT MARKET, BY COUNTRY, 2025–2030 (USD MILLION)


TABLE 271
GERMANY: WIRE AND CABLE MANAGEMENT MARKET, BY END USER, 2021–2024 (USD MILLION)


TABLE 272
GERMANY: WIRE AND CABLE MANAGEMENT MARKET, BY END USER, 2025–2030 (USD MILLION)


TABLE 273
GERMANY: WIRE AND CABLE MANAGEMENT MARKET, BY COMMERCIAL END USER, 2021–2024 (USD MILLION)


TABLE 274
GERMANY: WIRE AND CABLE MANAGEMENT MARKET, BY COMMERCIAL END USER, 2025–2030 (USD MILLION)


TABLE 275
GERMANY: WIRE AND CABLE MANAGEMENT MARKET, BY INDUSTRIAL END USER, 2021–2024 (USD MILLION)


TABLE 276
GERMANY: WIRE AND CABLE MANAGEMENT MARKET, BY INDUSTRIAL END USER, 2025–2030 (USD MILLION)


TABLE 277
UK: WIRE AND CABLE MANAGEMENT MARKET, BY END USER, 2021–2024 (USD MILLION)


TABLE 278
UK: WIRE AND CABLE MANAGEMENT MARKET, BY END USER, 2025–2030 (USD MILLION)


TABLE 279
UK: WIRE AND CABLE MANAGEMENT MARKET, BY COMMERCIAL END USER, 2021–2024 (USD MILLION)


TABLE 280
UK: WIRE AND CABLE MANAGEMENT MARKET, BY COMMERCIAL END USER, 2025–2030 (USD MILLION)


TABLE 281
UK: WIRE AND CABLE MANAGEMENT MARKET, BY INDUSTRIAL END USER, 2021–2024 (USD MILLION)


TABLE 282
UK: WIRE AND CABLE MANAGEMENT MARKET, BY INDUSTRIAL END USER, 2025–2030 (USD MILLION)


TABLE 283
ITALY: WIRE AND CABLE MANAGEMENT MARKET, BY END USER, 2021–2024 (USD MILLION)


TABLE 284
ITALY: WIRE AND CABLE MANAGEMENT MARKET, BY END USER, 2025–2030 (USD MILLION)


TABLE 285
ITALY: WIRE AND CABLE MANAGEMENT MARKET, BY COMMERCIAL END USER, 2021–2024 (USD MILLION)


TABLE 286
ITALY: WIRE AND CABLE MANAGEMENT MARKET, BY COMMERCIAL END USER, 2025–2030 (USD MILLION)


TABLE 287
ITALY: WIRE AND CABLE MANAGEMENT MARKET, BY INDUSTRIAL END USER, 2021–2024 (USD MILLION)


TABLE 288
ITALY: WIRE AND CABLE MANAGEMENT MARKET, BY INDUSTRIAL END USER, 2025–2030 (USD MILLION)


TABLE 289
FRANCE: WIRE AND CABLE MANAGEMENT MARKET, BY END USER, 2021–2024 (USD MILLION)


TABLE 290
FRANCE: WIRE AND CABLE MANAGEMENT MARKET, BY END USER, 2025–2030 (USD MILLION)


TABLE 291
FRANCE: WIRE AND CABLE MANAGEMENT MARKET, BY COMMERCIAL END USER, 2021–2024 (USD MILLION)


TABLE 292
FRANCE: WIRE AND CABLE MANAGEMENT MARKET, BY COMMERCIAL END USER, 2025–2030 (USD MILLION)


TABLE 293
FRANCE: WIRE AND CABLE MANAGEMENT MARKET, BY INDUSTRIAL END USER, 2021–2024 (USD MILLION)


TABLE 294
FRANCE: WIRE AND CABLE MANAGEMENT MARKET, BY INDUSTRIAL END USER, 2025–2030 (USD MILLION)


TABLE 295
SPAIN: WIRE AND CABLE MANAGEMENT MARKET, BY END USER, 2021–2024 (USD MILLION)


TABLE 296
SPAIN: WIRE AND CABLE MANAGEMENT MARKET, BY END USER, 2025–2030 (USD MILLION)


TABLE 297
SPAIN: WIRE AND CABLE MANAGEMENT MARKET, BY COMMERCIAL END USER, 2021–2024 (USD MILLION)


TABLE 298
SPAIN: WIRE AND CABLE MANAGEMENT MARKET, BY COMMERCIAL END USER, 2025–2030 (USD MILLION)


TABLE 299
SPAIN: WIRE AND CABLE MANAGEMENT MARKET, BY INDUSTRIAL END USER, 2021–2024 (USD MILLION)


TABLE 300
SPAIN: WIRE AND CABLE MANAGEMENT MARKET, BY INDUSTRIAL END USER, 2025–2030 (USD MILLION)


TABLE 301
REST OF EUROPE: WIRE AND CABLE MANAGEMENT MARKET, BY END USER, 2021–2024 (USD MILLION)


TABLE 302
REST OF EUROPE: WIRE AND CABLE MANAGEMENT MARKET, BY END USER, 2025–2030 (USD MILLION)


TABLE 303
REST OF EUROPE: WIRE AND CABLE MANAGEMENT MARKET, BY COMMERCIAL END USER, 2021–2024 (USD MILLION)


TABLE 304
REST OF EUROPE: WIRE AND CABLE MANAGEMENT MARKET, BY COMMERCIAL END USER, 2025–2030 (USD MILLION)


TABLE 305
REST OF EUROPE: WIRE AND CABLE MANAGEMENT MARKET, BY INDUSTRIAL END USER, 2021–2024 (USD MILLION)


TABLE 306
REST OF EUROPE: WIRE AND CABLE MANAGEMENT MARKET, BY INDUSTRIAL END USER, 2025–2030 (USD MILLION)


TABLE 307
MIDDLE EAST & AFRICA: WIRE AND CABLE MANAGEMENT MARKET, BY CABLE TYPE, 2021–2024 (USD MILLION)


TABLE 308
MIDDLE EAST & AFRICA: WIRE AND CABLE MANAGEMENT MARKET, BY CABLE TYPE, 2025–2030 (USD MILLION)


TABLE 309
MIDDLE EAST & AFRICA: WIRE AND CABLE MANAGEMENT MARKET, BY PRODUCT, 2021–2024 (USD MILLION)


TABLE 310
MIDDLE EAST & AFRICA: WIRE AND CABLE MANAGEMENT MARKET, BY PRODUCT, 2025–2030 (USD MILLION)


TABLE 311
MIDDLE EAST & AFRICA: WIRE AND CABLE MANAGEMENT MARKET VOLUME, BY PRODUCT, 2021–2024 (MILLION UNITS)


TABLE 312
MIDDLE EAST & AFRICA: WIRE AND CABLE MANAGEMENT MARKET VOLUME, BY PRODUCT, 2025–2030 (MILLION UNITS)


TABLE 313
MIDDLE EAST & AFRICA: WIRE AND CABLE MANAGEMENT MARKET, BY MATERIAL, 2021–2024 (USD MILLION)


TABLE 314
MIDDLE EAST & AFRICA: WIRE AND CABLE MANAGEMENT MARKET, BY MATERIAL, 2025–2030 (USD MILLION)


TABLE 315
MIDDLE EAST & AFRICA: WIRE AND CABLE MANAGEMENT MARKET, BY INSTALLATION, 2021–2024 (USD MILLION)


TABLE 316
MIDDLE EAST & AFRICA: WIRE AND CABLE MANAGEMENT MARKET, BY INSTALLATION, 2025–2030 (USD MILLION)


TABLE 317
MIDDLE EAST & AFRICA: WIRE AND CABLE MANAGEMENT MARKET, BY END USER, 2021–2024 (USD MILLION)


TABLE 318
MIDDLE EAST & AFRICA: WIRE AND CABLE MANAGEMENT MARKET, BY END USER, 2025–2030 (USD MILLION)


TABLE 319
MIDDLE EAST & AFRICA: WIRE AND CABLE MANAGEMENT MARKET, BY COMMERCIAL END USER, 2021–2024 (USD MILLION)


TABLE 320
MIDDLE EAST & AFRICA: WIRE AND CABLE MANAGEMENT MARKET, BY COMMERCIAL END USER, 2025–2030 (USD MILLION)


TABLE 321
MIDDLE EAST & AFRICA: WIRE AND CABLE MANAGEMENT MARKET, BY INDUSTRIAL END USER, 2021–2024 (USD MILLION)


TABLE 322
MIDDLE EAST & AFRICA: WIRE AND CABLE MANAGEMENT MARKET, BY INDUSTRIAL END USER, 2025–2030 (USD MILLION)


TABLE 323
MIDDLE EAST & AFRICA: WIRE AND CABLE MANAGEMENT MARKET, BY COUNTRY, 2021–2024 (USD MILLION)


TABLE 324
MIDDLE EAST & AFRICA: WIRE AND CABLE MANAGEMENT MARKET, BY COUNTRY, 2025–2030 (USD MILLION)


TABLE 325
GCC: WIRE AND CABLE MANAGEMENT MARKET, BY END USER, 2021–2024 (USD MILLION)


TABLE 326
GCC: WIRE AND CABLE MANAGEMENT MARKET, BY END USER, 2025–2030 (USD MILLION)


TABLE 327
GCC: WIRE AND CABLE MANAGEMENT MARKET, BY COMMERCIAL END USER, 2021–2024 (USD MILLION)


TABLE 328
GCC: WIRE AND CABLE MANAGEMENT MARKET, BY COMMERCIAL END USER, 2025–2030 (USD MILLION)


TABLE 329
GCC: WIRE AND CABLE MANAGEMENT MARKET, BY INDUSTRIAL END USER, 2021–2024 (USD MILLION)


TABLE 330
GCC: WIRE AND CABLE MANAGEMENT MARKET, BY INDUSTRIAL END USER, 2025–2030 (USD MILLION)


TABLE 331
GCC: WIRE AND CABLE MANAGEMENT MARKET, BY COUNTRY, 2021–2024 (USD MILLION)


TABLE 332
GCC: WIRE AND CABLE MANAGEMENT MARKET, BY COUNTRY, 2025–2030 (USD MILLION)


TABLE 333
SAUDI ARABIA: WIRE AND CABLE MANAGEMENT MARKET, BY END USER, 2021–2024 (USD MILLION)


TABLE 334
SAUDI ARABIA: WIRE AND CABLE MANAGEMENT MARKET, BY END USER, 2025–2030 (USD MILLION)


TABLE 335
SAUDI ARABIA: WIRE AND CABLE MANAGEMENT MARKET, BY COMMERCIAL END USER, 2021–2024 (USD MILLION)


TABLE 336
SAUDI ARABIA: WIRE AND CABLE MANAGEMENT MARKET, BY COMMERCIAL END USER, 2025–2030 (USD MILLION)


TABLE 337
SAUDI ARABIA: WIRE AND CABLE MANAGEMENT MARKET, BY INDUSTRIAL END USER, 2021–2024 (USD MILLION)


TABLE 338
SAUDI ARABIA: WIRE AND CABLE MANAGEMENT MARKET, BY INDUSTRIAL END USER, 2025–2030 (USD MILLION)


TABLE 339
UAE: WIRE AND CABLE MANAGEMENT MARKET, BY END USER, 2021–2024 (USD MILLION)


TABLE 340
UAE: WIRE AND CABLE MANAGEMENT MARKET, BY END USER, 2025–2030 (USD MILLION)


TABLE 341
UAE: WIRE AND CABLE MANAGEMENT MARKET, BY COMMERCIAL END USER, 2021–2024 (USD MILLION)


TABLE 342
UAE: WIRE AND CABLE MANAGEMENT MARKET, BY COMMERCIAL END USER, 2025–2030 (USD MILLION)


TABLE 343
UAE: WIRE AND CABLE MANAGEMENT MARKET, BY INDUSTRIAL END USER, 2021–2024 (USD MILLION)


TABLE 344
UAE: WIRE AND CABLE MANAGEMENT MARKET, BY INDUSTRIAL END USER, 2025–2030 (USD MILLION)


TABLE 345
REST OF GCC: WIRE AND CABLE MANAGEMENT MARKET, BY END USER, 2021–2024 (USD MILLION)


TABLE 346
REST OF GCC: WIRE AND CABLE MANAGEMENT MARKET, BY END USER, 2025–2030 (USD MILLION)


TABLE 347
REST OF GCC: WIRE AND CABLE MANAGEMENT MARKET, BY COMMERCIAL END USER, 2021–2024 (USD MILLION)


TABLE 348
REST OF GCC: WIRE AND CABLE MANAGEMENT MARKET, BY COMMERCIAL END USER, 2025–2030 (USD MILLION)


TABLE 349
REST OF GCC: WIRE AND CABLE MANAGEMENT MARKET, BY INDUSTRIAL END USER, 2021–2024 (USD MILLION)


TABLE 350
REST OF GCC: WIRE AND CABLE MANAGEMENT MARKET, BY INDUSTRIAL END USER, 2025–2030 (USD MILLION)


TABLE 351
SOUTH AFRICA: WIRE AND CABLE MANAGEMENT MARKET, BY END USER, 2021–2024 (USD MILLION)


TABLE 352
SOUTH AFRICA: WIRE AND CABLE MANAGEMENT MARKET, BY END USER, 2025–2030 (USD MILLION)


TABLE 353
SOUTH AFRICA: WIRE AND CABLE MANAGEMENT MARKET, BY COMMERCIAL END USER, 2021–2024 (USD MILLION)


TABLE 354
SOUTH AFRICA: WIRE AND CABLE MANAGEMENT MARKET, BY COMMERCIAL END USER, 2025–2030 (USD MILLION)


TABLE 355
SOUTH AFRICA: WIRE AND CABLE MANAGEMENT MARKET, BY INDUSTRIAL END USER, 2021–2024 (USD MILLION)


TABLE 356
SOUTH AFRICA: WIRE AND CABLE MANAGEMENT MARKET, BY INDUSTRIAL END USER, 2025–2030 (USD MILLION)


TABLE 357
REST OF MIDDLE EAST & AFRICA: WIRE AND CABLE MANAGEMENT MARKET, BY END USER, 2021–2024 (USD MILLION)


TABLE 358
REST OF MIDDLE EAST & AFRICA: WIRE AND CABLE MANAGEMENT MARKET, BY END USER, 2025–2030 (USD MILLION)


TABLE 359
REST OF MIDDLE EAST & AFRICA: WIRE AND CABLE MANAGEMENT MARKET, BY COMMERCIAL END USER, 2021–2024 (USD MILLION)


TABLE 360
REST OF MIDDLE EAST & AFRICA: WIRE AND CABLE MANAGEMENT MARKET, BY COMMERCIAL END USER, 2025–2030 (USD MILLION)


TABLE 361
REST OF MIDDLE EAST & AFRICA: WIRE AND CABLE MANAGEMENT MARKET, BY INDUSTRIAL END USER, 2021–2024 (USD MILLION)


TABLE 362
REST OF MIDDLE EAST & AFRICA: WIRE AND CABLE MANAGEMENT MARKET, BY INDUSTRIAL END USER, 2025–2030 (USD MILLION)


TABLE 363
OVERVIEW OF KEY STRATEGIES ADOPTED BY KEY PLAYERS, FEBRUARY 2021–MAY 2025


TABLE 364
WIRE AND CABLE MANAGEMENT MARKET: DEGREE OF COMPETITION


TABLE 365
WIRE AND CABLE MANAGEMENT MARKET: REGION FOOTPRINT


TABLE 366
WIRE AND CABLE MANAGEMENT MARKET: PRODUCT FOOTPRINT


TABLE 367
WIRE AND CABLE MANAGEMENT MARKET: MATERIAL FOOTPRINT


TABLE 368
WIRE AND CABLE MANAGEMENT MARKET: CABLE TYPE FOOTPRINT


TABLE 369
WIRE AND CABLE MANAGEMENT MARKET: DETAILED LIST OF KEY STARTUPS/SMES


TABLE 370
WIRE AND CABLE MANAGEMENT MARKET: COMPETITIVE BENCHMARKING OF KEY STARTUPS/SMES


TABLE 371
WIRE AND CABLE MANAGEMENT MARKET: PRODUCT LAUNCHES, FEBRUARY 2021–MAY 2025


TABLE 372
WIRE AND CABLE MANAGEMENT MARKET: DEALS, FEBRUARY 2021–MAY 2025


TABLE 373
WIRE AND CABLE MANAGEMENT MARKET: EXPANSIONS, FEBRUARY 2021–MAY 2025


TABLE 374
ABB: COMPANY OVERVIEW


TABLE 375
ABB: PRODUCTS/SOLUTIONS/SERVICES OFFERED


TABLE 376
ABB: DEALS


TABLE 377
ABB: EXPANSIONS


TABLE 378
LEGRAND: COMPANY OVERVIEW


TABLE 379
LEGRAND: PRODUCTS/SOLUTIONS/SERVICES OFFERED


TABLE 380
LEGRAND: PRODUCT LAUNCHES


TABLE 381
ATKORE: COMPANY OVERVIEW


TABLE 382
ATKORE: PRODUCTS/SOLUTIONS/SERVICES OFFERED


TABLE 383
ATKORE: DEALS


TABLE 384
EATON: BUSINESS OVERVIEW


TABLE 385
EATON: PRODUCTS/SOLUTIONS/SERVICES OFFERED


TABLE 386
EATON: PRODUCT LAUNCHES


TABLE 387
NVENT: COMPANY OVERVIEW


TABLE 388
NVENT: PRODUCTS/SOLUTIONS/SERVICES OFFERED


TABLE 389
NVENT: DEALS


TABLE 390
PANDUIT CORP.: COMPANY OVERVIEW


TABLE 391
PANDUIT CORP.: PRODUCTS/SOLUTIONS/SERVICES OFFERED


TABLE 392
PANDUIT CORP.: PRODUCT LAUNCHES


TABLE 393
PANDUIT CORP.: DEALS


TABLE 394
PANDUIT CORP.: EXPANSIONS


TABLE 395
BELDEN INC.: COMPANY OVERVIEW


TABLE 396
BELDEN INC.: PRODUCTS/SOLUTIONS/SERVICES OFFERED


TABLE 397
SCHNEIDER ELECTRIC: COMPANY OVERVIEW


TABLE 398
SCHNEIDER ELECTRIC: PRODUCTS/SOLUTIONS/SERVICES OFFERED


TABLE 399
HUBBELL: COMPANY OVERVIEW


TABLE 400
HUBBELL: PRODUCTS/SOLUTIONS/SERVICES OFFERED


TABLE 401
HILTI: COMPANY OVERVIEW


TABLE 402
HILTI: PRODUCTS/SOLUTIONS/SERVICES OFFERED


TABLE 403
TE CONNECTIVITY: COMPANY OVERVIEW


TABLE 404
TE CONNECTIVITY: PRODUCTS/SOLUTIONS/SERVICES OFFERED


TABLE 405
TE CONNECTIVITY: PRODUCT LAUNCHES


TABLE 406
TE CONNECTIVITY: DEALS


TABLE 407
SALZER: COMPANY OVERVIEW


TABLE 408
SALZER: PRODUCTS/SOLUTIONS/SERVICES OFFERED


TABLE 409
3M: COMPANY OVERVIEW


TABLE 410
3M: PRODUCTS/SOLUTIONS/SERVICES OFFERED


TABLE 411
ILLINOIS TOOL WORKS INC.: COMPANY OVERVIEW


TABLE 412
ILLINOIS TOOL WORKS INC.: PRODUCTS/SOLUTIONS/SERVICES OFFERED


TABLE 413
NOVOFLEX: COMPANY OVERVIEW


TABLE 414
NOVOFLEX: PRODUCTS/SOLUTIONS/SERVICES OFFERED


LIST OF FIGURES


FIGURE 1
WIRE AND CABLE MANAGEMENT MARKET AND REGIONAL SEGMENTATION


FIGURE 2
WIRE AND CABLE MANAGEMENT MARKET: RESEARCH DESIGN


FIGURE 3
KEY METRICS CONSIDERED TO ANALYZE DEMAND FOR WIRE AND CABLE MANAGEMENT


FIGURE 4
MARKET SIZE ESTIMATION METHODOLOGY: BOTTOM-UP APPROACH


FIGURE 5
MARKET SIZE ESTIMATION METHODOLOGY: TOP-DOWN APPROACH


FIGURE 6
KEY STEPS CONSIDERED TO ASSESS SUPPLY OF WIRE AND CABLE MANAGEMENT


FIGURE 7
WIRE AND CABLE MANAGEMENT MARKET: SUPPLY-SIDE ANALYSIS


FIGURE 8
DATA TRIANGULATION


FIGURE 9
ASIA PACIFIC TO BE FASTEST-GROWING MARKET DURING FORECAST PERIOD


FIGURE 10
CONDUITS & TRUNKING SEGMENT HELD LARGEST MARKET SHARE IN 2024


FIGURE 11
COMMUNICATION WIRES & CABLES SEGMENT TO RECORD HIGHER CAGR DURING FORECAST PERIOD


FIGURE 12
METALLIC SEGMENT TO ACCOUNT FOR LARGER MARKET SHARE IN 2030


FIGURE 13
SUBMARINE SEGMENT TO EXHIBIT HIGHEST CAGR DURING FORECAST PERIOD


FIGURE 14
INDUSTRIAL SEGMENT TO LEAD MARKET IN 2030


FIGURE 15
INCREASING INVESTMENTS IN POWER DISTRIBUTION AND 5G INTERNET INFRASTRUCTURE TO DRIVE MARKET DURING FORECAST PERIOD


FIGURE 16
ASIA PACIFIC TO EXPAND AT HIGHEST CAGR DURING FORECAST PERIOD


FIGURE 17
INDUSTRIAL SEGMENT AND CHINA ACCOUNTED FOR LARGEST MARKET SHARES IN 2024


FIGURE 18
CONDUITS & TRUNKING TO CAPTURE LARGEST MARKET SHARE IN 2030


FIGURE 19
POWER CABLES SEGMENT TO ACCOUNT FOR LARGEST MARKET SHARE IN 2030


FIGURE 20
METALLIC SEGMENT TO SECURE LARGER MARKET SHARE IN 2030


FIGURE 21
UNDERGROUND SEGMENT TO COMMAND LARGEST MARKET SHARE IN 2030


FIGURE 22
INDUSTRIAL SEGMENT TO DOMINATE MARKET IN 2030


FIGURE 23
WIRE AND CABLE MANAGEMENT MARKET: DRIVERS, RESTRAINTS, OPPORTUNITIES, AND CHALLENGES


FIGURE 24
GLOBAL INVESTMENTS IN CLEAN ENERGY, 2015–2025


FIGURE 25
ENERGY INVESTMENTS, BY REGION AND SECTOR


FIGURE 26
CAPITAL EXPENDITURE IN INFRASTRUCTURE SECTOR OF INDIA, 2024


FIGURE 27
TRENDS/DISRUPTIONS IMPACTING CUSTOMER BUSINESS


FIGURE 28
AVERAGE SELLING PRICE TREND OF WIRE AND CABLE MANAGEMENT, BY PRODUCT, 2021–2024


FIGURE 29
AVERAGE SELLING PRICE TREND OF WIRE AND CABLE MANAGEMENT, BY REGION, 2021–2024


FIGURE 30
WIRE AND CABLE MANAGEMENT MARKET: VALUE CHAIN ANALYSIS


FIGURE 31
WIRE AND CABLE MANAGEMENT MARKET: ECOSYSTEM ANALYSIS


FIGURE 32
WIRE AND CABLE MANAGEMENT MARKET: PATENTS GRANTED AND APPLIED, 2014–2024


FIGURE 33
IMPORT DATA FOR HS CODE 8547- (INSULATING FITTINGS FOR ELECTRICAL MACHINES), 2020–2024


FIGURE 34
EXPORT SCENARIO FOR HS CODE 8547- (INSULATING FITTINGS FOR ELECTRICAL MACHINES), 2020–2024


FIGURE 35
WIRE AND CABLE MANAGEMENT MARKET: PORTER'S FIVE FORCES ANALYSIS


FIGURE 36
INFLUENCE OF KEY STAKEHOLDERS ON BUYING PROCESS FOR TOP THREE INDUSTRIAL END USERS


FIGURE 37
KEY BUYING CRITERIA FOR TOP THREE INDUSTRIAL END USERS


FIGURE 38
INVESTMENT AND FUNDING SCENARIO


FIGURE 39
IMPACT OF GEN AI/AI ON WIRE AND CABLE MANAGEMENT MARKET, BY REGION


FIGURE 40
WIRE AND CABLE MANAGEMENT MARKET, BY CABLE TYPE, 2024


FIGURE 41
WIRE AND CABLE MANAGEMENT MARKET, BY END USER, 2024


FIGURE 42
WIRE AND CABLE MANAGEMENT MARKET, BY INSTALLATION, 2024


FIGURE 43
WIRE AND CABLE MANAGEMENT MARKET, BY MATERIAL, 2024


FIGURE 44
WIRE AND CABLE MANAGEMENT MARKET, BY CABLE TYPE, 2024


FIGURE 45
ASIA PACIFIC TO REGISTER HIGHEST CAGR DURING FORECAST PERIOD


FIGURE 46
WIRE AND CABLE MANAGEMENT MARKET, BY REGION


FIGURE 47
ASIA PACIFIC: WIRE AND CABLE MANAGEMENT MARKET SNAPSHOT


FIGURE 48
NORTH AMERICA: WIRE AND CABLE MANAGEMENT MARKET SNAPSHOT


FIGURE 49
MARKET SHARE ANALYSIS OF COMPANIES OFFERING WIRE AND CABLE MANAGEMENTS, 2024


FIGURE 50
REVENUE ANALYSIS OF FIVE KEY PLAYERS IN WIRE AND CABLE MANAGEMENT MARKET, 2020–2024


FIGURE 51
COMPANY VALUATION


FIGURE 52
FINANCIAL METRICS


FIGURE 53
BRAND/PRODUCT COMPARISON


FIGURE 54
WIRE AND CABLE MANAGEMENT MARKET: COMPANY EVALUATION MATRIX (KEY PLAYERS), 2024


FIGURE 55
WIRE AND CABLE MANAGEMENT MARKET: COMPANY FOOTPRINT


FIGURE 56
WIRE AND CABLE MANAGEMENT MARKET: COMPANY EVALUATION MATRIX (STARTUPS/SMES), 2024


FIGURE 57
ABB: COMPANY SNAPSHOT


FIGURE 58
LEGRAND: COMPANY SNAPSHOT


FIGURE 59
ATKORE: COMPANY SNAPSHOT


FIGURE 60
EATON: COMPANY SNAPSHOT


FIGURE 61
NVENT: COMPANY SNAPSHOT


FIGURE 62
BELDEN INC.: COMPANY SNAPSHOT


FIGURE 63
SCHNEIDER ELECTRIC: COMPANY SNAPSHOT


FIGURE 64
HUBBELL: COMPANY SNAPSHOT


FIGURE 65
HILTI: COMPANY SNAPSHOT


FIGURE 66
TE CONNECTIVITY: COMPANY SNAPSHOT


FIGURE 67
SALZER: COMPANY SNAPSHOT


FIGURE 68
3M: COMPANY SNAPSHOT


FIGURE 69
ILLINOIS TOOL WORKS INC.: COMPANY SNAPSHOT


Methodology

The study involved major activities in estimating the current size of the wire and cable management market. Exhaustive secondary research was done to collect information on the peer and parent markets. The next step was to validate these findings, assumptions, and sizing with industry experts across the value chain through primary research. Both top-down and bottom-up approaches were employed to estimate the complete market size. Thereafter, market breakdown and data triangulation were used to estimate the market size of the segments and subsegments.

Secondary ReseThis research study on the wire and cable management market involved the use of extensive secondary sources, directories, and databases, such as Hoovers, Bloomberg, Businessweek, Factiva, International Energy Agency, and BP Statistical Review of World Energy, to identify and collect useful information for a technical, market-oriented, and commercial study of the global wire and cable management market. The other secondary sources included annual reports, press releases, and investor presentations of companies, white papers, certified publications, articles by recognized authors, manufacturer associations, trade directories, and databases.

Primary Research

The wire and cable management market comprises stakeholders such as wire and cable management product manufacturers, technology providers, and support providers in the supply chain. The demand side of this market is characterized by the rising demand for energy-efficient systems in countries due to increasing needs for sustainability, reduced carbon emissions, and cost-effective power generation. The supply side is characterized by rising demand for contracts from industrial users and utilities, and mergers & acquisitions among big players. Various primary sources from both the supply and demand sides of the market were interviewed to obtain qualitative and quantitative information. The following is the breakdown of primary respondents:

Wire and Cable Management Market Size, and Share

Note: “Others” include sales managers, engineers, and regional managers
The tiers of the companies are defined based on their total revenue as of 2024: Tier 1: >USD 1 billion, Tier
2: USD 500 million–1 billion, and Tier 3:

To know about the assumptions considered for the study, download the pdf brochure

Market Size Estimation

Both the top-down and bottom-up approaches were used to estimate and validate the size of the wire and cable management market and its dependent submarkets. The key players in the market were identified through secondary research, and their market share in the respective regions was obtained through primary and secondary research. The research methodology includes the study of the annual and financial reports of top market players and interviews with industry experts, such as chief executive officers, vice presidents, directors, sales managers, and marketing executives, for key quantitative and qualitative insights related to the wire and cable management market.

Wire and Cable Management Market : Top-Down and Bottom-Up Approach

Wire and Cable Management Market Top Down and Bottom Up Approach

Data Triangulation

After arriving at the overall market size from the estimation process explained above, the total market has been split into several segments and subsegments. To complete the overall market engineering process and arrive at the exact statistics for all the segments and subsegments, the data triangulation and market breakdown processes have been employed, wherever applicable. The data has been triangulated by studying various factors and trends from both the demand and supply sides. Along with this, the market has been validated using both the top-down and bottom-up approaches.

Market Definition

Wire and cable management products are components, systems, and accessories designed to organize, route, support, protect, and secure electrical wires and communication cables in residential, commercial, and industrial applications. These solutions include cable ties, clips, clamps, raceways, conduits, ducts, glands, trays, and related accessories that ensure safe installation, efficient routing, reduced clutter, protection against mechanical stress, and compliance with electrical and safety standards.

Stakeholders

  • Government and Research Organizations
  • Institutional Investors and Investment Banks
  • Investors/Shareholders
  • Environmental Research Institutes
  • Raw Material and Component Manufacturers
  • Cable Manufacturers, Dealers, and Suppliers
  • Petroleum Companies (Diesel and Natural Gas Suppliers)
  • Power Grid Infrastructure Companies
  • Power Plant Project Developers
  • Renewable Energy Companies
  • Manufacturers Associations
  • Process Industries and Power Industry Associations
  • Refinery Operators
  • Manufacturing Industry Players
  • Energy Efficiency Consultancies  

Report Objectives

  • To describe and forecast the wire and cable management market based on product, cable type, material, installation and end user, and region in terms of value
  • To assess the wire and cable management market based on region in terms of volume  
  • To evaluate the wire and cable management market for various segments with respect to five main regions: North America, Europe, Asia Pacific, South America, and the Middle East & Africa, in terms of value
  • To provide detailed information regarding the drivers, restraints, opportunities, and challenges influencing the growth of the market
  • To offer a detailed overview of the wire and cable management value chain analysis, use case analysis, key stakeholders and buying criteria, patent analysis, trade analysis, tariff analysis, regulations and codes, pricing analysis, Porter’s five forces analysis, impact of AI, and US Tariff impact.
  • To strategically analyze micromarkets1 with respect to individual growth trends, prospects, and contributions to the total market
  • To understand opportunities in the market for various stakeholders by identifying high-growth segments
  • To strategically profile key players and comprehensively analyze their market position in terms of ranking and core competencies2, along with detailing the market’s competitive landscape
  • To analyze growth strategies adopted by market players, such as joint ventures, acquisitions, and product launches, in the wire and cable management market

Micromarkets1 are defined as the segments and subsegments of the wire and cable management market included in the report.
Core competencies2 of companies are captured in terms of their key developments and product portfolios, as well as the key strategies adopted by them to sustain their position in the wire and cable management market.

Available Customizations

MarketsandMarkets offers customizations according to the specific needs of the companies with the given market data.

The following customization options are available for the report:

Product Analysis

  • Product matrix, which gives a detailed comparison of the product portfolio of each company

Geographic Analysis as per Feasibility

  • Further breakdown of the wire and cable management products, by country

Company Information

  • Detailed analysis and profiling of additional market players (up to five)

Key Questions Addressed by the Report

What was the wire and cable management market size in 2024?

The wire and cable management market size was USD 24.49 billion in 2024.

What are the major drivers for the wire and cable management market?

The wire and cable management market is mainly driven by strategic investments in power grid modernization, accelerating infrastructure, and increased housing construction and renovation.

Which region is projected to be the fastest-growing wire and cable management market during the forecast period?

Asia Pacific is expected to be the fastest-growing market during the forecast period due to rapid industrialization, infrastructure development, and digitalization across various sectors.

Which will be the largest segment, by cable type, in the wire and cable management market during the forecast period?

The power cables segment is expected to hold the dominant share of the wire and cable management market, which can be attributed to the increasing need for a reliable power supply in data centers, smart cities, and industrial automation.

Which segment is projected to be the largest end user in the wire and cable management market during the forecast period?

The industrial segment is estimated to account for the largest market share during the forecast period, owing to the extensive reliance on robust, efficient, and safe cable management solutions to support complex manufacturing processes and automation technologies.

Personalize This Research

  • Triangulate with your Own Data
  • Get Data as per your Format and Definition
  • Gain a Deeper Dive on a Specific Application, Geography, Customer or Competitor
  • Any level of Personalization
Request A Free Customisation

Let Us Help You

  • What are the Known and Unknown Adjacencies Impacting the Wire and Cable Management Market
  • What will your New Revenue Sources be?
  • Who will be your Top Customer; what will make them switch?
  • Defend your Market Share or Win Competitors
  • Get a Scorecard for Target Partners
Customized Workshop Request

Custom Market Research Services

We Will Customise The Research For You, In Case The Report Listed Above Does Not Meet With Your Requirements

Get 10% Free Customisation

Growth opportunities and latent adjacency in Wire and Cable Management Market

DMCA.com Protection Status